In multiphase flow in porous media, the relative permeability of a phase is a dimensionless measure of the effective permeability of that phase. It is the ratio of the effective permeability of that phase to the absolute permeability. It can be viewed as an adaptation of Darcy's law to multiphase flow.
For two-phase flow in porous media given steady-state conditions, we can write
where is the flux, is the pressure drop, is the viscosity. The subscript indicates that the parameters are for phase .
is here the phase permeability (i.e., the effective permeability of phase ), as observed through the equation above.
Relative permeability, , for phase is then defined from , as
where is the permeability of the porous medium in single-phase flow, i.e., the absolute permeability. Relative permeability must be between zero and one.
In applications, relative permeability is often represented as a function of water saturation; however, owing to capillary hysteresis one often resorts to a function or curve measured under drainage and another measured under imbibition.
Under this approach, the flow of each phase is inhibited by the presence of the other phases. Thus the sum of relative permeabilities over all phases is less than 1. However, apparent relative permeabilities larger than 1 have been obtained since the Darcean approach disregards the viscous coupling effects derived from momentum transfer between the phases (see assumptions below). This coupling could enhance the flow instead of inhibit it. This has been observed in heavy oil petroleum reservoirs when the gas phase flows as bubbles or patches (disconnected). [1]
Modelling assumptions
The above form for Darcy's law is sometimes also called Darcy's extended law, formulated for horizontal, one-dimensional, immiscible multiphase flow in homogeneous and isotropic porous media. The interactions between the fluids are neglected, so this model assumes that the solid porous media and the other fluids form a new porous matrix through which a phase can flow, implying that the fluid-fluid interfaces remain static in steady-state flow, which is not true, but this approximation has proven useful anyway.
Each of the phase saturations must be larger than the irreducible saturation, and each phase is assumed continuous within the porous medium.
Based on data from special core analysis laboratory (SCAL) experiments,[2] simplified models of relative permeability as a function of saturation (e.g. water saturation) can be constructed. This article will focus on an oil-water system.
Saturation scaling
Water saturation is the fraction of porevolume that is filled with water, and similar for oil saturation . Thus, saturations are in itselves scaled properties or variables. This gives the constraint
The model functions or correlations for relative permeabilities in an oil-water system are therefore usually written as functions of only water saturation, and this makes it natural to select water saturation as the horizontal axis in graphical presentations. Let (also denoted and sometimes ) be the irreducible (or minimal or connate) water saturation, and let be the residual (minimal) oil saturation after water flooding (imbibition). The flowing water saturation window in a water invasion / injection / imbibition process is bounded by a minimum value and a maximum value . In mathematical terms the flowing saturation window is written as
Normalization of water saturation values
By scaling the water saturation to the flowing saturation window, we get a (new or another) normalized water saturation value
and a normalized oil saturation value
Endpoints
Let be oil relative permeability, and let be water relative permeability. There are two ways of scaling phase permeability (i.e. effective permeability of the phase). If we scale phase permeability w.r.t. absolute water permeability (i.e. ), we get an endpoint parameter for both oil and water relative permeability. If we scale phase permeability w.r.t. oil permeability with irreducible water saturation present, endpoint is one, and we are left with only the endpoint parameter. In order to satisfy both options in the mathematical model, it is common to use two endpoint symbols in the model for two-phase relative permeability. The endpoints / endpoint parameters of oil and water relative permeabilities are
These symbols have their merits and limits. The symbol emphasize that it represents the top point of . It occurs at irreducible water saturation, and it is the largest value of that can occur for initial water saturation. The competing endpoint symbol occurs in imbibition flow in oil-gas systems. If the permeability basis is oil with irreducible water present, then . The symbol emphasizes that it is occurring at the residual oil saturation. An alternative symbol to is which emphasizes that the reference permeability is oil permeability with irreducible water present.
The oil and water relative permeability models are then written as
The functions and are called normalised relative permeabilities or shape functions for oil and water, respectively. The endpoint parameters and (which is a simplification of ) are physical properties that are obtained either before or together with the optimization of shape parameters present in the shape functions.
There are often many symbols in articles that discuss relative permeability models and modelling. A number of busy core analysts, reservoir engineers and scientists often skip using tedious and time-consuming subscripts, and write e.g. Krow instead of or or krow or oil relative permeability. A variety of symbols are therefore to be expected, and accepted as long as they are explained or defined.
The effects that slip or no-slip boundary conditions in pore flow have on endpoint parameters, are discussed by Berg et alios.[3][4]
Corey-model
An often used approximation of relative permeability is the Corey correlation [5][6][7] which is a power law in saturation. The Corey correlations of the relative permeability for oil and water are then
Example of Corey-correlation for imbibition flow with = and .
If the permeability basis is normal oil with irreducible water present, then .
The empirical parameters and are called curve shape parameters or simply shape parameters, and they can be obtained from measured data either by analytical interpretation of measured data, or by optimization using a core flow numerical simulator to match the experiment (often called history matching). is sometimes appropriate. The physical properties and are obtained either before or together with the optimizing of and .
In case of gas-water system or gas-oil system there are Corey correlations similar to the oil-water relative permeabilities correlations shown above.
LET-model
The Corey-correlation or Corey model has only one degree of freedom for the shape of each relative permeability curve, the shape parameter N. The LET-correlation[8][9] adds more degrees of freedom in order to accommodate the shape of relative permeability curves in SCAL experiments[2] and in 3D reservoir models that are adjusted to match historic production. These adjustments frequently includes relative permeability curves and endpoints.
Example of LET-correlation for imbibition flow with L,E,T all equal to 2 and .
The LET-type approximation is described by 3 parameters L, E, T. The correlation for water and oil relative permeability with water injection is thus
and
written using the same normalization as for Corey.
Only , , , and have direct physical meaning, while the parameters L, E and T are empirical. The parameter L describes the lower part of the curve, and by similarity and experience the L-values are comparable to the appropriate Corey parameter. The parameter T describes the upper part (or the top part) of the curve in a similar way that the L-parameter describes the lower part of the curve. The parameter E describes the position of the slope (or the elevation) of the curve. A value of one is a neutral value, and the position of the slope is governed by the L- and T-parameters. Increasing the value of the E-parameter pushes the slope towards the high end of the curve. Decreasing the value of the E-parameter pushes the slope towards the lower end of the curve. Experience using the LET correlation indicates the following reasonable ranges for the parameters L, E, and T: L ≥ 0.1, E > 0 and T ≥ 0.1.
In case of gas-water system or gas-oil system there are LET correlations similar to the oil-water relative permeabilities correlations shown above.
Evaluations
After Morris Muskat et alios established the concept of relative permeability in late 1930'ies, the number of correlations, i.e. models, for relative permeability has steadily increased. This creates a need for evaluation of the most common correlations at the current time. Two of the latest (per 2019) and most thorough evaluations are done by Moghadasi et alios[10] and by Sakhaei et alios.[11] Moghadasi et alios[10] evaluated Corey, Chierici and LET correlations for oil/water relative permeability using a sophisticated method that takes into account the number of uncertain model parameters. They found that LET, with the largest number (three) of uncertain parameters, was clearly the best one for both oil and water relative permeability. Sakhaei et alios[11] evaluated 10 common and widely used relative permeability correlations for gas/oil and gas/condensate systems, and found that LET showed best agreement with experimental values for both gas and oil/condensate relative permeability.
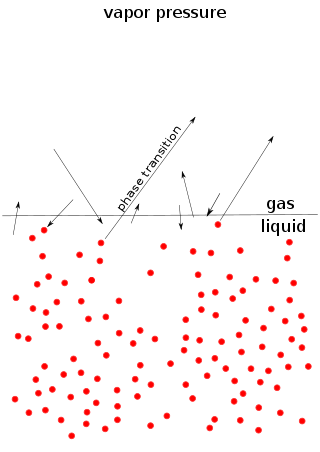
Vapor pressure or equilibrium vapor pressure is the pressure exerted by a vapor in thermodynamic equilibrium with its condensed phases at a given temperature in a closed system. The equilibrium vapor pressure is an indication of a liquid's thermodynamic tendency to evaporate. It relates to the balance of particles escaping from the liquid in equilibrium with those in a coexisting vapor phase. A substance with a high vapor pressure at normal temperatures is often referred to as volatile. The pressure exhibited by vapor present above a liquid surface is known as vapor pressure. As the temperature of a liquid increases, the attractive interactions between liquid molecules become less significant in comparison to the entropy of those molecules in the gas phase, increasing the vapor pressure. Thus, liquids with strong intermolecular interactions are likely to have smaller vapor pressures, with the reverse true for weaker interactions.
Permeability in fluid mechanics and the Earth sciences is a measure of the ability of a porous material to allow fluids to pass through it.
Darcy's law is an equation that describes the flow of a fluid through a porous medium. The law was formulated by Henry Darcy based on results of experiments on the flow of water through beds of sand, forming the basis of hydrogeology, a branch of earth sciences. It is analogous to Ohm's law in electrostatics, linearly relating the volume flow rate of the fluid to the hydraulic head difference via the hydraulic conductivity.
In science and engineering, hydraulic conductivity, is a property of porous materials, soils and rocks,< that describes the ease with which a fluid can move through the pore space, or fractures network. It depends on the intrinsic permeability of the material, the degree of saturation, and on the density and viscosity of the fluid. Saturated hydraulic conductivity, Ksat, describes water movement through saturated media. By definition, hydraulic conductivity is the ratio of volume flux to hydraulic gradient yielding a quantitative measure of a saturated soil's ability to transmit water when subjected to a hydraulic gradient.
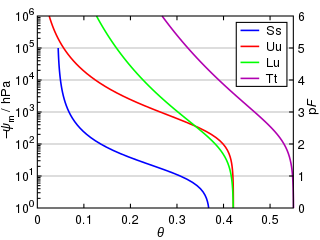
Water retention curve is the relationship between the water content, θ, and the soil water potential, ψ. This curve is characteristic for different types of soil, and is also called the soil moisture characteristic.
In fluid statics, capillary pressure is the pressure between two immiscible fluids in a thin tube, resulting from the interactions of forces between the fluids and solid walls of the tube. Capillary pressure can serve as both an opposing or driving force for fluid transport and is a significant property for research and industrial purposes. It is also observed in natural phenomena.
In petrophysics, Archie's law relates the in-situ electrical conductivity (C) of a porous rock to its porosity and fluid saturation of the pores:
The Richards equation represents the movement of water in unsaturated soils, and is attributed to Lorenzo A. Richards who published the equation in 1931. It is a quasilinear partial differential equation; its analytical solution is often limited to specific initial and boundary conditions. Proof of the existence and uniqueness of solution was given only in 1983 by Alt and Luckhaus. The equation is based on Darcy-Buckingham law representing flow in porous media under variably saturated conditions, which is stated as
In fluid dynamics, the Buckley–Leverett equation is a conservation equation used to model two-phase flow in porous media. The Buckley–Leverett equation or the Buckley–Leverett displacement describes an immiscible displacement process, such as the displacement of oil by water, in a one-dimensional or quasi-one-dimensional reservoir. This equation can be derived from the mass conservation equations of two-phase flow, under the assumptions listed below.
In petroleum engineering, the Leverett J-function is a dimensionless function of water saturation describing the capillary pressure,
HydroGeoSphere (HGS) is a 3D control-volume finite element groundwater model, and is based on a rigorous conceptualization of the hydrologic system consisting of surface and subsurface flow regimes. The model is designed to take into account all key components of the hydrologic cycle. For each time step, the model solves surface and subsurface flow, solute and energy transport equations simultaneously, and provides a complete water and solute balance.
The Kozeny–Carman equation is a relation used in the field of fluid dynamics to calculate the pressure drop of a fluid flowing through a packed bed of solids. It is named after Josef Kozeny and Philip C. Carman. The equation is only valid for creeping flow, i.e. in the slowest limit of laminar flow. The equation was derived by Kozeny (1927) and Carman from a starting point of (a) modelling fluid flow in a packed bed as laminar fluid flow in a collection of curving passages/tubes crossing the packed bed and (b) Poiseuille's law describing laminar fluid flow in straight, circular section pipes.
The Amott test is one of the most widely used empirical wettability measurements for reservoir cores in petroleum engineering. The method combines two spontaneous imbibition measurements and two forced displacement measurements. This test defines two different indices: the Amott water index and the Amott oil index.
Nuclear magnetic resonance (NMR) in porous materials covers the application of using NMR as a tool to study the structure of porous media and various processes occurring in them. This technique allows the determination of characteristics such as the porosity and pore size distribution, the permeability, the water saturation, the wettability, etc.
In statistics, the phi coefficient is a measure of association for two binary variables.
The black-oil equations are a set of partial differential equations that describe fluid flow in a petroleum reservoir, constituting the mathematical framework for a black-oil reservoir simulator. The term black-oil refers to the fluid model, in which water is modeled explicitly together with two hydrocarbon components, one (pseudo) oil phase and one (pseudo-)gas phase. This is in contrast with a compositional formulation, in which each hydrocarbon component is handled separately.
Morris Muskat was an American petroleum engineer. Muskat refined Darcy's equation for single phase flow, and this change made it suitable for the petroleum industry. Based on experimental results worked out by his colleagues, Muskat and Milan W. Meres also generalized Darcy's law to cover multiphase flow of water, oil and gas in the porous medium of a petroleum reservoir. The generalized flow equation provides the analytical foundation for reservoir engineering that exists to this day.
Morris Muskat et al. developed the governing equations for multiphase flow in porous media as a generalisation of Darcy's equation for water flow in porous media. The porous media are usually sedimentary rocks such as clastic rocks or carbonate rocks.
In petroleum engineering, TEM, also called TEM-function developed by Abouzar Mirzaei-Paiaman, is a criterion to characterize dynamic two-phase flow characteristics of rocks. TEM is a function of relative permeability, porosity, absolute permeability and fluid viscosity, and can be determined for each fluid phase separately. TEM-function has been derived from Darcy's law for multiphase flow.
In petroleum engineering, Lak wettability index is a quantitative indicator to measure wettability of rocks from relative permeability data. This index is based on a combination of Craig's first rule. and modified Craig's second rule
References
↑ Bravo, M.C.; Araujo, M. (2008). "Analysis of the Unconventional Behavior of Oil Relative Permeability during Depletion Tests of Gas-Saturated Heavy Oils". International Journal of Multiphase Flow. 34 (5): 447–460. doi:10.1016/j.ijmultiphaseflow.2007.11.003.
1 2 McPhee, C.; Reed, J.; Zubizarreta, I. (2015). Core Analysis: A Best Practice Guide. Elsevier. ISBN978-0-444-63533-4.
↑ Berg, S.; Cense, A.W.; Hofman, J.P.; Smits, R.M.M. (2007). "Flow in Porous Media with Slip Boundary Condition". Paper SCA2007-13 Presented at the 2007 International Symposium of the SCA, Calgary, Canada, 10 - 12 September, 2007.
↑ Berg, S.; Cense, A.W.; Hofman, J.P.; Smits, R.M.M. (2008). "Two-Phase Flow in Porous Media with Slip Boundary Condition". Transport in Porous Media. 74 (3): 275–292. doi:10.1007/s11242-007-9194-4. S2CID37627662.
↑ Goda, H.M.; Behrenbruch, P. (2004). Using a Modified Brooks-Corey Model to Study Oil-Water Relative Permeability for Diverse Pore Structures. doi:10.2118/88538-MS. ISBN978-1-55563-979-2.{{cite book}}: |journal= ignored (help)
↑ Corey, A.T. (Nov 1954). "The Interrelation Between Gas and Oil Relative Permeabilities". Prod. Monthly. 19 (1): 38–41.
↑ Lomeland, F.; Ebeltoft, E.; Thomas, W.H. (2005). "A New Versatile Relative Permeability Correlation"(PDF). Proceedings of the 2005 International Symposium of the SCA, Abu Dhabi, United Arab Emirates, October 31 - November 2, 2005.
1 2 Moghadasi, L.; Guadagnini, A.; Inzoli, F.; Bartosek, M. (2015). "Interpretation of two-phase relative permeability curves through multiple formulations and model quality criteria". Journal of Petroleum Science and Engineering. 135: 738–749. doi:10.1016/j.petrol.2015.10.027. hdl:11311/968828.
1 2 Sakhaei, Z.; Azin, R.; Osfouri, S. (2016). "Assessment of empirical/theoretical relative permeability correlations for gas-oil/condensate systems". Paper Presented at the 1st Persian Gulf Oil, Gas and Petrochemical Biennal Conference Held at the Persian Gulf University in, Bushehr, Iran, 20 April, 2016.
This page is based on this Wikipedia article Text is available under the CC BY-SA 4.0 license; additional terms may apply. Images, videos and audio are available under their respective licenses.