Results of the 2019 Australian federal election in Western Australia

Last updated

2019 Australian federal election
(Western Australia)
Flag of Western Australia.svg
  2016 18 May 2019 2022  

All 16 Western Australian seats in the Australian House of Representatives
and 6 seats in the Australian Senate
 First partySecond party
  Scott Morrison 2014 crop.jpg Bill Shorten-crop.jpg
Leader Scott Morrison Bill Shorten
Party Liberal/National coalition Labor
Last election11 seats5 seats
Seats won11 seats5 seats
Seat changeSteady2.svgSteady2.svg
Popular vote633,930417,727
Percentage45.22%29.80%
SwingDecrease2.svg 3.48Decrease2.svg 2.65
TPP 55.55%44.45%
TPP swingIncrease2.svg 0.89Decrease2.svg 0.89

This is a list of electoral division results for the 2019 Australian federal election in the state of Western Australia. [1]

Contents

This election was held using instant runoff voting. There were two "turn-overs" at this election. Labor won the seats of Cowan and Perth despite the Liberals finishing first.

Overall results

PartyVotes %SwingSeatsChange
Liberal/National Coalition
   Liberal Party of Australia 613,91543.79−1.9111Steady2.svg
  National Party of Australia 20,0151.43−1.570Steady2.svg
Coalition total 633,93045.22-3.4811Steady2.svg
  Australian Labor Party 417,72729.80−2.655Steady2.svg
  Australian Greens 162,87611.62−0.44
  Pauline Hanson's One Nation 74,4785.31+5.31
  United Australia Party 28,4882.03+2.03
  Western Australia Party 25,2981.80+1.80
  Australian Christians 23,8021.70−0.86
  Shooters, Fishers and Farmers Party 10,9660.78+0.33
  Fraser Anning's Conservative National Party 3,5750.26+0.26
  Science Party 1,3290.09+0.09
  Animal Justice Party 1,3040.09+0.09
  Socialist Alliance 9900.07−0.03
  The Great Australian Party 8830.06+0.06
  VOTEFLUX 6020.04+0.04
  Australia First Party 2510.02+0.02
  Independent 15,3751.10−0.20
Total1,401,87416
Two-party-preferred vote
  Liberal/National Coalition 778,78155.55+0.8911Steady2.svg
  Labor 623,09344.45−0.895Steady2.svg
Invalid/blank votes80,5755.44+1.45
Registered voters/turnout1,646,26290.05+1.67
Source: AEC Tally Room

Results by division

Brand

2019 Australian federal election: Brand [2]
PartyCandidateVotes%±%
Labor Madeleine King 35,87540.38−7.10
Liberal Jack Pleiter26,51029.84−1.78
Greens Jody Freeman9,86311.10−0.58
One Nation Travis Carter7,5248.47+8.47
Christians Janine Vander Ven2,7263.07−0.39
United Australia Trevor Jones2,5702.89+2.89
Western Australia Blake Phelan2,3972.70+2.70
Conservative National Karen-Lee Mills1,3761.55+1.55
Total formal votes88,84193.74−2.04
Informal votes5,9286.26+2.04
Turnout 94,76988.57+1.53
Two-party-preferred result
Labor Madeleine King 50,33356.66−4.77
Liberal Jack Pleiter38,50843.34+4.77
Labor hold Swing −4.77

Burt

2019 Australian federal election: Burt [3]
PartyCandidateVotes%±%
Labor Matt Keogh 36,05840.96−6.07
Liberal David Goode29,42033.42−1.95
Greens Simone Collins8,2859.41+1.38
One Nation Nicole Devincentis5,1165.81+5.81
Christians Warnar Spyker3,2983.75−1.40
Shooters, Fishers, Farmers Peter Raffaelli1,9422.21−2.22
United Australia Sahil Chawla1,8712.13+2.13
Independent Naomi Nation1,1491.31+1.31
Western Australia Sarcha Sagisaka9011.02+1.02
Total formal votes88,04093.58−2.00
Informal votes6,0426.42+2.00
Turnout 94,08289.42+0.69
Two-party-preferred result
Labor Matt Keogh 48,41454.99−2.12
Liberal David Goode39,62645.01+2.12
Labor hold Swing −2.12

Canning

2019 Australian federal election: Canning [4]
PartyCandidateVotes%±%
Liberal Andrew Hastie 44,58049.05−1.25
Labor Mellisa Teede24,99627.50−5.54
Greens Jodie Moffat6,8407.53−1.21
One Nation Jackson Wreford6,5037.15+7.15
Western Australia Brett Clarke2,5542.81+2.81
United Australia Steve Veevers2,0552.26+2.26
Christians Jamie Van Burgel1,7641.94−1.74
Conservative National Malcolm Heffernan1,6001.76+1.76
Total formal votes90,89293.91−1.85
Informal votes5,8906.09+1.85
Turnout 96,78290.30+1.08
Two-party-preferred result
Liberal Andrew Hastie 55,94761.55+4.76
Labor Mellisa Teede34,94538.45−4.76
Liberal hold Swing +4.76

Cowan

2019 Australian federal election: Cowan [5]
PartyCandidateVotes%±%
Liberal Isaac Stewart33,43839.41−2.81
Labor Anne Aly 32,35338.13−3.55
Greens Mark Cooper8,55110.08+2.48
One Nation Sheila Mundy4,7775.63+5.63
United Australia Peter Westcott2,1712.56+2.56
Christians Andre Lebrasse1,9812.33−0.96
Shooters, Fishers, Farmers Paul Bedford1,5821.86−0.95
Total formal votes84,85394.59+0.06
Informal votes4,8505.41−0.06
Turnout 89,70390.91+1.31
Two-party-preferred result
Labor Anne Aly 43,13550.83+0.15
Liberal Isaac Stewart41,71849.17−0.15
Labor hold Swing +0.15

Curtin

2019 Australian federal election: Curtin [6]
PartyCandidateVotes%±%
Liberal Celia Hammond 48,25654.18−11.32
Labor Rob Meecham15,69217.62+1.91
Greens Cameron Pidgeon13,84715.55+1.35
Independent Louise Stewart6,9027.75+7.75
Western Australia Andrew Mangano1,3431.51+1.51
United Australia Joan Lever1,1141.25+1.25
One Nation Bill Edgar1,0541.18+1.18
Christians Deonne Kingsford8540.96+0.96
Total formal votes89,06296.82−1.16
Informal votes2,9273.18+1.16
Turnout 91,98991.65+1.90
Two-party-preferred result
Liberal Celia Hammond 57,29664.33−6.37
Labor Rob Meecham31,76635.67+6.37
Liberal hold Swing −6.37

Durack

2019 Australian federal election: Durack [7]
PartyCandidateVotes%±%
Liberal Melissa Price 34,42944.30+2.56
Labor Sharyn Morrow16,74221.54−4.36
National Scott Bourne7,87810.14−5.84
One Nation Grahame Gould7,4079.53+9.53
Greens Johani Mamid6,2878.09−1.96
Western Australia Gary Mounsey2,8953.72+3.72
United Australia Brenden Hatton2,0832.68+2.68
Total formal votes77,72195.23−0.86
Informal votes3,8924.77+0.86
Turnout 81,61384.08+2.05
Two-party-preferred result
Liberal Melissa Price 50,33264.76+3.70
Labor Sharyn Morrow27,38935.24−3.70
Liberal hold Swing +3.70

Forrest

2019 Australian federal election: Forrest [8]
PartyCandidateVotes%±%
Liberal Nola Marino 47,47052.48+3.04
Labor Wayne Sanford19,12621.14−2.00
Greens Nerilee Boshammer11,64512.87+0.90
One Nation Kalven Jamieson5,3715.94+5.94
Shooters, Fishers, Farmers Mark McCall2,8813.18+3.18
United Australia Dale Bromley1,5641.73+1.73
Independent Alexander Marsden1,2381.37+1.37
Western Australia Ian Molyneux1,1671.29+1.29
Total formal votes90,46294.35+0.21
Informal votes5,4185.65−0.21
Turnout 95,88090.95+1.23
Two-party-preferred result
Liberal Nola Marino 58,40564.56+2.00
Labor Wayne Sanford32,05735.44−2.00
Liberal hold Swing +2.00

Fremantle

2019 Australian federal election: Fremantle [9]
PartyCandidateVotes%±%
Labor Josh Wilson 34,63638.02−2.97
Liberal Nicole Robins31,86234.97−1.90
Greens Jesse Hutchinson14,57416.00−1.74
One Nation Brett Weary3,4853.83+3.83
Western Australia Janetia Knapp2,3332.56+2.56
United Australia Fatima Lever1,7671.94+1.94
Christians Laetisia Mulder1,4561.60+1.60
Socialist Alliance Sam Wainwright9901.09−0.56
Total formal votes91,10394.60−1.40
Informal votes5,1995.40+1.40
Turnout 96,30291.38+2.57
Two-party-preferred result
Labor Josh Wilson 51,85256.92−0.60
Liberal Nicole Robins39,25143.08+0.60
Labor hold Swing −0.60

Hasluck

2019 Australian federal election: Hasluck [10]
PartyCandidateVotes%±%
Liberal Ken Wyatt 36,73743.62−1.33
Labor James Martin25,79430.63−4.63
Greens Lee-Anne Miles9,64811.46−1.20
One Nation Tim Orr4,4455.28+5.28
Shooters, Fishers, Farmers Fiona White-Hartig2,4412.90+2.90
United Australia Mike Dale1,9292.29+2.29
Christians Brady Williams1,6781.99−1.45
Western Australia Stephen Phelan1,5461.84+1.84
Total formal votes84,21894.52−1.44
Informal votes4,8805.48+1.44
Turnout 89,09890.34+1.52
Two-party-preferred result
Liberal Ken Wyatt 46,49455.21+3.16
Labor James Martin37,72444.79−3.16
Liberal hold Swing +3.16

Moore

2019 Australian federal election: Moore [11]
PartyCandidateVotes%±%
Liberal Ian Goodenough 45,50351.25−3.73
Labor Tony O'Gorman 21,76024.51−4.18
Greens Daniel Vujcich10,73512.09−0.59
One Nation Tyler Walsh4,1134.63+4.63
Independent Ziggi Murphy2,3902.69+2.69
United Australia Rod Chilcott1,5911.79+1.79
Western Australia Jen Jacobs1,4281.61+1.61
Christians Rex Host1,2591.42−2.23
Total formal votes88,77994.92−1.88
Informal votes4,7485.08+1.88
Turnout 93,52792.12+1.58
Two-party-preferred result
Liberal Ian Goodenough 54,73561.65+0.63
Labor Tony O'Gorman 34,04438.35−0.63
Liberal hold Swing +0.63

O'Connor

2019 Australian federal election: O'Connor [12]
PartyCandidateVotes%±%
Liberal Rick Wilson 36,13542.04−0.63
Labor Shelley Payne 18,24321.22+0.30
National John Hassell10,79512.56−5.77
One Nation Dean Smith7,2528.44+8.44
Greens Nelson Gilmour7,2458.43−1.94
Christians Ian 't Hart2,5272.94−1.08
United Australia Anthony Fels 1,5981.86+1.86
Western Australia Peter Swift1,2791.49+1.49
Great Australian Nicholas Robinson8831.03+1.03
Total formal votes85,95793.69−2.50
Informal votes5,7856.31+2.50
Turnout 91,74290.03+1.24
Two-party-preferred result
Liberal Rick Wilson 55,42164.48−0.56
Labor Shelley Payne 30,53635.52+0.56
Liberal hold Swing −0.56

Pearce

2019 Australian federal election: Pearce [13]
PartyCandidateVotes%±%
Liberal Christian Porter 43,68943.72−1.72
Labor Kim Travers29,02729.05−5.20
Greens Eugene Marshall8,6768.68−2.28
One Nation Sandy Old8,1998.21+8.21
United Australia Rob Forster2,4952.50+2.50
Shooters, Fishers, Farmers Ross Williamson2,1252.13+2.13
Christians Magdeleen Strauss1,6091.61+1.61
Independent Colin Butland1,4561.46+1.46
National Steve Blyth1,3421.34−3.35
Western Australia Michael Calautti1,3051.31+1.31
Total formal votes99,92393.03−2.42
Informal votes7,4916.97+2.42
Turnout 107,41489.82+2.47
Two-party-preferred result
Liberal Christian Porter 57,47857.52+3.89
Labor Kim Travers42,44542.48−3.89
Liberal hold Swing +3.89

Perth

2019 Australian federal election: Perth [14]
PartyCandidateVotes%±%
Liberal Jim Grayden32,80037.40−4.91
Labor Patrick Gorman 30,20734.44−2.92
Greens Caroline Perks16,55218.87+1.80
One Nation Mel Lownds2,3332.66+2.66
Western Australia Jane Boxall2,2222.53+2.53
United Australia Chas Hopkins 1,6611.89+1.89
Science Gary Davies1,3291.52+1.52
VOTEFLUX.ORG Curtis Greening6020.69+0.69
Total formal votes87,70695.41−0.82
Informal votes4,2204.59+0.82
Turnout 91,92690.65+2.61
Two-party-preferred result
Labor Patrick Gorman 48,17654.93+1.60
Liberal Jim Grayden39,53045.07−1.60
Labor hold Swing +1.60

Stirling

2019 Australian federal election: Stirling [15]
PartyCandidateVotes%±%
Liberal Vince Connelly 40,75746.97−2.48
Labor Melita Markey27,62331.83−0.34
Greens Judith Cullity10,43912.03+0.35
One Nation Angus Young3,1293.61+3.61
Western Australia Elizabeth Re1,7502.02+2.02
United Australia Dorothy Hutton1,5771.82+1.82
Christians Kevin Host1,5041.73−0.71
Total formal votes86,77995.32−0.53
Informal votes4,2594.68+0.53
Turnout 91,03889.97+2.24
Two-party-preferred result
Liberal Vince Connelly 48,28955.65−0.47
Labor Melita Markey38,49044.35+0.47
Liberal hold Swing −0.47

Swan

2019 Australian federal election: Swan [16]
PartyCandidateVotes%±%
Liberal Steve Irons 37,59144.68−3.50
Labor Hannah Beazley 27,95333.22+0.21
Greens Liberty Cramer10,37212.33−2.69
One Nation Tshung-Hui Chang2,0382.42+2.42
United Australia Peter McLernon1,4831.76+1.76
Christians Steve Klomp1,4501.72−2.07
Animal Justice Virginia Thomas-Wurth1,3021.55+1.55
Western Australia Sharron Hawkins Zeeb1,1021.31+1.31
Conservative National Carmel Addink6010.71+0.71
Australia First Michael Chehoff2510.30+0.30
Total formal votes84,14394.19−2.18
Informal votes5,1905.81+2.18
Turnout 89,33388.64+1.80
Two-party-preferred result
Liberal Steve Irons 44,35752.72−0.87
Labor Hannah Beazley 39,78647.28+0.87
Liberal hold Swing −0.87

Tangney

2019 Australian federal election: Tangney [17]
PartyCandidateVotes%±%
Liberal Ben Morton 44,74053.63+4.82
Labor Marion Boswell21,64425.95+2.40
Greens Martin Spencer9,31911.17−1.22
Independent Jillian Horton1,9332.32+2.32
One Nation Scott Rafferty1,7322.08+2.08
Christians Mark Staer1,6952.03−1.34
Western Australia Gavin Waugh1,0801.29+1.29
United Australia Chris Fernandez9691.16+1.16
Independent Paul Waddy3070.37+0.37
Total formal votes83,41995.61−1.84
Informal votes3,8314.39+1.84
Turnout 87,25092.47+1.27
Two-party-preferred result
Liberal Ben Morton 51,27561.47+0.40
Labor Marion Boswell32,14438.53−0.40
Liberal hold Swing +0.40

Related Research Articles

<span class="mw-page-title-main">Division of Swan</span> Australian federal electoral division

The Division of Swan is an Australian electoral division located in Western Australia.

<span class="mw-page-title-main">Division of Stirling</span> Australian federal electoral division

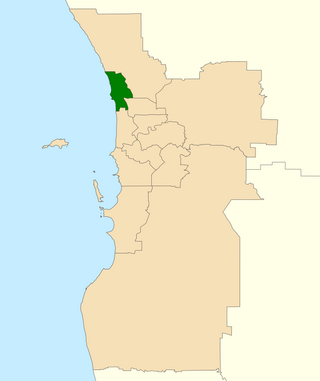
The Division of Stirling was an Australian electoral division in the inner northern and beachside suburbs of Perth, Western Australia, which included a large portion of the local government area of the City of Stirling.

<span class="mw-page-title-main">Division of Cowan</span> Australian federal electoral division

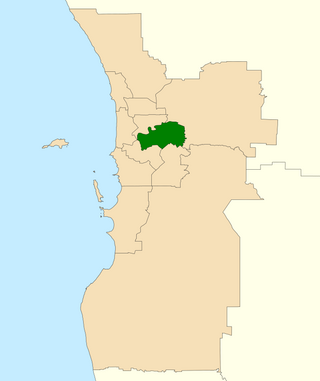
The Division of Cowan is an Australian Electoral Division in Western Australia.

<span class="mw-page-title-main">Division of Curtin</span> Australian federal electoral division

The Division of Curtin is an Australian electoral division in Western Australia.

<span class="mw-page-title-main">Division of Hasluck</span> Australian federal electoral division

The Division of Hasluck is an electoral division of the Australian House of Representatives, located in Western Australia.

<span class="mw-page-title-main">Division of Perth</span> Australian federal electoral division

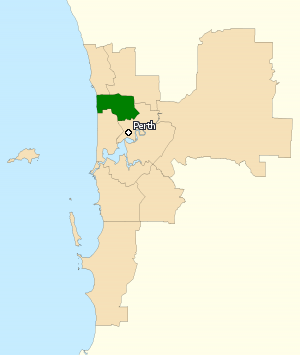
The Division of Perth is an Australian electoral division in the state of Western Australia. It is named after Perth, the capital city of Western Australia, where the Division is located.

<span class="mw-page-title-main">Division of Moore</span> Australian federal electoral division

The Division of Moore is an Australian electoral division in the state of Western Australia.

Luke Xavier Linton Simpkins is a former Australian politician who served as a member of the House of Representatives from 2007 to 2016. He represented the Division of Cowan in Western Australia for the Liberal Party.

This article lists electoral results for the Division of Fremantle in Australian federal elections from the division's creation in 1901 to the present.

This is a list of electoral results for the Division of Cowan in Australian federal elections from the division's creation in 1984 until the present.

This is a list of electoral results for the Division of Forrest in Australian federal elections from the division's creation in 1922 until the present.

This is a list of electoral results for the Division of Hasluck in Australian federal elections from the division's creation in 2001 until the present.

This is a list of electoral results for the Division of Moore in Australian federal elections from the division's creation in 1949 until the present.

This is a list of electoral results for the Division of O'Connor in Australian federal elections from the division's creation in 1980 until the present.

This is a list of electoral results for the Division of Pearce in Australian federal elections from the division's creation in 1990 until the present.

This is a list of electoral results for the Division of Perth in Australian federal elections from the division's creation in 1901 until the present.

This is a list of electoral results for the Division of Swan in Australian federal elections from the division's creation in 1901 until the present.

This is a list of electoral results for the Division of Tangney in Australian federal elections from the division's creation in 1974 until the present.

<span class="mw-page-title-main">Results of the 2016 Australian federal election in Western Australia</span>

This is a list of electoral division results for the 2016 Australian federal election in the state of Western Australia.

<span class="mw-page-title-main">Results of the 2022 Australian federal election in Western Australia</span> Federal election results in Western Australia

The 2022 Australian federal election was held on 21 May 2022 to elect all 151 members of the Australian House of Representatives and 40 of 76 members of the Australian Senate. Of those, 15 MPs and 6 senators were elected to represent the state of Western Australia.

References

  1. "First preferences by party - WA". AEC Tally Room. Australian Electoral Commission. Retrieved 19 May 2019.
  2. Brand, WA, Tally Room 2019, Australian Electoral Commission.
  3. Burt, WA, Tally Room 2019, Australian Electoral Commission.
  4. Canning, WA, Tally Room 2019, Australian Electoral Commission.
  5. Cowan, WA, Tally Room 2019, Australian Electoral Commission.
  6. Curtin, WA, Tally Room 2019, Australian Electoral Commission.
  7. Durack, WA, Tally Room 2019, Australian Electoral Commission.
  8. Forrest, WA, Tally Room 2019, Australian Electoral Commission.
  9. Fremantle, WA, Tally Room 2019, Australian Electoral Commission.
  10. Hasluck, WA, Tally Room 2019, Australian Electoral Commission.
  11. Moore, WA, Tally Room 2019, Australian Electoral Commission.
  12. O'Connor, WA, Tally Room 2019, Australian Electoral Commission.
  13. Pearce, WA, Tally Room 2019, Australian Electoral Commission.
  14. Perth, WA, Tally Room 2019, Australian Electoral Commission.
  15. Stirling, WA, Tally Room 2019, Australian Electoral Commission.
  16. Swan, WA, Tally Room 2019, Australian Electoral Commission.
  17. Tangney, WA, Tally Room 2019, Australian Electoral Commission.