Results of the 2022 Australian federal election in New South Wales

Last updated

2022 Australian federal election
(New South Wales)
Flag of New South Wales.svg
  2019 21 May 2022

All 47 New South Wales seats in the Australian House of Representatives
and 6 seats in the Australian Senate
 First partySecond party
  Anthony Albanese portrait (cropped).jpg Prime Minister of Australia Scott Morrison.jpg
Leader Anthony Albanese Scott Morrison
Party Labor Liberal/National coalition
Last election24 seats22 seats
Seats won2616
Seat changeIncrease2.svg 2Decrease2.svg 6
Popular vote1,552,6841,699,324
Percentage33.38%36.54%
SwingDecrease2.svg 1.18Decrease2.svg 6.01
TPP 51.42%48.58%
TPP swingIncrease2.svg 3.20Decrease2.svg 3.20

2022 Australian federal election in New South Wales.svg
Results by division for the House of Representatives, shaded by winning party's margin of victory.

This is a list of electoral division results for the 2022 Australian federal election in the state of New South Wales.

Contents

This election was held using Instant-runoff voting (often referred to locally as preferential voting), a form of ranked voting where voters order candidates in order of preference. The number of first preferences for each candidate is first counted, and then the candidate with the lowest number of votes is eliminated and their votes are each transferred to the remaining candidate which they gave the highest preference to. This process of eliminating and transferring the votes of the last-placed remaining candidates is repeated until there are only two candidates left, at which point the candidate with more votes (including those transferred) wins. This can mean that a candidate who does not have the most first preferences can be elected if no candidate takes majority of votes in the first count and that candidate accumulates enough transferred votes to overtake the original leader.

In this election there were seven such reversals in New South Wales—Labor won three seats where the Liberal candidate had the most first preferences (Bennelong, Gilmore and Robertson), and independent candidates won four seats where the Liberals or Labor had the most first preferences (Labor in Fowler and the Liberals in Mackellar, North Sydney and Wentworth).

Overall results

House of Representatives (IRV) – Turnout 90.63% (CV)
PartyVotes %Swing (pp)SeatsChange (seats)
   Liberal Party of Australia 1,316,13428.30−4.499Decrease2.svg 6
  National Party of Australia 383,1898.24−1.527Steady2.svg 0
Liberal/National Coalition 1,699,32436.54−6.0116Decrease2.svg 6
  Australian Labor Party 1,552,68433.38−1.1826Increase2.svg 2
  Australian Greens 466,06910.02+1.310Steady2.svg
  Pauline Hanson's One Nation 224,9654.84+3.530Steady2.svg
  United Australia Party 183,1743.94+0.560Steady2.svg
  Liberal Democratic Party 96,8982.08+1.650Steady2.svg
  Animal Justice Party 16,9790.37−0.290Steady2.svg
  Shooters, Fishers and Farmers Party 14,7270.32−0.080Steady2.svg
  Informed Medical Options Party 14,1710.30+0.270Steady2.svg
  Fusion 8,5200.18+0.180Steady2.svg
  Indigenous-Aboriginal Party of Australia 7,3260.16+0.160Steady2.svg
  Sustainable Australia 3,4230.07−0.530Steady2.svg
  Australian Federation Party 2,6470.06+0.060Steady2.svg
  Australian Citizens Party 2,3720.05+0.050Steady2.svg
  TNL 1,7040.04+0.040Steady2.svg
  Socialist Alliance 1,5180.03+0.030Steady2.svg
  Drew Pavlou Democratic Alliance 1,2080.03+0.030Steady2.svg
  Australian Democrats 6510.01+0.010Steady2.svg
  Independent 351,6207.56+2.945Increase2.svg 4
 Non Affiliated9610.02+0.020Steady2.svg
Total4,650,940100.0047Steady2.svg
Invalid/blank votes308,6446.22−0.79
Turnout4,959,58490.70−1.46
Registered voters5,467,993
Two-party-preferred vote
Labor 2,391,30151.42+3.20
Liberal/National Coalition 2,259,63948.58−3.20
Source: AEC for both and

Results by division

Banks

2022 Australian federal election: Banks [1]
PartyCandidateVotes%±%
Liberal David Coleman 41,62245.22−5.70
Labor Zhi Soon32,45935.26−1.09
Greens Natalie Hanna8,0638.76+2.94
United Australia Marika Momircevski5,0485.48+3.27
One Nation Malcolm Heffernan2,6282.86+2.86
Liberal Democrats Elouise Cocker1,2641.37+1.37
Steve Khouw9611.04+1.04
Total formal votes92,04593.36+0.56
Informal votes6,5506.64−0.56
Turnout 98,59591.55−1.48
Two-party-preferred result
Liberal David Coleman 48,96953.20−3.06
Labor Zhi Soon43,07646.80+3.06
Liberal hold Swing −3.06

Barton

2022 Australian federal election: Barton [2]
PartyCandidateVotes%±%
Labor Linda Burney 46,20650.43+1.24
Liberal John Goody23,99226.19−7.30
Greens Taylor Vandijk11,44112.49+3.46
United Australia Dimitri Honos5,6116.12+3.83
One Nation Phillip Pollard4,3734.77+1.11
Total formal votes91,62392.52+2.05
Informal votes7,4057.48−2.05
Turnout 99,02889.72−1.46
Two-party-preferred result
Labor Linda Burney 60,05465.54+6.13
Liberal John Goody31,56934.46−6.13
Labor hold Swing +6.13

Bennelong

2022 Australian federal election: Bennelong [3]
PartyCandidateVotes%±%
Liberal Simon Kennedy 41,20641.35−9.47
Labor Jerome Laxale 37,59637.73+3.70
Greens Tony Adams11,39511.44+1.97
United Australia Rhys Collyer2,9152.93+0.97
Fusion John August2,1252.13+2.13
One Nation Victor Waterson1,6641.67+1.67
Liberal Democrats Dougal Cameron1,5391.54+1.54
Democratic Alliance Kyinzom Dhongdue1,2081.21+1.21
Total formal votes99,64894.20−0.64
Informal votes6,1305.80+0.64
Turnout 105,77892.03−1.29
Two-party-preferred result
Labor Jerome Laxale 50,80150.98+7.89
Liberal Simon Kennedy 48,84749.02−7.89
Labor gain from Liberal Swing +7.89

Berowra

2022 Australian federal election: Berowra [4]
PartyCandidateVotes%±%
Liberal Julian Leeser 45,79749.08−8.12
Labor Benson Koschinski20,74622.23+1.13
Greens Tania Salitra14,53615.58+3.70
One Nation Rhiannon Bosma2,9723.19+3.19
United Australia Christopher Martinic2,3152.48+0.80
Liberal Democrats Nicholas Samios2,3072.47+2.47
Independent Benjamin Caswell1,8021.93+1.93
Fusion Brendan Clarke1,4181.52+1.52
Independent Roger Woodward9040.97+0.44
Australian Federation David Louie5090.55+0.55
Total formal votes93,30693.88+0.28
Informal votes6,0836.12−0.28
Turnout 99,38993.61−0.78
Two-party-preferred result
Liberal Julian Leeser 55,77159.77−5.88
Labor Benson Koschinski37,53540.23+5.88
Liberal hold Swing −5.88

Blaxland

2022 Australian federal election: Blaxland [5]
PartyCandidateVotes%±%
Labor Jason Clare 44,90554.98−2.80
Liberal Oz Guney22,05927.01−1.81
Greens Linda Eisler5,1876.35+0.99
United Australia Elvis Sinosic5,1056.25+3.37
One Nation Adam Stepanoff4,4215.41+5.41
Total formal votes81,67789.21+2.51
Informal votes9,88410.79−2.51
Turnout 91,56185.37−3.08
Two-party-preferred result
Labor Jason Clare 53,03964.94+0.22
Liberal Oz Guney28,63835.06−0.22
Labor hold Swing +0.22

Bradfield

2022 Australian federal election: Bradfield [6]
PartyCandidateVotes%±%
Liberal Paul Fletcher 43,56245.05−15.28
Independent Nicolette Boele20,19820.89+20.89
Labor David Brigden16,90217.48−3.70
Greens Martin Cousins8,9609.27−4.44
Independent Janine Kitson3,0183.12+3.12
United Australia Rob Fletcher2,4962.58+0.74
One Nation Michael Lowe1,5681.62+1.62
Total formal votes96,70496.40+0.45
Informal votes3,6163.60−0.45
Turnout 100,32092.43−0.95
Notional two-party-preferred count
Liberal Paul Fletcher 54,68556.55−10.01
Labor David Brigden42,01943.45+10.01
Two-candidate-preferred result
Liberal Paul Fletcher 52,44754.23−12.33
Independent Nicolette Boele44,25745.77+45.77
Liberal hold 

Calare

2022 Australian federal election: Calare [7]
PartyCandidateVotes%±%
National Andrew Gee 51,16147.67+2.96
Independent Kate Hook21,89120.40+20.40
Labor Sarah Elliott16,25215.14−6.99
One Nation Stacey Whittaker9,0578.44+8.44
Greens Kay Nankervis4,8914.56−1.50
United Australia Adam Jannis4,0673.79+0.56
Total formal votes107,31996.01+1.67
Informal votes4,4553.99−1.67
Turnout 111,77492.06−1.54
Notional two-party-preferred count
National Andrew Gee 70,24565.45+2.16
Labor Sarah Elliott37,07434.55−2.16
Two-candidate-preferred result
National Andrew Gee 64,04759.68−3.61
Independent Kate Hook43,27240.32+40.32
National hold 

Chifley

2022 Australian federal election: Chifley [8]
PartyCandidateVotes%±%
Labor Ed Husic 51,23652.72−1.58
Liberal Jugandeep Singh24,04624.74−3.18
One Nation Amit Batish6,0346.21+6.21
Greens Sujan Selventhiran5,6225.78+0.72
United Australia Zvetanka Raskov5,1495.30+0.76
Liberal Democrats Ben Roughley3,2633.36+3.36
Independent Ammar Khan1,8391.89+0.15
Total formal votes97,18991.12+0.78
Informal votes9,4718.88−0.78
Turnout 106,66087.95−2.01
Two-party-preferred result
Labor Ed Husic 61,68263.47+1.10
Liberal Jugandeep Singh35,50736.53−1.10
Labor hold Swing +1.10

Cook

2022 Australian federal election: Cook [9]
PartyCandidateVotes%±%
Liberal Scott Morrison 54,32255.53−8.17
Labor Simon Earle24,44424.99+1.89
Greens Catherine Dyson9,6859.90+3.09
One Nation Gaye Cameron4,9855.10+1.61
United Australia Jacqueline Guinane4,3814.48+3.27
Total formal votes97,81795.60+1.73
Informal votes4,4984.40−1.73
Turnout 102,31592.83−0.82
Two-party-preferred result
Liberal Scott Morrison 61,08062.44−6.58
Labor Simon Earle36,73737.56+6.58
Liberal hold Swing −6.58

Cowper

2022 Australian federal election: Cowper [10]
PartyCandidateVotes%±%
National Pat Conaghan 43,90939.47−7.60
Independent Caz Heise29,20626.26+26.26
Labor Keith McMullen15,56613.99+0.20
One Nation Faye Aspiotis9,0478.13+8.13
Greens Timothy Nott6,5185.86−0.08
Liberal Democrats Simon Chaseling4,3163.88+3.88
United Australia Joshua Fairhall2,6742.40−0.62
Total formal votes111,23695.07+2.85
Informal votes5,7704.93−2.85
Turnout 117,00690.22−1.81
Notional two-party-preferred count
National Pat Conaghan 66,15359.47−2.41
Labor Keith McMullen45,08340.53+2.41
Two-candidate-preferred result
National Pat Conaghan 58,20452.32−4.47
Independent Caz Heise53,03247.68+47.68
National hold 

Cunningham

2022 Australian federal election: Cunningham [11]
PartyCandidateVotes%±%
Labor Alison Byrnes 40,78340.11−6.50
Liberal Marcus Uren25,41825.00−5.97
Greens Dylan Green22,01121.65+6.56
One Nation Thomas Grogan5,2185.13+5.13
United Australia Ben Britton4,9364.85+1.05
Liberal Democrats Michael Glover2,2072.17+2.17
Australian Citizens Alexis Garnaut-Miller1,0981.08+1.08
Total formal votes101,67194.86+0.56
Informal votes5,5145.14−0.56
Turnout 107,18591.48−1.17
Two-party-preferred result
Labor Alison Byrnes 65,78364.70+1.29
Liberal Marcus Uren35,88835.30−1.29
Labor hold Swing +1.29

Dobell

2022 Australian federal election: Dobell [12]
PartyCandidateVotes%±%
Labor Emma McBride 43,59542.86+1.37
Liberal Michael Feneley 34,27633.70−7.03
Greens Cath Connor8,7008.55+1.08
One Nation Martin Stevenson7,5837.45+7.45
United Australia Dean Mackin3,8183.75−1.58
Fusion Geoff Barnes2,2022.16+2.16
Liberal Democrats Eliot Metherell1,5431.52+1.52
Total formal votes101,71795.38+1.35
Informal votes4,9304.62−1.35
Turnout 106,64790.07−1.98
Two-party-preferred result
Labor Emma McBride 57,49156.52+5.02
Liberal Michael Feneley 44,22643.48−5.02
Labor hold Swing +5.02

Eden-Monaro

2022 Australian federal election: Eden-Monaro [13]
PartyCandidateVotes%±%
Labor Kristy McBain 43,21542.57+3.40
Liberal Jerry Nockles33,52033.02−3.99
Greens Vivian Harris9,3769.24+0.46
One Nation Boyd Shannon4,3514.29+4.29
Liberal Democrats Maxwell Holmes2,6252.59+2.59
United Australia Darren Garnon2,5662.53−0.24
Sustainable Australia James Holgate2,2602.23+2.23
Independent Andrew Thaler2,0442.01+2.01
Informed Medical Options Toni McLennan9090.90+0.90
Democrats Greg Butler6510.64+0.64
Total formal votes101,51793.48+0.28
Informal votes7,0836.52−0.28
Turnout 108,60093.35+0.04
Two-party-preferred result
Labor Kristy McBain 59,08358.20+7.35
Liberal Jerry Nockles42,43441.80−7.35
Labor hold Swing +7.35

Farrer

2022 Australian federal election: Farrer [14]
PartyCandidateVotes%±%
Liberal Sussan Ley 52,56652.26+1.55
Labor Darren Cameron19,09718.99+4.35
Greens Eli Davern9,1639.11+4.45
One Nation Richard Francis6,3636.33+6.33
Shooters, Fishers, Farmers Paul Britton5,3395.31+5.31
United Australia Julie Ramos3,2703.25−1.01
Independent Amanda Duncan-Strelec3,1893.17+3.17
Liberal Democrats Ian Roworth1,5951.59+0.48
Total formal votes100,58292.41+1.54
Informal votes8,2567.59−1.54
Turnout 108,83891.28−1.36
Two-party-preferred result
Liberal Sussan Ley 66,73966.35−3.48
Labor Darren Cameron33,84333.65+3.48
Liberal hold Swing −3.48

Fowler

2022 Australian federal election: Fowler [15]
PartyCandidateVotes%±%
Labor Kristina Keneally 30,97336.06−18.48
Independent Dai Le 25,34629.51+29.51
Liberal Courtney Nguyen14,74017.16−12.89
United Australia Lela Panich5,5126.42+2.09
Greens Avery Howard4,1914.88−0.66
One Nation Tony Margos3,0473.55+3.55
Liberal Democrats Peter Runge2,0942.44+2.44
Total formal votes85,90389.48+2.59
Informal votes10,09810.52−2.59
Turnout 96,00188.54−1.50
Notional two-party-preferred count
Labor Kristina Keneally 47,86455.72–8.27
Liberal Courtney Nguyen38,03944.28+8.27
Two-candidate-preferred result
Independent Dai Le 44,34851.63+51.63
Labor Kristina Keneally 41,55548.37−15.62
Independent gain from Labor  

Gilmore

2022 Australian federal election: Gilmore [16]
PartyCandidateVotes%±%
Liberal Andrew Constance 46,94142.02+12.83
Labor Fiona Phillips 40,17535.97−0.22
Greens Carmel McCallum11,41710.22+0.25
Independent Nina Digiglio4,7214.23+4.23
One Nation Jerremy Eid4,4533.99+3.99
United Australia Jordan Maloney3,1082.78−0.60
Liberal Democrats Adrian Fadini8900.80+0.80
Total formal votes111,70595.58+0.83
Informal votes5,1704.42−0.83
Turnout 116,87591.59−1.29
Two-party-preferred result
Labor Fiona Phillips 56,03950.17−2.44
Liberal Andrew Constance 55,66649.83+2.44
Labor hold Swing −2.44

Grayndler

2022 Australian federal election: Grayndler [17]
PartyCandidateVotes%±%
Labor Anthony Albanese 50,72353.63+2.77
Greens Rachael Jacobs20,84622.04−0.51
Liberal Ben Zhang15,11115.98−5.78
United Australia David Smith 2,1012.22+1.01
Independent Sarina Kilham1,9732.09+2.09
One Nation Paul Henselin1,4491.53+1.53
Fusion James Haggerty1,2221.29+1.29
Animal Justice Michael Dello-Iacovo1,1481.21+1.21
Total formal votes94,57395.47−0.28
Informal votes4,4834.53+0.28
Turnout 99,05690.11−1.22
Notional two-party-preferred count
Labor Anthony Albanese 74,57178.85+5.02
Liberal Ben Zhang20,00221.15−5.02
Two-candidate-preferred result
Labor Anthony Albanese 63,41367.05+0.75
Greens Rachael Jacobs31,16032.95−0.75
Labor hold Swing +0.75

Greenway

2022 Australian federal election: Greenway [18]
PartyCandidateVotes%±%
Labor Michelle Rowland 48,55148.29+2.32
Liberal Pradeep Pathi29,93229.77−10.81
Greens Damien Atkins7,0867.05+1.55
United Australia Mark Rex4,3594.34+1.35
  Australia One Riccardo Bosi3,2723.25+3.25
Liberal Democrats Adam Kachwalla3,0143.00+3.00
One Nation Rick Turner2,7102.70+2.70
Independent Love Nanda1,6151.61+1.61
Total formal votes100,53991.78−1.46
Informal votes8,9998.22+1.46
Turnout 109,53891.38−1.49
Two-party-preferred result
Labor Michelle Rowland 61,86461.53+8.73
Liberal Pradeep Pathi38,67538.47−8.73
Labor hold Swing +8.73

Hughes

2022 Australian federal election: Hughes [19]
PartyCandidateVotes%±%
Liberal Jenny Ware 42,14843.49−9.67
Labor Riley Campbell21,82822.52−7.94
Independent Georgia Steele13,89114.33+14.33
United Australia Craig Kelly 7,1867.42+4.94
Greens Pete Thompson6,1186.31−0.63
Independent Linda Seymour3,1383.24+3.24
One Nation Narelle Seymour2,6002.68+2.68
Total formal votes96,90995.67+0.84
Informal votes4,3874.33−0.84
Turnout 101,29694.42−0.40
Two-party-preferred result
Liberal Jenny Ware 55,24457.01−2.84
Labor Riley Campbell41,66542.99+2.84
Liberal hold Swing −2.84

The sitting member, Craig Kelly was elected as a Liberal, but resigned from the party in 2021, subsequently joining United Australia.

Hume

2022 Australian federal election: Hume [20]
PartyCandidateVotes%±%
Liberal Angus Taylor 45,17743.12−10.17
Labor Greg Baines20,86419.92−6.65
Independent Penny Ackery16,04515.32+15.32
One Nation Rebecca Thompson7,7007.35+7.35
Greens Karen Stewart5,1944.96−0.14
United Australia Garry Dollin4,7804.56−0.26
Shooters, Fishers, Farmers Ross Seller3,1082.97+2.97
Independent Sheneli Dona1,1241.07+1.07
Liberal Democrats Joaquim de Lima7700.73+0.73
Total formal votes104,76292.87−0.67
Informal votes8,0407.13+0.67
Turnout 112,80292.68−1.41
Two-party-preferred result
Liberal Angus Taylor 60,46757.72−5.27
Labor Greg Baines44,29542.28+5.27
Liberal hold Swing −5.27

Hunter

2022 Australian federal election: Hunter [21]
PartyCandidateVotes%±%
Labor Dan Repacholi 41,51438.54+0.97
National James Thomson29,54027.42+3.95
One Nation Dale McNamara10,7599.99−11.60
Greens Janet Murray9,5628.88+2.01
Independent Stuart Bonds6,1265.69+5.69
United Australia Geoff Passfield4,3704.06−0.26
Animal Justice Victoria Davies2,4692.29−0.91
Independent Scott Laruffa1,9291.79+1.79
Informed Medical Options Cathy Townsend1,4581.35+1.35
Total formal votes107,72792.37+1.34
Informal votes8,9017.63−1.34
Turnout 116,62890.85−1.44
Two-party-preferred result
Labor Dan Repacholi 58,20054.03+1.05
National James Thomson49,52745.97−1.05
Labor hold Swing +1.05

Kingsford Smith

2022 Australian federal election: Kingsford Smith [22]
PartyCandidateVotes%±%
Labor Matt Thistlethwaite 46,69747.91+2.74
Liberal Grace Tan27,92928.66−7.77
Greens Stuart Davis16,40116.83+4.73
United Australia Anthony Tawaf3,3883.48+1.73
One Nation Darrin Marr3,0513.13+3.13
Total formal votes97,46695.52+1.31
Informal votes4,5724.48−1.31
Turnout 102,03888.50−1.67
Two-party-preferred result
Labor Matt Thistlethwaite 62,86864.50+5.69
Liberal Grace Tan34,59835.50−5.69
Labor hold Swing +5.69

Lindsay

2022 Australian federal election: Lindsay [23]
PartyCandidateVotes%±%
Liberal Melissa McIntosh 48,93946.73+0.28
Labor Trevor Ross33,20631.71−3.90
Greens Pieter Morssink8,4048.02+3.11
One Nation Max Jago6,2035.92+5.92
United Australia Joseph O'Connor4,2724.08+1.17
Informed Medical Options Rebekah Ray2,0751.98+1.98
Liberal Democrats Gareth McClure1,6271.55+1.55
Total formal votes104,72693.11+4.19
Informal votes7,7546.89−4.19
Turnout 112,48090.23−2.02
Two-party-preferred result
Liberal Melissa McIntosh 59,00356.34+1.30
Labor Trevor Ross45,72343.66−1.30
Liberal hold Swing +1.30

Lyne

2022 Australian federal election: Lyne [24]
PartyCandidateVotes%±%
National David Gillespie 46,66143.51−5.84
Labor Alex Simpson23,02421.47−2.62
One Nation Josephine Cashman 8,5027.93+7.93
Greens Karl Attenborough8,4227.85+1.34
Liberal Democrats Mark Hornshaw6,8246.36+0.56
Independent Steve Attkins5,5745.20+5.20
United Australia Joel Putland4,4214.12+0.07
Independent Joanne Pearce3,8203.56+3.56
Total formal votes107,24893.41+2.48
Informal votes7,5636.59−2.48
Turnout 114,81192.22−1.51
Two-party-preferred result
National David Gillespie 68,42163.80−1.37
Labor Alex Simpson38,82736.20+1.37
National hold Swing −1.37

Macarthur

2022 Australian federal election: Macarthur [25]
PartyCandidateVotes%±%
Labor Mike Freelander 51,00145.89−1.89
Liberal Binod Paudel33,86730.48−0.37
One Nation Adam Zahra8,8767.99−0.61
Greens Jayden Rivera8,5847.72+3.30
United Australia Rosa Sicari6,6025.94+3.42
Liberal Democrats Scott Korman2,1971.98+1.98
Total formal votes111,12792.78+1.63
Informal votes8,6467.22−1.63
Turnout 119,77389.78−1.88
Two-party-preferred result
Labor Mike Freelander 65,03958.53+0.13
Liberal Binod Paudel46,08841.47−0.13
Labor hold Swing +0.13

Mackellar

2022 Australian federal election: Mackellar [26]
PartyCandidateVotes%±%
Liberal Jason Falinski 40,99341.41−11.60
Independent Sophie Scamps 37,72438.11+38.11
Labor Paula Goodman8,1628.25−8.69
Greens Ethan Hrnjak6,0326.09−5.39
United Australia Christopher Ball2,8812.91+0.55
One Nation Darren Dickson2,6242.65+2.65
TNL Barry Steele5750.58+0.58
Total formal votes98,99196.22+0.93
Informal votes3,8843.78−0.93
Turnout 102,87592.54−0.51
Notional two-party-preferred count
Liberal Jason Falinski 58,01258.60−4.62
Labor Paula Goodman40,97941.40+4.62
Two-candidate-preferred result
Independent Sophie Scamps 51,97352.50+52.50
Liberal Jason Falinski 47,01847.50−15.73
Independent gain from Liberal  

Macquarie

2022 Australian federal election: Macquarie [27]
PartyCandidateVotes%±%
Labor Susan Templeman 41,02542.98+4.71
Liberal Sarah Richards32,98034.55−10.30
Greens Tony Hickey9,1159.55+0.40
One Nation Tony Pettitt4,9555.19+5.19
United Australia Nicole Evans2,7742.91−1.09
Animal Justice Greg Keightley2,0132.11−1.61
Informed Medical Options Michelle Palmer1,3181.38+1.38
Liberal Democrats James Jackson1,2721.33+1.33
Total formal votes95,45294.93−0.79
Informal votes5,0955.07+0.79
Turnout 100,54793.05−0.77
Two-party-preferred result
Labor Susan Templeman 55,14357.77+7.58
Liberal Sarah Richards40,30942.23−7.58
Labor hold Swing +7.58

McMahon

2022 Australian federal election: McMahon [28]
PartyCandidateVotes%±%
Labor Chris Bowen 40,65747.98+1.90
Liberal Vivek Singha24,00628.33−4.98
United Australia Marie Saliba7,7239.11+5.21
Greens Astrid O'Neill4,9225.81+0.87
One Nation Scott Ford4,6125.44−2.81
Liberal Democrats Cameron Shamsabad2,8223.33+3.33
Total formal votes84,74289.39+1.47
Informal votes10,05710.61−1.47
Turnout 94,79988.42−2.56
Two-party-preferred result
Labor Chris Bowen 50,41359.49+2.85
Liberal Vivek Singha34,32940.51−2.85
Labor hold Swing +2.85

Mitchell

2022 Australian federal election: Mitchell [29]
PartyCandidateVotes%±%
Liberal Alex Hawke 56,91852.61−9.44
Labor Immanuel Selvaraj27,59725.51+1.57
Greens Matt Cox12,79611.83+3.76
United Australia Linda Daniel3,9163.62+0.88
Liberal Democrats Clinton Mead3,7083.43+3.43
One Nation Donald McKenzie3,2583.01+3.01
Total formal votes108,19395.74+0.78
Informal votes4,8114.26−0.78
Turnout 113,00493.11−1.02
Two-party-preferred result
Liberal Alex Hawke 65,66260.69−7.94
Labor Immanuel Selvaraj42,53139.31+7.94
Liberal hold Swing −7.94

New England

2022 Australian federal election: New England [30]
PartyCandidateVotes%±%
National Barnaby Joyce 51,03652.47−2.35
Labor Laura Hughes18,05618.56+5.81
Independent Matt Sharpham7,6597.87+7.87
Greens Carol Sparks7,5247.74+3.31
One Nation Richard Thomas4,5704.70+4.70
Liberal Democrats Pavlo Samios3,1743.26+3.26
Independent Natasha Ledger2,7082.78−0.38
United Australia Cindy Duncan2,5452.62−1.96
Total formal votes97,27293.74+0.56
Informal votes6,4946.26−0.56
Turnout 103,76691.58−1.76
Two-party-preferred result
National Barnaby Joyce 64,62266.43−1.20
Labor Laura Hughes32,65033.57+1.20
National hold Swing −1.20

Newcastle

2022 Australian federal election: Newcastle [31]
PartyCandidateVotes%±%
Labor Sharon Claydon 46,55144.07−1.66
Liberal Katrina Wark25,81624.44−4.77
Greens Charlotte McCabe21,19520.07+4.51
One Nation Mark Watson4,7574.50+4.50
Animal Justice Emily Brollo2,5492.41−0.79
United Australia Amanda Cook2,5172.38−0.99
Informed Medical Options William Hussey1,1401.08+1.08
Australian Federation Garth Pywell1,1021.04+1.04
Total formal votes105,62794.59+0.10
Informal votes6,0385.41−0.10
Turnout 111,66591.19−1.53
Two-party-preferred result
Labor Sharon Claydon 71,80767.98+4.15
Liberal Katrina Wark33,82032.02−4.15
Labor hold Swing +4.15

North Sydney

2022 Australian federal election: North Sydney [32]
PartyCandidateVotes%±%
Liberal Trent Zimmerman 36,95638.05−13.91
Independent Kylea Tink 24,47725.20+25.20
Labor Catherine Renshaw20,83521.45−3.63
Greens Heather Armstrong8,3088.55−5.07
United Australia Robert Nalbandian1,7301.78+0.49
Sustainable Australia William Bourke1,1631.20−0.69
One Nation Michael Walls1,1491.18+1.18
Liberal Democrats Dajen Tinkler1,1231.16+1.16
TNL Victor Kline8860.91+0.91
Informed Medical Options Lesley Kinney4910.51+0.51
Total formal votes97,11894.98−0.98
Informal votes5,1385.02+0.98
Turnout 102,25691.55−0.85
Notional two-party-preferred count
Liberal Trent Zimmerman 49,78151.26−8.01
Labor Catherine Renshaw47,33748.74+8.01
Two-candidate-preferred result
Independent Kylea Tink 51,39252.92+52.92
Liberal Trent Zimmerman 45,72647.08−12.19
Independent gain from Liberal  

Page

2022 Australian federal election: Page [33]
PartyCandidateVotes%±%
National Kevin Hogan 47,70145.62−4.01
Labor Patrick Deegan19,53118.68−7.68
Independent Hanabeth Luke13,73413.13+13.13
Greens Kashmir Miller8,8638.48−3.20
One Nation Donna Pike5,6215.38+5.38
Liberal Democrats Thomas Searles3,8963.73+3.73
United Australia Ian Williamson2,4312.32−0.88
Indigenous-Aboriginal Brett Duroux1,7331.66+1.66
Australian Federation Heather Smith8160.78+0.78
TNL Serge Killingbeck2430.23+0.23
Total formal votes104,56993.03−2.22
Informal votes7,8396.97+2.22
Turnout 112,40891.47−1.06
Two-party-preferred result
National Kevin Hogan 63,51260.74+1.29
Labor Patrick Deegan41,05739.26−1.29
National hold Swing +1.29

Parkes

2022 Australian federal election: Parkes [34]
PartyCandidateVotes%±%
National Mark Coulton 43,93149.32−1.44
Labor Jack Ayoub18,00920.22−3.34
One Nation Deborah Swinbourn6,6627.48+7.48
Liberal Democrats Peter Rothwell5,7236.42−1.64
Indigenous-Aboriginal Derek Hardman4,4665.01+5.01
Greens Trish Frail4,2144.73+0.56
United Australia Petrus Van Der Steen2,3722.66−3.63
Independent Stuart Howe2,1912.46+2.46
Informed Medical Options Benjamin Fox1,5121.70+1.70
Total formal votes89,08092.31−1.83
Informal votes7,4217.69+1.83
Turnout 96,50188.53−2.60
Two-party-preferred result
National Mark Coulton 60,43367.84+0.93
Labor Jack Ayoub28,64732.16−0.93
National hold Swing +0.93

Parramatta

2022 Australian federal election: Parramatta [35]
PartyCandidateVotes%±%
Labor Andrew Charlton 34,25840.66−4.42
Liberal Maria Kovacic 29,49235.00−6.28
Greens Phil Bradley7,5468.96+1.72
United Australia Julian Fayad4,2695.07+2.49
  Independent OLC Steve Christou2,9823.54+3.54
Animal Justice Rohan Laxmanalal2,3972.84+2.84
One Nation Heather Freeman2,0112.39+2.39
Liberal Democrats Liza Tazewell1,3101.55+1.55
Total formal votes84,26591.07−0.56
Informal votes8,2598.93+0.56
Turnout 92,52487.73−1.88
Two-party-preferred result
Labor Andrew Charlton 45,98054.57+1.07
Liberal Maria Kovacic 38,28545.43−1.07
Labor hold Swing +1.07

Paterson

2022 Australian federal election: Paterson [36]
PartyCandidateVotes%±%
Labor Meryl Swanson 46,72540.67−0.41
Liberal Brooke Vitnell42,14236.68+4.16
One Nation Neil Turner9,3638.15−6.01
Greens Louise Ihlein8,6777.55+0.65
United Australia Jason Olbourne4,4743.89+0.28
Informed Medical Options Angela Ketas1,8831.64+1.64
Liberal Democrats Sonia Bailey1,6211.41+1.41
Total formal votes114,88594.93+0.78
Informal votes6,1425.07−0.78
Turnout 121,02791.66−1.58
Two-party-preferred result
Labor Meryl Swanson 61,24753.31−1.73
Liberal Brooke Vitnell53,63846.69+1.73
Labor hold Swing −1.73

Reid

2022 Australian federal election: Reid [37]
PartyCandidateVotes%±%
Labor Sally Sitou 40,76841.61+4.40
Liberal Fiona Martin 37,12637.89−10.43
Greens Charles Jago9,1849.37+1.29
Independent Natalie Baini2,9943.06+3.06
United Australia Jamal Daoud2,5302.58+0.66
One Nation Edward Walters1,9972.04+2.04
Liberal Democrats Andrew Cameron1,8241.86+1.86
Fusion Sahar Khalili-Naghadeh1,5531.59+1.59
Total formal votes97,97693.51−0.36
Informal votes6,8006.49+0.36
Turnout 104,77690.68−1.03
Two-party-preferred result
Labor Sally Sitou 54,07655.19+8.37
Liberal Fiona Martin 43,90044.81−8.37
Labor gain from Liberal Swing +8.37

Richmond

2022 Australian federal election: Richmond [38]
PartyCandidateVotes%±%
Labor Justine Elliot 28,73328.80−2.91
Greens Mandy Nolan 25,21625.27+4.95
National Kimberly Hone23,29923.35−13.51
Liberal Democrats Gary Biggs7,6817.70+7.70
One Nation Tracey Bell-Henselin4,0734.08+4.08
United Australia Robert Marks2,9222.93−0.97
Independent David Warth2,3412.35+2.35
Informed Medical Options Monica Shepherd2,2712.28+1.10
Independent Nathan Jones1,9741.98+1.98
Independent Terry Sharples1,2741.28+1.28
Total formal votes99,78493.08+0.52
Informal votes7,4246.92−0.52
Turnout 107,20890.37−0.45
Two-party-preferred result
Labor Justine Elliot 58,10458.23+4.15
National Kimberly Hone41,68041.77−4.15
Labor hold Swing +4.15

Riverina

2022 Australian federal election: Riverina [39]
PartyCandidateVotes%±%
National Michael McCormack 45,95146.57−13.36
Labor Mark Jeffreson20,19320.47−2.69
One Nation Richard Orchard8,0428.15+8.15
Liberal Democrats Dean McCrae6,5636.65+6.65
Greens Michael Organ 6,3496.43+0.23
Shooters, Fishers, Farmers Steve Karaitiana6,2806.37+6.37
Independent Darren Ciavarella2,7012.74+2.74
United Australia Daniel Martelozzo2,5852.62−8.09
Total formal votes98,66492.68−2.16
Informal votes7,7947.32+2.16
Turnout 106,45891.75−1.64
Two-party-preferred result
National Michael McCormack 63,97964.85−4.63
Labor Mark Jeffreson34,68535.15+4.63
National hold Swing −4.63

Robertson

2022 Australian federal election: Robertson [40]
PartyCandidateVotes%±%
Liberal Lucy Wicks 38,44839.96−6.90
Labor Gordon Reid 36,23137.66+3.56
Greens Shelly McGrath9,64210.02+2.11
One Nation Billy O'Grady3,6793.82+3.82
United Australia Barbara-Jane Murray2,7922.90+0.09
Animal Justice Patrick Murphy1,9492.03−0.05
Indigenous-Aboriginal Jeffrey Lawson1,1271.17+1.17
Informed Medical Options Kate Mason1,1141.16+1.16
Liberal Democrats Bentley Logan7360.76+0.76
Australian Citizens Paul Borthwick2720.28+0.28
Australian Federation Alexandra Hafner2200.23+0.23
Total formal votes96,21093.88+1.12
Informal votes6,2746.12−1.12
Turnout 102,48491.07−2.10
Two-party-preferred result
Labor Gordon Reid 50,27752.26+6.50
Liberal Lucy Wicks 45,93347.74−6.50
Labor gain from Liberal Swing +6.50

Shortland

2022 Australian federal election: Shortland [41]
PartyCandidateVotes%±%
Labor Pat Conroy 40,13540.02−1.11
Liberal Nell McGill32,21532.12−5.25
Greens Kim Grierson9,9109.88+1.62
One Nation Quintin King6,3976.38+6.38
United Australia Kenneth Maxwell3,1253.12−1.41
Liberal Democrats Barry Reed2,9842.98+2.98
Animal Justice Bree Roberts2,9792.97−0.63
Independent Basil Paynter2,5542.55+2.55
Total formal votes100,29993.94+0.35
Informal votes6,4676.06−0.35
Turnout 106,76691.85−1.81
Two-party-preferred result
Labor Pat Conroy 55,98555.82+1.37
Liberal Nell McGill44,31444.18−1.37
Labor hold Swing +1.37

Sydney

2022 Australian federal election: Sydney [42]
PartyCandidateVotes%±%
Labor Tanya Plibersek 52,41050.82+1.41
Greens Chetan Sahai23,73223.01+4.94
Liberal Alexander Andruska20,27619.66−6.95
United Australia Ryan McAlister2,2982.23+0.79
One Nation Ben Ferguson1,8891.83+1.83
Socialist Alliance Andrew Chuter1,5181.47+1.47
Australian Citizens Wen Zhou1,0020.97+0.97
Total formal votes103,12596.72+0.53
Informal votes3,4993.28−0.53
Turnout 106,62485.01−1.29
Notional two-party-preferred count
Labor Tanya Plibersek 77,93375.57+6.90
Liberal Alexander Andruska25,19224.43−6.90
Two-candidate-preferred result
Labor Tanya Plibersek 68,77066.69−1.98
Greens Chetan Sahai34,35533.31+33.31
Labor hold 

Warringah

2022 Australian federal election: Warringah [43]
PartyCandidateVotes%±%
Independent Zali Steggall 41,83244.82+1.36
Liberal Katherine Deves 31,12933.35−5.66
Labor David Mickleburgh7,8068.36+1.75
Greens Kristyn Glanville6,9107.40+1.27
United Australia Andrew Robertson2,2022.36+1.68
One Nation Steven Tripp1,9802.12+2.12
Animal Justice Kate Paterson1,4751.58+0.18
Total formal votes93,33497.06+2.11
Informal votes2,8292.94−2.11
Turnout 96,16391.34−1.06
Notional two-party-preferred count
Liberal Katherine Deves 48,00151.43−0.69
Labor David Mickleburgh45,33348.57+0.69
Two-candidate-preferred result
Independent Zali Steggall 56,89260.96+3.72
Liberal Katherine Deves 36,44239.04−3.72
Independent hold Swing +3.72

Watson

2022 Australian federal election: Watson [44]
PartyCandidateVotes%±%
Labor Tony Burke 44,46451.87+0.18
Liberal Sazeda Akter22,75926.55−2.85
Greens Bradley Schott8,2009.57+2.47
United Australia John Koukoulis6,1267.15+2.94
One Nation Alan Jorgensen4,1784.87+4.87
Total formal votes85,72790.27+2.88
Informal votes9,2459.73−2.88
Turnout 94,97287.36−2.09
Two-party-preferred result
Labor Tony Burke 55,81065.10+1.58
Liberal Sazeda Akter29,91734.90−1.58
Labor hold Swing +1.58

Wentworth

2022 Australian federal election: Wentworth [45]
PartyCandidateVotes%±%
Liberal Dave Sharma 35,99540.48−6.96
Independent Allegra Spender 31,81035.77+35.77
Labor Tim Murray9,65410.86−0.09
Greens Dominic Wy Kanak7,4108.33+0.80
United Australia Natalie Dumer1,8132.04+1.34
Liberal Democrats Daniel Lewkovitz1,3461.51+1.51
One Nation Dean Fisher8951.01+1.01
Total formal votes88,92397.50+0.49
Informal votes2,2772.50−0.49
Turnout 91,20087.93−1.47
Notional two-party-preferred count
Liberal Dave Sharma 49,72755.92−3.93
Labor Tim Murray39,19644.08+3.93
Two-candidate-preferred result
Independent Allegra Spender 48,18654.19+54.19
Liberal Dave Sharma 40,73745.81−5.50
Independent gain from Liberal  

Werriwa

2022 Australian federal election: Werriwa [46]
PartyCandidateVotes%±%
Labor Anne Stanley 40,10839.86−7.90
Liberal Sam Kayal30,86430.67−4.60
Liberal Democrats Victor Tey8,9788.92+8.92
United Australia Tony Nikolic8,8138.76+4.56
Greens Apurva Shukla6,7726.73+1.36
One Nation Adam Booke5,0965.06+5.06
Total formal votes100,63190.18+1.75
Informal votes10,9629.82−1.75
Turnout 111,59388.53−2.00
Two-party-preferred result
Labor Anne Stanley 56,17355.82+0.35
Liberal Sam Kayal44,45844.18−0.35
Labor hold Swing +0.35

Whitlam

2022 Australian federal election: Whitlam [47]
PartyCandidateVotes%±%
Labor Stephen Jones 49,21845.01−3.79
Liberal Mike Cains30,84928.21+2.75
Greens Jamie Dixon11,77910.77+1.56
One Nation Colin Hughes7,5436.90+6.90
United Australia Allan Wode5,8865.38−3.46
Liberal Democrats Michael Wheeler4,0623.72+3.72
Total formal votes109,33795.10+2.35
Informal votes5,6374.90−2.35
Turnout 114,97491.69−1.57
Two-party-preferred result
Labor Stephen Jones 65,68360.07−0.84
Liberal Mike Cains43,65439.93+0.84
Labor hold Swing −0.84

Related Research Articles

<span class="mw-page-title-main">Division of North Sydney</span> Australian federal electoral division

The Division of North Sydney is an Australian electoral division in the state of New South Wales.

<span class="mw-page-title-main">Division of Bennelong</span> Australian federal electoral division

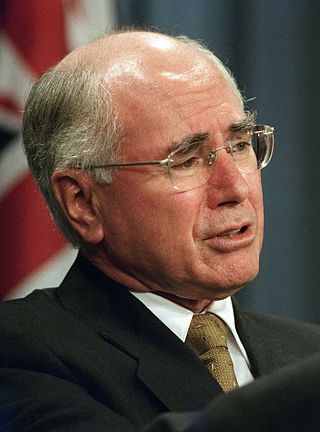
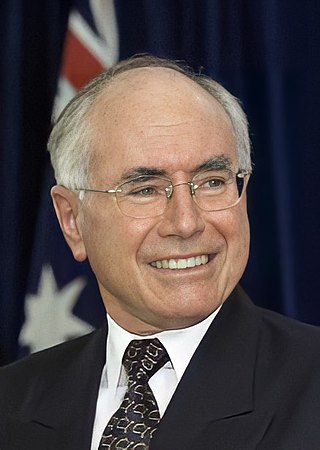
The Division of Bennelong is an Australian electoral division in the state of New South Wales. The division was created in 1949 and is named after Woollarawarre Bennelong, an Aboriginal man befriended by the first Governor of New South Wales, Arthur Phillip. The seat is represented by Jerome Laxale since the 2022 Australian federal election.

<span class="mw-page-title-main">Division of Fowler</span> Australian federal electoral division

The Division of Fowler is an Australian electoral division in the state of New South Wales.

<span class="mw-page-title-main">Division of Mackellar</span> Australian federal electoral division

The Division of Mackellar is an Australian electoral division in the state of New South Wales.

<span class="mw-page-title-main">1990 Australian federal election</span> Election

The 1990 Australian federal election was held in Australia on 24 March 1990. All 148 seats in the House of Representatives and 40 seats in the 76-member Senate were up for election. The incumbent Australian Labor Party, led by Bob Hawke, defeated the opposition Liberal Party of Australia, led by Andrew Peacock, with its coalition partner, the National Party of Australia, led by Charles Blunt, despite losing the nationwide popular and two-party-preferred vote. The result saw the re-election of the Hawke government for a fourth successive term.

<span class="mw-page-title-main">Electoral district of Pittwater</span>

Pittwater is an electoral district of the Legislative Assembly in the Australian state of New South Wales. Located in Sydney's north-east, it is 175.32 km2 in size, and comprises a part of the local government area of Northern Beaches Council, mostly the portion that was formerly Pittwater Council.

<span class="mw-page-title-main">Maxine McKew</span> Australian politician

Maxine Margaret McKew is a former Australian Labor politician and journalist; she was the Parliamentary Secretary for Infrastructure, Transport, Regional Development and Local Government in the First Rudd Ministry and the First Gillard Ministry.

<span class="mw-page-title-main">Electoral district of Ku-ring-gai</span> Former New South Wales electoral district

Ku-ring-gai was an electoral district of the Legislative Assembly in the Australian state of New South Wales. The electorate covers the suburbs and parts of the suburbs of Gordon, Hornsby, Killara, Lindfield, Normanhurst, North Turramurra, North Wahroonga, Pymble, South Turramurra, Thornleigh, Turramurra, Wahroonga, Waitara, Warrawee and West Pymble.

<span class="mw-page-title-main">Two-party-preferred vote</span> Result of election after distribution of preferences

In Australian politics, the two-party-preferred vote is the result of an election or opinion poll after preferences have been distributed to the highest two candidates, who in some cases can be independents. For the purposes of TPP, the Liberal/National Coalition is usually considered a single party, with Labor being the other major party. Typically the TPP is expressed as the percentages of votes attracted by each of the two major parties, e.g. "Coalition 50%, Labor 50%", where the values include both primary votes and preferences. The TPP is an indicator of how much swing has been attained/is required to change the result, taking into consideration preferences, which may have a significant effect on the result.

<span class="mw-page-title-main">How-to-vote card</span> Handed-out leaflets in Australian elections with voting instructions

In Australia, how-to-vote cards (HTV) are small leaflets that are handed out by party supporters during elections. Voting in the Australian lower house uses a preferential voting system. Voters must rank every candidate on the ballot in order for their vote to count. There are often numerous candidates on the ballot, some with little public profile, so voters may find it difficult to decide on all of them. Parties produce how-to-vote cards ostensibly to help voters. They contain details about the candidate or party as well as instruction how to cast a ranked vote in the order that the party would prefer the voter follow. The flow of preferences can assist the party dispersing the cards directly and indirectly help allied parties.

<span class="mw-page-title-main">Results of the 2010 Australian federal election in New South Wales</span>

This is a list of electoral division results for the Australian 2010 federal election in the state of New South Wales.

<span class="mw-page-title-main">Results of the 2013 Australian federal election in New South Wales</span>

This is a list of electoral division results for the Australian 2013 federal election in the state of New South Wales.

<span class="mw-page-title-main">Arts Party</span> Political party in Australia

The Arts Party is an Australian political party inspired by the importance of the arts and creative action. The party was voluntarily deregistered with the Australian Electoral Commission on 25 June 2019, but remains registered for local elections with the New South Wales Electoral Commission.

<span class="mw-page-title-main">Results of the 2016 Australian federal election in New South Wales</span>

This is a list of electoral division results for the 2016 Australian federal election in the state of New South Wales.

<span class="mw-page-title-main">2017 Bennelong by-election</span> Australian federal by-election

A by-election for the Australian House of Representatives seat of Bennelong was held on 16 December 2017.

<span class="mw-page-title-main">Results of the 2019 Australian federal election in New South Wales</span>

This is a list of electoral division results for the 2019 Australian federal election in the state of New South Wales.

The number of seats won by each party in the Australian House of Representatives at the 2022 federal election were: Coalition 58, Labor 77, Australian Greens 4, Centre Alliance 1, Katter's Australian Party 1, and Independents 10.

<span class="mw-page-title-main">Results of the 2007 Australian federal election in New South Wales</span>

This is a list of electoral division results in the Australian 2007 federal election for the state of New South Wales.

<span class="mw-page-title-main">Results of the 2004 Australian federal election in New South Wales</span>

This is a list of electoral division results in the Australian 2004 federal election for the state of New South Wales.

<span class="mw-page-title-main">Results of the 2001 Australian federal election in New South Wales</span>

This is a list of electoral division results for the Australian 2001 federal election in the state of New South Wales.

References

  1. Banks, NSW, 2022 Tally Room, Australian Electoral Commission.
  2. Barton, NSW, 2022 Tally Room, Australian Electoral Commission.
  3. Bennelong, NSW, 2022 Tally Room, Australian Electoral Commission.
  4. Berowra, NSW, 2022 Tally Room, Australian Electoral Commission.
  5. Blaxland, NSW, 2022 Tally Room, Australian Electoral Commission.
  6. Bradfield, NSW, 2022 Tally Room, Australian Electoral Commission.
  7. Calare, NSW, 2022 Tally Room, Australian Electoral Commission.
  8. Chifley, NSW, 2022 Tally Room, Australian Electoral Commission.
  9. Cook, NSW, 2022 Tally Room, Australian Electoral Commission.
  10. Cowper, NSW, 2022 Tally Room, Australian Electoral Commission.
  11. Cunningham, NSW, 2022 Tally Room, Australian Electoral Commission.
  12. Dobell, NSW, 2022 Tally Room, Australian Electoral Commission.
  13. Eden-Monaro, NSW, 2022 Tally Room, Australian Electoral Commission.
  14. Farrer, NSW, 2022 Tally Room, Australian Electoral Commission.
  15. Fowler, NSW, 2022 Tally Room, Australian Electoral Commission.
  16. Gilmore, NSW, 2022 Tally Room, Australian Electoral Commission.
  17. Grayndler, NSW, 2022 Tally Room, Australian Electoral Commission.
  18. Greenway, NSW, 2022 Tally Room, Australian Electoral Commission.
  19. Hughes, NSW, 2022 Tally Room, Australian Electoral Commission.
  20. Hume, NSW, 2022 Tally Room, Australian Electoral Commission.
  21. Hunter, NSW, 2022 Tally Room, Australian Electoral Commission.
  22. Kingsford Smith, NSW, 2022 Tally Room, Australian Electoral Commission.
  23. Lindsay, NSW, 2022 Tally Room, Australian Electoral Commission.
  24. Lyne, NSW, 2022 Tally Room, Australian Electoral Commission.
  25. Macarthur, NSW, 2022 Tally Room, Australian Electoral Commission.
  26. Mackellar, NSW, 2022 Tally Room, Australian Electoral Commission.
  27. Macquarie, NSW, 2022 Tally Room, Australian Electoral Commission.
  28. McMahon, NSW, 2022 Tally Room, Australian Electoral Commission.
  29. Mitchell, NSW, 2022 Tally Room, Australian Electoral Commission.
  30. New England, NSW, 2022 Tally Room, Australian Electoral Commission.
  31. Newcastle, NSW, 2022 Tally Room, Australian Electoral Commission.
  32. North Sydney, NSW, 2022 Tally Room, Australian Electoral Commission.
  33. Page, NSW, 2022 Tally Room, Australian Electoral Commission.
  34. Parkes, NSW, 2022 Tally Room, Australian Electoral Commission.
  35. Parramatta, NSW, 2022 Tally Room, Australian Electoral Commission.
  36. Paterson, NSW, 2022 Tally Room, Australian Electoral Commission.
  37. Reid, NSW, 2022 Tally Room, Australian Electoral Commission.
  38. Richmond, NSW, 2022 Tally Room, Australian Electoral Commission.
  39. Riverina, NSW, 2022 Tally Room, Australian Electoral Commission.
  40. Robertson, NSW, 2022 Tally Room, Australian Electoral Commission.
  41. Shortland, NSW, 2022 Tally Room, Australian Electoral Commission.
  42. Sydney, NSW, 2022 Tally Room, Australian Electoral Commission.
  43. Warringah, NSW, 2022 Tally Room, Australian Electoral Commission.
  44. Watson, NSW, 2022 Tally Room, Australian Electoral Commission.
  45. Wentworth, NSW, 2022 Tally Room, Australian Electoral Commission.
  46. Werriwa, NSW, 2022 Tally Room, Australian Electoral Commission.
  47. Whitlam, NSW, 2022 Tally Room, Australian Electoral Commission.