
A mind map is a diagram used to visually organize information into a hierarchy, showing relationships among pieces of the whole. It is often based on a single concept, drawn as an image in the center of a blank page, to which associated representations of ideas such as images, words and parts of words are added. Major ideas are connected directly to the central concept, and other ideas branch out from those major ideas.
Collaborative writing is a procedure in which two or more persons work together on a text of some kind. Success collaborative writing involves a division of labor that apportions particular tasks to those with particular strengths: drafting, providing feedback, editing, sourcing, (reorganizing), optimizing for tone or house style, etc. Collaborative writing is characteristic of professional as well as educational settings, utilizing the expertise of those involved in the collaboration process.
A graphic organizer, also known as a knowledge map, concept map, story map, cognitive organizer, advance organizer, or concept diagram, is a pedagogical tool that uses visual symbols to express knowledge and concepts through relationships between them. The main purpose of a graphic organizer is to provide a visual aid to facilitate learning and instruction.
Instructional scaffolding is the support given to a student by an instructor throughout the learning process. This support is specifically tailored to each student; this instructional approach allows students to experience student-centered learning, which tends to facilitate more efficient learning than teacher-centered learning. This learning process promotes a deeper level of learning than many other common teaching strategies.

Social network analysis (SNA) is the process of investigating social structures through the use of networks and graph theory. It characterizes networked structures in terms of nodes and the ties, edges, or links that connect them. Examples of social structures commonly visualized through social network analysis include social media networks, meme proliferation, information circulation, friendship and acquaintance networks, business networks, knowledge networks, difficult working relationships, collaboration graphs, kinship, disease transmission, and sexual relationships. These networks are often visualized through sociograms in which nodes are represented as points and ties are represented as lines. These visualizations provide a means of qualitatively assessing networks by varying the visual representation of their nodes and edges to reflect attributes of interest.
A concept map or conceptual diagram is a diagram that depicts suggested relationships between concepts. Concept maps may be used by instructional designers, engineers, technical writers, and others to organize and structure knowledge.
In planning and policy, a wicked problem is a problem that is difficult or impossible to solve because of incomplete, contradictory, and changing requirements that are often difficult to recognize. It refers to an idea or problem that cannot be fixed, where there is no single solution to the problem; and "wicked" denotes resistance to resolution, rather than evil. Another definition is "a problem whose social complexity means that it has no determinable stopping point". Moreover, because of complex interdependencies, the effort to solve one aspect of a wicked problem may reveal or create other problems. Due to their complexity, wicked problems are often characterized by organized irresponsibility.
Collaborative editing is the process of multiple people editing the same document simultaneously. This technique may engage expertise from different disciplines, and potentially improve the quality of documents and increase deals.

Computer-aided architectural design (CAAD) software programs are the repository of accurate and comprehensive records of buildings and are used by architects and architectural companies for architectural design and architectural engineering. As the latter often involve floor plan designs CAAD software greatly simplifies this task.
Visual journalism is the practice of strategically combining words and images to convey information.
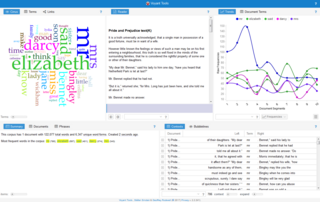
Digital humanities (DH) is an area of scholarly activity at the intersection of computing or digital technologies and the disciplines of the humanities. It includes the systematic use of digital resources in the humanities, as well as the analysis of their application. DH can be defined as new ways of doing scholarship that involve collaborative, transdisciplinary, and computationally engaged research, teaching, and publishing. It brings digital tools and methods to the study of the humanities with the recognition that the printed word is no longer the main medium for knowledge production and distribution.
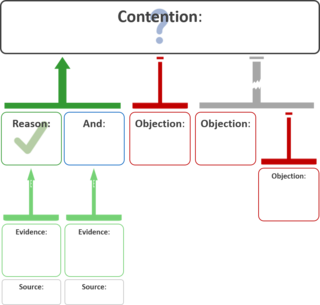
An argument map or argument diagram is a visual representation of the structure of an argument. An argument map typically includes all the key components of the argument, traditionally called the conclusion and the premises, also called contention and reasons. Argument maps can also show co-premises, objections, counterarguments, rebuttals, inferences, and lemmas. There are different styles of argument map but they are often functionally equivalent and represent an argument's individual claims and the relationships between them.

A design rationale is an explicit documentation of the reasons behind decisions made when designing a system or artifact. As initially developed by W.R. Kunz and Horst Rittel, design rationale seeks to provide argumentation-based structure to the political, collaborative process of addressing wicked problems.

The issue-based information system (IBIS) is an argumentation-based approach to clarifying wicked problems—complex, ill-defined problems that involve multiple stakeholders. Diagrammatic visualization using IBIS notation is often called issue mapping.

Compendium is a computer program and social science tool that facilitates the mapping and management of ideas and arguments. The software provides a visual environment that allows people to structure and record collaboration as they discuss and work through wicked problems.

Araucaria is an argument mapping software tool developed in 2001 by Chris Reed and Glenn Rowe, in the Argumentation Research Group at the School of Computing in the University of Dundee, Scotland. It is designed to visually represent arguments through diagrams that can be used for analysis and stored in Argument Markup Language (AML), based on XML. As free software, it is available under the GNU General Public License and may be downloaded for free on the internet.
DSRP is a theory and method of thinking, developed by systems theorist and cognitive scientist Derek Cabrera. It is an acronym that stands for Distinctions, Systems, Relationships, and Perspectives. Cabrera posits that these four patterns underlie all cognition, that they are universal to the process of structuring information, and that people can improve their thinking skills by learning to use the four elements explicitly.

CmapTools is concept mapping software developed by the Florida Institute for Human and Machine Cognition (IHMC). It allows users to easily create graphical nodes representing concepts, and to connect nodes using lines and linking words to form a network of interrelated propositions that represent knowledge of a topic. The software has been used in classrooms and research labs, and in corporate training.

Katy Börner is an engineer, scholar, author, educator, and speaker specializing in data analysis and visualization, particularly in the areas of science and technology (S&T) studies and biomedical applications. Based out of Indiana University, Bloomington, Börner is the Victor Yngve Distinguished Professor of Engineering & Information Science in the Department of Intelligent Systems Engineering and the Department of Information and Library Science at the Luddy School of Informatics, Computing, and Engineering and a member of the Core Cognitive Science Faculty. Since 2012, she has also held the position of visiting professor at the Royal Netherlands Academy of Arts and Sciences (KNAW) in Amsterdam, the Netherlands, and in 2017-2019, she was a Humboldt Fellow at Dresden University of Technology, Germany.
Problem structuring methods (PSMs) are a group of techniques used to model or to map the nature or structure of a situation or state of affairs that some people want to change. PSMs are usually used by a group of people in collaboration to create a consensus about, or at least to facilitate negotiations about, what needs to change. Some widely adopted PSMs include
