SRAS

Last updated
Typical SRAS instrument, the sample is raster scanned to build up a multi-megapixel image of the SAW velocity. SRAS system.jpg
Typical SRAS instrument, the sample is raster scanned to build up a multi-megapixel image of the SAW velocity.

SRAS (spatially resolved acoustic spectroscopy) a non-destructive acoustic microscopy microstructural-crystallographic characterization technique commonly used in the study of crystalline or polycrystalline materials. The technique can provide information about the structure and crystallographic orientation of the material. [1] Traditionally, the information provided by SRAS has been acquired by using diffraction techniques in electron microscopy - such as EBSD. The technique was patented in 2005, EPpatent 1910815  .

Contents

SRAS measures the surface acoustic wave velocity across a specimen, the surface acoustic wave (SAW) velocity is in turn a function of the material state, including parameters such as crystallographic orientation, elastic constants, temperature and stress.

Measurement

In a SRAS measurement, as in most laser ultrasound techniques, two lasers are used, one for the generation of acoustic waves and one for the subsequent detection of these waves.  Considering first the generation of acoustic waves, an optical amplitude grating, illuminated by the a short pulse pump laser (typically ~1ns), is imaged onto the sample surface. The incident light is thermoelastically absorbed, creating surface acoustic waves, such as Rayleigh waves. As the laser pulse contains a broad range of frequencies, only the frequencies which match the grating spacing and acoustic velocity of that sample point will be generated. Using a second, continuous wave, laser these surface acoustic waves can then be measured through a number of interferometry techniques. Detection is usually achieved by optical beam deflection.

As Rayleigh waves are non-dispersive the phase velocity of the acoustic wave can be found by

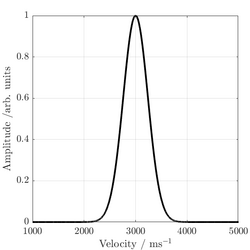
where is the distance between the grating fringes imaged onto the sample surface and is the dominant frequency of the wave packet, found by fast Fourier transform.

SRAS time-domain signal.png
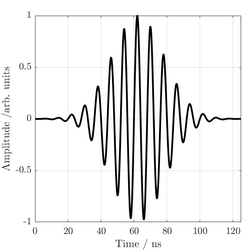
An example of a SRAS time domain signal
Fast Fourier transform of SRAS time domain signal.png
Taking the FFT of the time-domain signal reveals the SAW velocity

As the measurement probes the frequency of the wave packet, which does not change along the propagation length, the measured SAW velocity is determined by only the properties of the specimen at the area where the grating pattern is imaged, unlike more traditional time of flight measurements that are influenced by the sample properties along the propagation length. This makes SRAS robust and immune to the aberrating and scattering effects of the microstructure.

A high-resolution SRAS surface acoustic wave velocity map of Titanium 685 sample. The contrast indicates the grain structure of the material. The velocity varied by over 700 m/s, giving a strong contrast between grains SRAS Ti LG685 zoom.png
A high-resolution SRAS surface acoustic wave velocity map of Titanium 685 sample. The contrast indicates the grain structure of the material. The velocity varied by over 700 m/s, giving a strong contrast between grains

Microstructure imaging

By raster scanning the sample, making measurements at several points across the surface, multi-megapixel images of the SAW velocity can be built up - providing rich microstructural maps. On samples with a good surface finish measurements can be made without averaging, allowing samples to be rapidly scanned. In-theory, means the acquisition rate is limited only by the repetition rate of the pump laser; modern laser repetition rates can exceed 10 kHz. As the measurements do not require a vacuum chamber or acoustic couplant there is little restriction, beyond the limit of scanning stages, to the size of sample which can be interrogated. The elastic anisotropy of most engineering materials means the acoustic response is a function of the loading direction. Hence, a unique velocity map exists for each propagation direction of the SAW direction. It is possible to combine multiple velocity maps to improve contrast between grains.

SRAS Titanium 685 top to bottom.png
Velocity map, waves propagating top to bottom
SRAS Titanium 685 left to right.png
Velocity map, waves propagating left to right
SRAS Titanium 685 vector.png
Vector map, from combing the two velocity maps
Combining orthogonal velocity maps into a vector map highlights the anisotropy of the microstructure and improves contrast between grains in this large grain Titanium 685 sample.

Orientation mapping

Inverse pole figure of two large silicon samples, measured by SRAS. this shows the crystallographic orientation of the macro-sized grains in the solar cell samples SRAS silicon IPF.png
Inverse pole figure of two large silicon samples, measured by SRAS. this shows the crystallographic orientation of the macro-sized grains in the solar cell samples

An acoustic slowness surface can be determined for each pixel by propagating the acoustic wave in several directions. Having measured the SAW velocity in multiple directions the challenge is then to convert this information into the measurement of crystallographic orientation. The direct calculation of the orientation from velocity is a difficult problem. However, the numerical calculation of the SAW velocity as a function of SAW velocity is relatively simple, as first outlined by Farnell. Therefore, a database of possible slowness surfaces can be pre-calculated and compared to the measurement values. For each measurement pixel the orientation is given by the orientation of the pre-calculated velocity surface which best matches the measured data. These maps can spatially describe the crystal orientation of the material being interrogated and can be used to examine microtexture and sample morphology. The technique is applicable to any crystal structure, however transverse isotropy means the full orientation cannot be determined in hexagonal materials, such as titanium. [2]

In order to calculate the predicted SAW velocity of the sample, the materials density and elastic constants must be known. Elastic constants are typically measured by ultrasonic techniques such as resonant ultrasound spectroscopy, with well-established values for most common engineering materials. However, it is possible to attempt the full inverse problem to determine both the elastic constants and crystallographic orientation from only the measured SAW velocity. [3]

Surface acoustic wave velocity (001) plane Si.png
(001) plane
Surface acoustic wave velocity (101) plane Si.png
(101) plane
Surface acoustic wave velocity (111) plane Si.png
(111) plane
Calculated SAW velocities on the three principle planes of Silicon.

From orientation data, a wealth of information can be devised that aids in the understanding of the sample's microstructure and processing history. Recent developments include understanding: the prior texture of parent phases at elevated temperature; the storage and residual deformation after mechanical testing; the population of various microstructural features, including precipitates and grain boundary character.

Single crystal elasticity matrix measuring (SRAS++)

SRAS++ utilises SRAS imaging to provide the raw measurement of single grain velocity surfaces, this is input to a novel inverse solver that mitigates the problem of the inversion being very ill-conditioned, by simultaneously solving for multiple uniquely orientated grains at once in a brute-force approach. This allows simultaneous determination of the elastic constants and crystallographic orientation. Furthermore, this technique has the potential to work on polycrystalline materials with minimal preparation and is capable of high accuracy, with the potential to realise errors in the determination of elastic constants values of less than 1 GPa.

The process of calculating the crystallographic orientation and elastic constants for a synthetic specimen. Sras++.jpg
The process of calculating the crystallographic orientation and elastic constants for a synthetic specimen.
Comparison of the inverse pole figures for the CMSX-4 specimen, from (left to right) EBSD, SRAS using inversion elastic constants and SRAS using existing elastic from literature. Numeric labels in the EBSD data indicate the grains used in the inversion process. The elastic constants calculated by the SRAS inversion in this work have significantly improved the orientation result, relative to the EBSD dataset. Sras++ ni.jpg
Comparison of the inverse pole figures for the CMSX-4 specimen, from (left to right) EBSD, SRAS using inversion elastic constants and SRAS using existing elastic from literature. Numeric labels in the EBSD data indicate the grains used in the inversion process. The elastic constants calculated by the SRAS inversion in this work have significantly improved the orientation result, relative to the EBSD dataset.

Rough surfaces

Smooth mirror-like surfaces provide specular reflections, allowing easy detection of the acoustic wave. However, as surfaces become rougher the reflections become more diffuse, making detection of the acoustic wave more challenging for two reasons. Firstly, the reflected beam is spread out in a cone, as this cone increases in diameter less light is returned to the system - decreasing detection efficiency. Secondly, the light which is returned to the detector no longer exabits a gaussian intensity, instead the interfering wave fronts create a stochastic speckle pattern. However, many engineering processes impart an optically rough surface, for example additive manufacturing or forging, and there is a desire to make measurements on such components in their 'as manufactured state'. To achieve this, an interferometric technique compatible with rough surfaces is required. For example, a Fabry–Pérot interferometer - which is inherently tolerant to speckle, two-wave mixing - which can adapt to the speckle pattern, or a speckle knife edge detector. [6] With the use of such detection techniques, it is possible to make SRAS measurements on optically rough surfaces. [7]

Related Research Articles

<span class="mw-page-title-main">Spectroscopy</span> Study involving matter and electromagnetic radiation

Spectroscopy is the field of study that measures and interprets the electromagnetic spectra that result from the interaction between electromagnetic radiation and matter as a function of the wavelength or frequency of the radiation. In simpler terms, spectroscopy is the precise study of color as generalized from visible light to all bands of the electromagnetic spectrum.

<span class="mw-page-title-main">Time of flight</span> Timing of substance within a medium

Time of flight (ToF) is the measurement of the time taken by an object, particle or wave to travel a distance through a medium. This information can then be used to measure velocity or path length, or as a way to learn about the particle or medium's properties. The traveling object may be detected directly or indirectly. Time of flight technology has found valuable applications in the monitoring and characterization of material and biomaterials, hydrogels included.

<span class="mw-page-title-main">Texture (chemistry)</span>

In physical chemistry and materials science, texture is the distribution of crystallographic orientations of a polycrystalline sample. A sample in which these orientations are fully random is said to have no distinct texture. If the crystallographic orientations are not random, but have some preferred orientation, then the sample has a weak, moderate or strong texture. The degree is dependent on the percentage of crystals having the preferred orientation.

<span class="mw-page-title-main">Electron backscatter diffraction</span> Scanning electron microscopy technique

Electron backscatter diffraction (EBSD) is a scanning electron microscopy (SEM) technique used to study the crystallographic structure of materials. EBSD is carried out in a scanning electron microscope equipped with an EBSD detector comprising at least a phosphorescent screen, a compact lens and a low-light camera. In the microscope an incident beam of electrons hits a tilted sample. As backscattered electrons leave the sample, they interact with the atoms and are both elastically diffracted and lose energy, leaving the sample at various scattering angles before reaching the phosphor screen forming Kikuchi patterns (EBSPs). The EBSD spatial resolution depends on many factors, including the nature of the material under study and the sample preparation. They can be indexed to provide information about the material's grain structure, grain orientation, and phase at the micro-scale. EBSD is used for impurities and defect studies, plastic deformation, and statistical analysis for average misorientation, grain size, and crystallographic texture. EBSD can also be combined with energy-dispersive X-ray spectroscopy (EDS), cathodoluminescence (CL), and wavelength-dispersive X-ray spectroscopy (WDS) for advanced phase identification and materials discovery.

<span class="mw-page-title-main">Metallography</span> Study of metals using microscopy

Metallography is the study of the physical structure and components of metals, by using microscopy.

Laser-ultrasonics uses lasers to generate and detect ultrasonic waves. It is a non-contact technique used to measure materials thickness, detect flaws and carry out materials characterization. The basic components of a laser-ultrasonic system are a generation laser, a detection laser and a detector.

<span class="mw-page-title-main">Selected area diffraction</span>

Selected area (electron) diffraction is a crystallographic experimental technique typically performed using a transmission electron microscope (TEM). It is a specific case of electron diffraction used primarily in material science and solid state physics as one of the most common experimental techniques. Especially with appropriate analytical software, SAD patterns (SADP) can be used to determine crystal orientation, measure lattice constants or examine its defects.

Nanoindentation, also called instrumented indentation testing, is a variety of indentation hardness tests applied to small volumes. Indentation is perhaps the most commonly applied means of testing the mechanical properties of materials. The nanoindentation technique was developed in the mid-1970s to measure the hardness of small volumes of material.

In materials science, grain growth is the increase in size of grains (crystallites) in a material at high temperature. This occurs when recovery and recrystallisation are complete and further reduction in the internal energy can only be achieved by reducing the total area of grain boundary. The term is commonly used in metallurgy but is also used in reference to ceramics and minerals. The behaviors of grain growth is analogous to the coarsening behaviors of grains, which implied that both of grain growth and coarsening may be dominated by the same physical mechanism.

The three-dimensional elastic constants of materials can be measured using the ultrasonic immersion method. This was pioneered by Zimmer and Cost from the National Physical Laboratory in the 1960s. It has mainly been used for polymer composite materials. Knowledge of the elastic constants can be used to feed back into models of the material's behaviour or that of the composite manufacturing process used.

Picosecond ultrasonics is a type of ultrasonics that uses ultra-high frequency ultrasound generated by ultrashort light pulses. It is a non-destructive technique in which picosecond acoustic pulses penetrate into thin films or nanostructures to reveal internal features such as film thickness as well as cracks, delaminations and voids. It can also be used to probe liquids. The technique is also referred to as picosecond laser ultrasonics or laser picosecond acoustics.

<span class="mw-page-title-main">Electromagnetic acoustic transducer</span>

Electromagnetic acoustic transducer (EMAT) is a transducer for non-contact acoustic wave generation and reception in conducting materials. Its effect is based on electromagnetic mechanisms, which do not need direct coupling with the surface of the material. Due to this couplant-free feature, EMATs are particularly useful in harsh, i.e., hot, cold, clean, or dry environments. EMATs are suitable to generate all kinds of waves in metallic and/or magnetostrictive materials. Depending on the design and orientation of coils and magnets, shear horizontal (SH) bulk wave mode, surface wave, plate waves such as SH and Lamb waves, and all sorts of other bulk and guided-wave modes can be excited. After decades of research and development, EMAT has found its applications in many industries such as primary metal manufacturing and processing, automotive, railroad, pipeline, boiler and pressure vessel industries, in which they are typically used for nondestructive testing (NDT) of metallic structures.

<span class="mw-page-title-main">Atomic force acoustic microscopy</span>

Atomic force acoustic microscopy (AFAM) is a type of scanning probe microscopy (SPM). It is a combination of acoustics and atomic force microscopy. The principal difference between AFAM and other forms of SPM is the addition of a transducer at the bottom of the sample which induces longitudinal out-of-plane vibrations in the specimen. These vibrations are sensed by a cantilever and tip called a probe. The figure shown here is the clear schematic of AFAM principle here B is the magnified version of the tip and sample placed on the transducer and tip having some optical coating generally gold coating to reflect the laser light on to the photodiode.

Brillouin spectroscopy is an empirical spectroscopy technique which allows the determination of elastic moduli of materials. The technique uses inelastic scattering of light when it encounters acoustic phonons in a crystal, a process known as Brillouin scattering, to determine phonon energies and therefore interatomic potentials of a material. The scattering occurs when an electromagnetic wave interacts with a density wave, photon-phonon scattering.

Resonant ultrasound spectroscopy (RUS) is a laboratory technique used in geology and material science to measure fundamental material properties involving elasticity. This technique relies on the fact that solid objects have natural frequencies at which they vibrate when mechanically excited. The natural frequency depends on the elasticity, size, and shape of the object—RUS exploits this property of solids to determine the elastic tensor of the material. The great advantage of this technique is that the entire elastic tensor is obtained from a single crystal sample in a single rapid measurement. At lower or more general frequencies, this method is known as acoustic resonance spectroscopy.

Active thermography is an advanced nondestructive testing procedure, which uses a thermography measurement of a tested material thermal response after its external excitation. This principle can be used also for non-contact infrared non-destructive testing (IRNDT) of materials.

Dislocation avalanches are rapid discrete events during plastic deformation, in which defects are reorganized collectively. This intermittent flow behavior has been observed in microcrystals, whereas macroscopic plasticity appears as a smooth process. Intermittent plastic flow has been observed in several different systems. In AlMg Alloys, interaction between solute and dislocations can cause sudden jump during dynamic strain aging. In metallic glass, it can be observed via shear banding with stress localization; and single crystal plasticity, it shows up as slip burst. However, analysis of the events with orders-magnitude difference in sizes with different crystallographic structure reveals power-law scaling between the number of events and their magnitude, or scale-free flow.

Crystal plasticity is a mesoscale computational technique that takes into account crystallographic anisotropy in modelling the mechanical behaviour of polycrystalline materials. The technique has typically been used to study deformation through the process of slip, however, there are some flavors of crystal plasticity that can incorporate other deformation mechanisms like twinning and phase transformations. Crystal plasticity is used to obtain the relationship between stress and strain that also captures the underlying physics at the crystal level. Hence, it can be used to predict not just the stress-strain response of a material, but also the texture evolution, micromechanical field distributions, and regions of strain localisation. The two widely used formulations of crystal plasticity are the one based on the finite element method known as Crystal Plasticity Finite Element Method (CPFEM), which is developed based on the finite strain formulation for the mechanics, and a spectral formulation which is more computationally efficient due to the fast Fourier transform, but is based on the small strain formulation for the mechanics.

<span class="mw-page-title-main">CrysTBox</span> Free crystallographic software

CrysTBox is a suite of computer tools designed to accelerate material research based on transmission electron microscope images via highly accurate automated analysis and interactive visualization. Relying on artificial intelligence and computer vision, CrysTBox makes routine crystallographic analyses simpler, faster and more accurate compared to human evaluators. The high level of automation together with sub-pixel precision and interactive visualization makes the quantitative crystallographic analysis accessible even for non-crystallographers allowing for an interdisciplinary research. Simultaneously, experienced material scientists can take advantage of advanced functionalities for comprehensive analyses.

Dark-field X-ray microscopy is an imaging technique used for multiscale structural characterisation. It is capable of mapping deeply embedded structural elements with nm-resolution using synchrotron X-ray diffraction-based imaging. The technique works by using scattered X-rays to create a high degree of contrast, and by measuring the intensity and spatial distribution of the diffracted beams, it is possible to obtain a three-dimensional map of the sample's structure, orientation, and local strain.

References

  1. Patel, Rikesh; Li, Wenqi; Smith, Richard J.; Sharples, Steve D.; Clark, Matt (November 2017). "Orientation imaging of macro-sized polysilicon grains on wafers using spatially resolved acoustic spectroscopy". Scripta Materialia. 140: 67–70. doi: 10.1016/j.scriptamat.2017.07.003 .
  2. Dryburgh, Paul; Smith, Richard J.; Marrow, Paul; Lainé, Steven J.; Sharples, Steve D.; Clark, Matt; Li, Wenqi (2020-12-01). "Determining the crystallographic orientation of hexagonal crystal structure materials with surface acoustic wave velocity measurements". Ultrasonics. 108: 106171. doi: 10.1016/j.ultras.2020.106171 . ISSN   0041-624X. PMID   32497903. S2CID   219331320.
  3. Dryburgh, Paul; Li, Wenqi; Pieris, Don; Fuentes-Domínguez, Rafael; Patel, Rikesh; Smith, Richard J.; Clark, Matt (2022-02-15). "Measurement of the single crystal elasticity matrix of polycrystalline materials". Acta Materialia. 225: 117551. Bibcode:2022AcMat.22517551D. doi: 10.1016/j.actamat.2021.117551 . ISSN   1359-6454.
  4. Dryburgh, Paul; Li, Wenqi; Pieris, Don; Fuentes-Domínguez, Rafael; Patel, Rikesh; Smith, Richard; Clark, Matt (2021-12-07). "Measurement of the single crystal elasticity matrix of polycrystalline materials". Acta Materialia. 225: 117551. doi: 10.1016/j.actamat.2021.117551 . ISSN   1359-6454.
  5. Dryburgh, Paul; Li, Wenqi; Pieris, Don; Fuentes-Domínguez, Rafael; Patel, Rikesh; Smith, Richard; Clark, Matt (2021-12-07). "Measurement of the single crystal elasticity matrix of polycrystalline materials". Acta Materialia. 225: 117551. doi: 10.1016/j.actamat.2021.117551 . ISSN   1359-6454.
  6. Sharpies, S D; Light, R A; Achamfuo-Yeboah, S O; Clark, M; Somekh, M G (2014-06-03). "The SKED: speckle knife edge detector". Journal of Physics: Conference Series. 520 (1): 012004. Bibcode:2014JPhCS.520a2004S. doi: 10.1088/1742-6596/520/1/012004 . ISSN   1742-6588.
  7. Patel, Rikesh; Hirsch, Matthias; Dryburgh, Paul; Pieris, Don; Achamfuo-Yeboah, Samuel; Smith, Richard; Light, Roger; Sharples, Steve; Clare, Adam; Clark, Matt (2018-10-19). "Imaging Material Texture of As-Deposited Selective Laser Melted Parts Using Spatially Resolved Acoustic Spectroscopy". Applied Sciences. 8 (10): 1991. doi: 10.3390/app8101991 . ISSN   2076-3417.