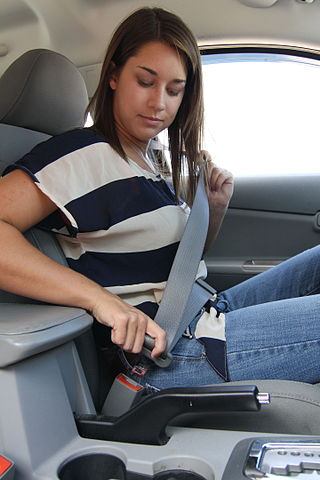
A seat belt, also known as a safety belt or spelled seatbelt, is a vehicle safety device designed to secure the driver or a passenger of a vehicle against harmful movement that may result during a collision or a sudden stop. A seat belt reduces the likelihood of death or serious injury in a traffic collision by reducing the force of secondary impacts with interior strike hazards, by keeping occupants positioned correctly for maximum effectiveness of the airbag, and by preventing occupants being ejected from the vehicle in a crash or if the vehicle rolls over.

Road traffic safety refers to the methods and measures used to prevent road users from being killed or seriously injured. Typical road users include pedestrians, cyclists, motorists, vehicle passengers, horse riders, and passengers of on-road public transport.
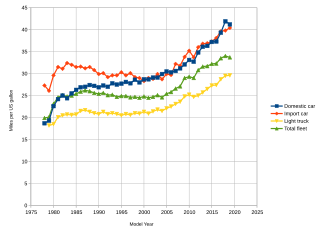
Corporate average fuel economy (CAFE) standards are regulations in the United States, first enacted by the United States Congress in 1975, after the 1973–74 Arab Oil Embargo, to improve the average fuel economy of cars and light trucks produced for sale in the United States. More recently, efficiency standards were developed and implemented for heavy-duty pickup trucks and commercial medium-duty and heavy-duty vehicles.

Click It or Ticket is a National Highway Traffic Safety Administration campaign aimed at increasing the use of seat belts among young people in the United States. The campaign relies heavily on targeted advertising aimed at teens and young adults.
Seat belt legislation requires the fitting of seat belts to motor vehicles and the wearing of seat belts by motor vehicle occupants to be mandatory. Laws requiring the fitting of seat belts to cars have in some cases been followed by laws mandating their use, with the effect that thousands of deaths on the road have been prevented. Different laws apply in different countries to the wearing of seat belts.
The National Highway Traffic Safety Administration is an agency of the U.S. federal government, part of the Department of Transportation, focused on transportation safety in the United States.

The National Traffic and Motor Vehicle Safety Act was enacted in the United States in 1966 to empower the federal government to set and administer new safety standards for motor vehicles and road traffic safety. The Act was the first mandatory federal safety standards for motor vehicles. The Act created the National Highway Safety Bureau. The Act was one of a number of initiatives by the government in response to increasing number of cars and associated fatalities and injuries on the road following a period when the number of people killed on the road had increased 6-fold and the number of vehicles was up 11-fold since 1925. The reduction of the rate of death attributable to motor-vehicle crashes in the United States represents the successful public health response to a great technologic advance of the 20th century—the motorization of the United States.

This table shows the motor vehicle fatality rate in the United States by year from 1899 through 2021. It excludes indirect car-related fatalities.

A daytime running lamp is an automotive lighting and bicycle lighting device on the front of a roadgoing motor vehicle or bicycle, automatically switched on when the vehicle's handbrake has been pulled down, when the vehicle is in gear, or when the engine is started, emitting white, yellow, or amber light. Their intended use is not to help the driver see the road or their surroundings, but to help other road users identify an active vehicle.

This is a list of numbers of motorcycle deaths in U.S. by year from 1994 to 2014. United States motorcycle fatalities increased every year for 11 years after reaching a historic low of 2,116 fatalities in 1997, then increased to over 5,000 around 2008 and then plateaued in the 4 to 5 thousands range in the 2010s. In nine years motorcycle deaths more than doubled from the late 1990s to 2008. Despite providing less than 1% of miles driven, they made up 15% of traffic deaths in 2012.
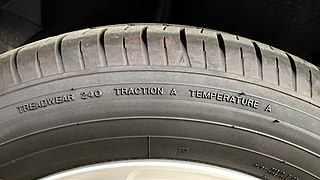
Uniform Tire Quality Grading, commonly abbreviated as UTQG, is the term encompassing a set of standards for passenger car tires that measures a tire's treadwear, temperature resistance and traction. The UTQG was created by the National Highway Traffic Safety Administration in 1978, a branch of the United States Department of Transportation (DOT). All tires manufactured for sale in the United States since March 31, 1979 are federally mandated to have the UTQG ratings on their sidewall as part of the DOT approval process, in which non-DOT approved tires are not legal for street use in the United States. It is not to be confused with the tire code, a supplemental and global standard measuring tire dimensions, load-bearing ability and maximum speed, maintained by tire industry trade organizations and the International Organization for Standardization.
Transportation safety in the United States encompasses safety of transportation in the United States, including automobile crashes, airplane crashes, rail crashes, and other mass transit incidents, although the most fatalities are generated by road incidents annually killing 32,479 people in 2011 to over 42,000 people in 2022. The number of deaths per passenger-mile on commercial airlines in the United States between 2000 and 2010 was about 0.2 deaths per 10 billion passenger-miles. For driving, the rate was 150 per 10 billion vehicle-miles: 750 times higher per mile than for flying in a commercial airplane.

The National Maximum Speed Limit (NMSL) was a provision of the federal government of the United States 1974 Emergency Highway Energy Conservation Act that effectively prohibited speed limits higher than 55 miles per hour (89 km/h). It was drafted in response to oil price spikes and supply disruptions during the 1973 oil crisis and remained the law until 1995.

Most seat belt laws in the United States are left to the state or country’s law. However, the recommended age for a child to sit in the front passenger seat is 13. The first seat belt law was a federal law, Title 49 of the United States Code, Chapter 301, Motor Safety Standard, which took effect on January 1, 1968, that required all vehicles to be fitted with seat belts in all designated seating positions. This law has since been modified to require three-point seat belts in outboard-seating positions, and finally three-point seat belts in all seating positions. Seat belt use was voluntary until New York became the first state to require vehicle occupants to wear seat belts, as of December 1, 1984. New Hampshire is the only state with no law requiring adults to wear seat belts in a vehicle.

86 percent of people in the United States use private automobiles as their primary form of transportation to their workplace.

A traffic collision, also called a motor vehicle collision, occurs when a vehicle collides with another vehicle, pedestrian, animal, road debris, or other moving or stationary obstruction, such as a tree, pole or building. Traffic collisions often result in injury, disability, death, and property damage as well as financial costs to both society and the individuals involved. Road transport is the most dangerous situation people deal with on a daily basis, but casualty figures from such incidents attract less media attention than other, less frequent types of tragedy. The commonly used term car accident is increasingly falling out of favor with many government departments and organizations, with the Associated Press style guide recommending caution before using the term. Some collisions are intentional vehicle-ramming attacks, staged crashes, vehicular homicide or vehicular suicide.
When a person makes a claim for personal injury damages that have resulted from the presence of a defective automobile or component of an automobile, that person asserts a product liability claim. That claim may be against the automobile's manufacturer, the manufacturer of a component part or system, or both, as well as potentially being raised against companies that distributed, sold or installed the part or system that is alleged to be defective.

Worldwide, it was estimated that 1.25 million people were killed and many millions more were injured in motor vehicle collisions in 2013. This makes motor vehicle collisions the leading cause of death among young adults of 15–29 years of age and the ninth most frequent cause of death for all ages worldwide. In the United States, 40,100 people died and 2.8 million were injured in crashes in 2017, and around 2,000 children under 16 years old die every year.

Alcohol-related traffic crashes are defined by the United States National Highway Traffic Safety Administration (NHTSA) as alcohol-related if either a driver or a non-motorist had a measurable or estimated BAC of 0.01 g/dl or above.

People who are driving as part of their work duties are an important road user category. First, workers themselves are at risk of road traffic injury. Contributing factors include fatigue and long work hours, delivery pressures, distractions from mobile phones and other devices, lack of training to operate the assigned vehicle, vehicle defects, use of prescription and non-prescription medications, medical conditions, and poor journey planning. Death, disability, or injury of a family wage earner due to road traffic injury, in addition to causing emotional pain and suffering, creates economic hardship for the injured worker and family members that may persist well beyond the event itself.
