
A mind map is a diagram used to visually organize information into a hierarchy, showing relationships among pieces of the whole. It is often created around a single concept, drawn as an image in the center of a blank page, to which associated representations of ideas such as images, words and parts of words are added. Major ideas are connected directly to the central concept, and other ideas branch out from those major ideas.

A semantic network, or frame network is a knowledge base that represents semantic relations between concepts in a network. This is often used as a form of knowledge representation. It is a directed or undirected graph consisting of vertices, which represent concepts, and edges, which represent semantic relations between concepts, mapping or connecting semantic fields. A semantic network may be instantiated as, for example, a graph database or a concept map. Typical standardized semantic networks are expressed as semantic triples.

A storyboard is a graphic organizer that consists of illustrations or images displayed in sequence for the purpose of pre-visualizing a motion picture, animation, motion graphic or interactive media sequence. The storyboarding process, in the form it is known today, was developed at Walt Disney Productions during the early 1930s, after several years of similar processes being in use at Walt Disney and other animation studios.
A graphic organizer, also known as a knowledge map, concept map, story map, cognitive organizer, advance organizer, or concept diagram, is a pedagogical tool that uses visual symbols to express knowledge and concepts through relationships between them. The main purpose of a graphic organizer is to provide a visual aid to facilitate learning and instruction.
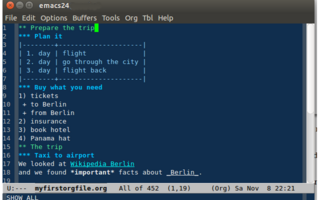
An outliner is a specialized type of text editor used to create and edit outlines, which are text files which have a tree structure, for organization. Textual information is contained in discrete sections called "nodes", which are arranged according to their topic–subtopic (parent–child) relationships, like the members of a family tree. When loaded into an outliner, an outline may be collapsed or expanded to display as few or as many levels as desired.
Graphics are visual images or designs on some surface, such as a wall, canvas, screen, paper, or stone, to inform, illustrate, or entertain. In contemporary usage, it includes a pictorial representation of data, as in design and manufacture, in typesetting and the graphic arts, and in educational and recreational software. Images that are generated by a computer are called computer graphics.
A concept map or conceptual diagram is a diagram that depicts suggested relationships between concepts. Concept maps may be used by instructional designers, engineers, technical writers, and others to organize and structure knowledge.
An outline, also called a hierarchical outline, is a list arranged to show hierarchical relationships and is a type of tree structure. An outline is used to present the main points or topics (terms) of a given subject. Each item in an outline may be divided into additional sub-items. If an organizational level in an outline is to be sub-divided, it shall have at least two subcategories, although one subcategory is acceptable on the third and fourth levels, as advised by major style manuals in current use. An outline may be used as a drafting tool of a document, or as a summary of the content of a document or of the knowledge in an entire field. It is not to be confused with the general context of the term "outline", which a summary or overview of a subject, presented verbally or written in prose. The outlines described in this article are lists, and come in several varieties.

Infographics are graphic visual representations of information, data, or knowledge intended to present information quickly and clearly. They can improve cognition by using graphics to enhance the human visual system's ability to see patterns and trends. Similar pursuits are information visualization, data visualization, statistical graphics, information design, or information architecture. Infographics have evolved in recent years to be for mass communication, and thus are designed with fewer assumptions about the readers' knowledge base than other types of visualizations. Isotypes are an early example of infographics conveying information quickly and easily to the masses.
A KWL table, or KWL chart, is a graphical organizer designed to help in learning. The letters KWL are an acronym, for what students, in the course of a lesson, already know, want to know, and ultimately learn. It is a part of the constructivist teaching method where students move away from what are considered traditional methods of teaching and learning. In this particular methodology the students are given the space to learn by constructing their own learning pace and their own style of understanding a given topic or idea. The KWL chart or table was developed within this methodology and is a form of instructional reading strategy that is used to guide students taking them through the idea and the text. A KWL table is typically divided into three columns titled Know, Want and Learned. The table comes in various forms as some have modified it to include or exclude information.

Group concept mapping is a structured methodology for organizing the ideas of a group on any topic of interest and representing those ideas visually in a series of interrelated maps. It is a type of integrative mixed method, combining qualitative and quantitative approaches to data collection and analysis. Group concept mapping allows for a collaborative group process with groups of any size, including a broad and diverse array of participants. Since its development in the late 1980s by William M.K. Trochim at Cornell University, it has been applied to various fields and contexts, including community and public health, social work, health care, human services, and biomedical research and evaluation.
Reading comprehension is the ability to process written text, understand its meaning, and to integrate with what the reader already knows. Reading comprehension relies on two abilities that are connected to each other: word reading and language comprehension. Comprehension specifically is a "creative, multifaceted process" dependent upon four language skills: phonology, syntax, semantics, and pragmatics.

Note-taking is the practice of recording information from different sources and platforms. By taking notes, the writer records the essence of the information, freeing their mind from having to recall everything. Notes are commonly drawn from a transient source, such as an oral discussion at a meeting, or a lecture, in which case the notes may be the only record of the event. Since the advent of writing and literacy, notes traditionally were almost always handwritten, but the introduction of notetaking software has made digital notetaking possible and widespread. Note-taking is a foundational skill in personal knowledge management.

Study skills or study strategies are approaches applied to learning. Study skills are an array of skills which tackle the process of organizing and taking in new information, retaining information, or dealing with assessments. They are discrete techniques that can be learned, usually in a short time, and applied to all or most fields of study. More broadly, any skill which boosts a person's ability to study, retain and recall information which assists in and passing exams can be termed a study skill, and this could include time management and motivational techniques.
The seven management and planning tools have their roots in operations research work done after World War II and the Japanese total quality control (TQC) research.
Knowledge management software is a subset of content management software, which contains a range of software that specializes in the way information is collected, stored and/or accessed. The concept of knowledge management is based on a range of practices used by an individual, a business, or a large corporation to identify, create, represent and redistribute information for a range of purposes. Software that enables an information practice or range of practices at any part of the processes of information management can be deemed to be called information management software. A subset of information management software that emphasizes an approach to build knowledge out of information that is managed or contained is often called knowledge management software.

A mood board is a type of visual presentation or 'collage' consisting of images, text, and samples of objects in a composition. It can be based on a set topic or can be any material chosen at random. A mood board can be used to convey a general idea or feeling about a particular topic. They may be physical or digital, and can be effective presentation tools.
Prewriting is the first stage of the writing process, typically followed by drafting, revision, editing and publishing. Prewriting can consist of a combination of outlining, diagramming, storyboarding, and clustering.

Compendium is a computer program and social science tool that facilitates the mapping and management of ideas and arguments. The software provides a visual environment that allows people to structure and record collaboration as they discuss and work through wicked problems.
The Institute for Dynamic Educational Advancement (IDEA.org) is a U.S.-based nonprofit organization working in the area of scientific and cultural literacy. The organization was established in 1998 and incorporated in 2002, and has collaborated with museums, schools, nonprofit organizations, and public service projects.