In bioinformatics, sequence analysis is the process of subjecting a DNA, RNA or peptide sequence to any of a wide range of analytical methods to understand its features, function, structure, or evolution. It can be performed on the entire genome, transcriptome or proteome of an organism, and can also involve only selected segments or regions, like tandem repeats and transposable elements. Methodologies used include sequence alignment, searches against biological databases, and others.[1]
Since the development of methods of high-throughput production of gene and protein sequences, the rate of addition of new sequences to the databases increased very rapidly. Such a collection of sequences does not, by itself, increase the scientist's understanding of the biology of organisms. However, comparing these new sequences to those with known functions is a key way of understanding the biology of an organism from which the new sequence comes. Thus, sequence analysis can be used to assign function to coding and non-coding regions in a biological sequence usually by comparing sequences and studying similarities and differences. Nowadays, there are many tools and techniques that provide the sequence comparisons (sequence alignment) and analyze the alignment product to understand its biology.Sequence analysis in molecular biology includes a very wide range of processes:[citation needed]
The comparison of sequences to find similarity, often to infer if they are related (homologous)
Revealing the evolution and genetic diversity of sequences and organisms
Identification of molecular structure from sequence alone.
History
Since the very first sequences of the insulin protein were characterized by Fred Sanger in 1951, biologists have been trying to use this knowledge to understand the function of molecules.[2][3] He and his colleagues' discoveries contributed to the successful sequencing of the first DNA-based genome.[4] The method used in this study, which is called the "Sanger method" or Sanger sequencing, was a milestone in sequencing long strand molecules such as DNA. This method was eventually used in the Human Genome Project.[5] According to Michael Levitt, sequence analysis was born in the period from 1969 to 1977.[6] In 1969 the analysis of sequences of transfer RNAs was used to infer residue interactions from correlated changes in the nucleotide sequences, giving rise to a model of the tRNA secondary structure.[7] In 1970, Saul B. Needleman and Christian D. Wunsch published the first computer algorithm for aligning two sequences.[8] Over this time, developments in obtaining nucleotide sequence improved greatly, leading to the publication of the first complete genome of a bacteriophage in 1977.[9] Robert Holley and his team in Cornell University were believed to be the first to sequence an RNA molecule.[10]
Overview of nucleotide sequence analysis (DNA and RNA)
Nucleotide sequence analyses identify functional elements like protein binding sites, uncover genetic variations like SNPs, study gene expression patterns, and understand the genetic basis of traits. It helps to understand mechanisms that contribute to processes like replication and transcription. Some of the tasks involved are outlined below.[citation needed]
Quality control and preprocessing
Quality control assesses the quality of sequencing reads obtained from the sequencing technology (e.g. Illumina). It is the first step in sequence analysis to limit wrong conclusions due to poor quality data. The tools used at this stage depend on the sequencing platform. For instance, FastQC checks the quality of short reads (including RNA sequences), Nanoplot or PycoQC are used for long read sequences (e.g. Nanopore sequence reads), and MultiQC aggregates the result of FastQC in a webpage format.[11][12][13]
Quality control provides information such as read lengths, GC content, presence of adapter sequences (for short reads), and a quality score, which is often expressed on a PHRED scale.[14] If adapters or other artifacts from PCR amplification are present in the reads (particularly short reads), they are removed using software such as Trimmomatic[15] or Cutadapt.[16]
Read alignment
At this step, sequencing reads whose quality have been improved are mapped to a reference genome using alignment tools like BWA[17] for short DNA sequence reads, minimap[18] for long read DNA sequences, and STAR[19] for RNA sequence reads. The purpose of mapping is to find the origin of any given read based on the reference sequence. It is also important for detecting variations or phylogenetic studies. The output from this step, that is, the aligned reads, are stored in compatible file formats known as SAM, which contains information about the reference genome as well as individual reads. Alternatively, BAM file formats are preferred as they use much less desk or storage space.[14]
Note: This is different from sequence alignment which compares two or more whole sequences (or sequence regions) to quantify similarity or differences or to identify an unknown sequence (as discussed below).
The following analyses steps are peculiar to DNA sequences:
Variant calling
Identifying variants is a popular aspect of sequence analysis as variants often contain information of biological significance, such as explaining the mechanism of drug resistance in an infectious disease. These variants could be single nucleotide variants (SNVs), small insertions/deletions (indels), and large structural variants. The read alignments are sorted using SAMtools, after which variant callers such as GATK[20] are used to identify differences compared to the reference sequence.
The choice of variant calling tool depends heavily on the sequencing technology used, so GATK is often used when working with short reads, while long read sequences require tools like DeepVariant[21] and Sniffles.[22] Tools may also differ based on organism (prokaryotes or eukaryotes), source of sequence data (cancer vs metagenomic), and variant type of interest (SNVs or structural variants). The output of variant calling is typically in vcf format, and can be filtered using allele frequencies, quality scores, or other factors based on the research question at hand.[14]
Variant annotation
This step adds context to the variant data using curated information from peer-reviewed papers and publicly available databases like gnomAD and Ensembl. Variants can be annotated with information about genomic features, functional consequences, regulatory elements, and population frequencies using tools like ANNOVAR or SnpEff,[23] or custom scripts and pipeline. The output from this step is an annotation file in bed or txt format.[14]
Visualization and interpretation
Genomic data, such as read alignments, coverage plots, and variant calls, can be visualized using genome browsers like IGV (Integrative Genomics Viewer) or UCSC Genome Browser. Interpretation of the results is done in the context of the biological question or hypothesis under investigation. The output can be a graphical representation of data in the forms of Circos plots, volcano plots, etc., or other forms of report describing the observations.[14]
DNA sequence analysis could also involve statistical modeling to infer relationships and epigenetic analysis, like identifying differential methylation regions using a tool like DSS.[citation needed]
The following steps are peculiar to RNA sequences:
Gene expression analysis
Mapped RNA sequences are analyzed to estimate gene expression levels using quantification tools such as HTSeq,[24] and identify differentially expressed genes (DEGs) between experimental conditions using statistical methods like DESeq2.[25] This is carried out to compare the expression levels of genes or isoforms between or across different samples, and infer biological relevance.[14] The output of gene expression analysis is typically a table with values representing the expression levels of gene IDs or names in rows and samples in the columns as well as standard errors and p-values. The results in the table can be further visualized using volcano plots and heatmaps, where colors represent the estimated expression level. Packages like ggplot2 in R and Matplotlib in Python are often used to create the visuals. The table can also be annotated using a reference annotation file, usually in GTF or GFF format to provide more context about the genes, such as the chromosome name, strand, and start and positions, and aid result interpretation.[14][12][13][26]
Functional enrichment analysis identifies biological processes, pathways, and functional impacts associated with differentially expressed genes obtained from the previous step. It uses tools like GOSeq[27] and Pathview.[28] This creates a table with information about what pathways and molecular processes are associated with the differentially expressed genes, what genes are down or upregulated, and what gene ontology terms are recurrent or over-represented.[14][12][13][26]
RNA sequence analysis explores gene expression dynamics and regulatory mechanisms underlying biological processes and diseases. Interpretation of images and tables are carried out within the context of the hypotheses being investigated.[citation needed]
Analyzing protein sequences
Proteome sequence analysis studies the complete set of proteins expressed by an organism or a cell under specific conditions. It describes protein structure, function, post-translational modifications, and interactions within biological systems. It often starts with raw mass spectrometry (MS) data from proteomics experiments, typically in mzML, mzXML, or RAW file formats.[14]
Beyond preprocessing raw MS data to remove noise, normalize intensities, and detect peaks and converting proprietary file formats (e.g., RAW) to open-source formats (mzML, mzXML) for compatibility with downstream analysis tools, other analytical steps include peptide identification, peptide quantification, protein inference and quantification, generating quality control report, and normalization, imputation and significance testing. The choice and order of analytical steps depend on the MS method used, which can either be data dependent acquisition (DDA) or independent acquisition (DIA).[14][29]
Genome browsers in sequence analysis
Genome browsers offer a non-code, user-friendly interface to visualize genomes and genomic segments, identify genomic features, and analyze the relationship between numerous genomic elements. The three primary genome browsers—Ensembl genome browser, UCSC genome browser, and the National Centre for Biotechnology Information (NCBI)—support different sequence analysis procedures, including genome assembly, genome annotation, and comparative genomics like exploring differential expression patterns and identifying conserved regions. All browsers support multiple data formats for upload and download and provide links to external tools and resources for sequence analyses, which contributes to their versatility.[30][31]
There are millions of protein and nucleotide sequences known. These sequences fall into many groups of related sequences known as protein families or gene families. Relationships between these sequences are usually discovered by aligning them together and assigning this alignment a score. There are two main types of sequence alignment. Pair-wise sequence alignment only compares two sequences at a time and multiple sequence alignment compares many sequences. Two important algorithms for aligning pairs of sequences are the Needleman-Wunsch algorithm and the Smith-Waterman algorithm. Popular tools for sequence alignment include:[citation needed]
A common use for pairwise sequence alignment is to take a sequence of interest and compare it to all known sequences in a database to identify homologous sequences. In general, the matches in the database are ordered to show the most closely related sequences first, followed by sequences with diminishing similarity. These matches are usually reported with a measure of statistical significance such as an Expectation value.[citation needed]
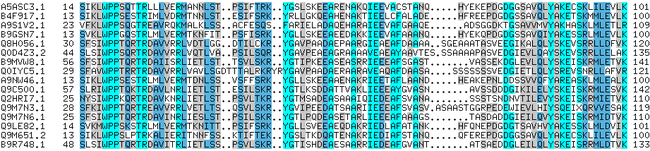
Profile comparison
In 1987, Michael Gribskov, Andrew McLachlan, and David Eisenberg introduced the method of profile comparison for identifying distant similarities between proteins.[32] Rather than using a single sequence, profile methods use a multiple sequence alignment to encode a profile which contains information about the conservation level of each residue. These profiles can then be used to search collections of sequences to find sequences that are related. Profiles are also known as Position Specific Scoring Matrices (PSSMs). In 1993, a probabilistic interpretation of profiles was introduced by Anders Krogh and colleagues using hidden Markov models.[33][34] These models have become known as profile-HMMs.
In recent years,[when?] methods have been developed that allow the comparison of profiles directly to each other. These are known as profile-profile comparison methods.[35]
Sequence assembly
Sequence assembly refers to the reconstruction of a DNA sequence by aligning and merging small DNA fragments. It is an integral part of modern DNA sequencing. Since presently-available DNA sequencing technologies are ill-suited for reading long sequences, large pieces of DNA (such as genomes) are often sequenced by (1) cutting the DNA into small pieces, (2) reading the small fragments, and (3) reconstituting the original DNA by merging the information on various fragments.[citation needed]
Recently, sequencing multiple species at one time is one of the top research objectives. Metagenomics is the study of microbial communities directly obtained from the environment. Different from cultured microorganisms from the lab, the wild sample usually contains dozens, sometimes even thousands of types of microorganisms from their original habitats.[36] Recovering the original genomes can prove to be very challenging.[citation needed]
Gene prediction or gene finding refers to the process of identifying the regions of genomic DNA that encode genes. This includes protein-coding genes as well as RNA genes, but may also include the prediction of other functional elements such as regulatory regions. Geri is one of the first and most important steps in understanding the genome of a species once it has been sequenced. In general, the prediction of bacterial genes is significantly simpler and more accurate than the prediction of genes in eukaryotic species that usually have complex intron/exon patterns. Identifying genes in long sequences remains a problem, especially when the number of genes is unknown. Hidden markov models can be part of the solution.[37] Machine learning has played a significant role in predicting the sequence of transcription factors.[38] Traditional sequencing analysis focused on the statistical parameters of the nucleotide sequence itself (The most common programs used are listed in Table 4.1). Another method is to identify homologous sequences based on other known gene sequences (Tools see Table 4.3).[36] The two methods described here are focused on the sequence. However, the shape feature of these molecules such as DNA and protein have also been studied and proposed to have an equivalent, if not higher, influence on the behaviors of these molecules.[39]
Target protein structure (3dsm, shown in ribbons), with Calpha backbones (in gray) of 354 predicted models for it submitted in the CASP8 structure-prediction experiment.
The 3D structures of molecules are of major importance to their functions in nature. Since structural prediction of large molecules at an atomic level is a largely intractable problem, some biologists introduced ways to predict 3D structure at a primary sequence level. This includes the biochemical or statistical analysis of amino acid residues in local regions and structural the inference from homologs (or other potentially related proteins) with known 3D structures.[citation needed]
There have been a large number of diverse approaches to solve the structure prediction problem. In order to determine which methods were most effective, a structure prediction competition was founded called CASP (Critical Assessment of Structure Prediction).[40]
Computational approaches and techniques
Sequence analysis tasks are often non-trivial to resolve and require the use of relatively complex approaches, many of which are the backbone behind many existing sequence analysis tools. Of the many methods used in practice, the most popular include the following:[citation needed]
↑ Needleman SB; Wunsch CD (March 1970). "A general method applicable to the search for similarities in the amino acid sequence of two proteins". J. Mol. Biol. 48 (3): 443–53. doi:10.1016/0022-2836(70)90057-4. PMID5420325.
↑ Brown M; Hughey R; Krogh A; Mian IS; Sjölander K; Haussler D (1993). "Using Dirichlet mixture priors to derive hidden Markov models for protein families". Proc Int Conf Intell Syst Mol Biol. 1: 47–55. PMID7584370.
↑ Krogh A; Brown M; Mian IS; Sjölander K; Haussler D (February 1994). "Hidden Markov models in computational biology. Applications to protein modeling". J. Mol. Biol. 235 (5): 1501–31. doi:10.1006/jmbi.1994.1104. PMID8107089. S2CID2160404.
This page is based on this Wikipedia article Text is available under the CC BY-SA 4.0 license; additional terms may apply. Images, videos and audio are available under their respective licenses.