
Bradycardia, also called bradyarrhythmia, is a resting heart rate under 60 beats per minute (BPM). While bradycardia can result from various pathologic processes, it is commonly a physiologic response to cardiovascular conditioning or due to asymptomatic type 1 atrioventricular block.
Electrocardiography is the process of producing an electrocardiogram, a recording of the heart's electrical activity through repeated cardiac cycles. It is an electrogram of the heart which is a graph of voltage versus time of the electrical activity of the heart using electrodes placed on the skin. These electrodes detect the small electrical changes that are a consequence of cardiac muscle depolarization followed by repolarization during each cardiac cycle (heartbeat). Changes in the normal ECG pattern occur in numerous cardiac abnormalities, including:

Tachycardia, also called tachyarrhythmia, is a heart rate that exceeds the normal resting rate. In general, a resting heart rate over 100 beats per minute is accepted as tachycardia in adults. Heart rates above the resting rate may be normal or abnormal.

A premature ventricular contraction (PVC) is a common event where the heartbeat is initiated by Purkinje fibers in the ventricles rather than by the sinoatrial node. PVCs may cause no symptoms or may be perceived as a "skipped beat" or felt as palpitations in the chest. PVCs do not usually pose any danger.

In medicine, a Holter monitor is a type of ambulatory electrocardiography device, a portable device for cardiac monitoring for at least 24 hours.

The cardiac conduction system transmits the signals generated by the sinoatrial node – the heart's pacemaker, to cause the heart muscle to contract, and pump blood through the body's circulatory system. The pacemaking signal travels through the right atrium to the atrioventricular node, along the bundle of His, and through the bundle branches to Purkinje fibers in the walls of the ventricles. The Purkinje fibers transmit the signals more rapidly to stimulate contraction of the ventricles.

Ventricular tachycardia is a cardiovascular disorder in which fast heart rate occurs in the ventricles of the heart. Although a few seconds of VT may not result in permanent problems, longer periods are dangerous; and multiple episodes over a short period of time are referred to as an electrical storm. Short periods may occur without symptoms, or present with lightheadedness, palpitations, shortness of breath, chest pain, and decreased level of consciousness. Ventricular tachycardia may lead to coma and persistent vegetative state due to lack of blood and oxygen to the brain. Ventricular tachycardia may result in ventricular fibrillation (VF) and turn into cardiac arrest. This conversion of the VT into VF is called the degeneration of the VT. It is found initially in about 7% of people in cardiac arrest.
A sinus rhythm is any cardiac rhythm in which depolarisation of the cardiac muscle begins at the sinus node. It is necessary, but not sufficient, for normal electrical activity within the heart. On the electrocardiogram (ECG), a sinus rhythm is characterised by the presence of P waves that are normal in morphology.

AV-nodal reentrant tachycardia (AVNRT) is a type of abnormal fast heart rhythm. It is a type of supraventricular tachycardia (SVT), meaning that it originates from a location within the heart above the bundle of His. AV nodal reentrant tachycardia is the most common regular supraventricular tachycardia. It is more common in women than men. The main symptom is palpitations. Treatment may be with specific physical maneuvers, medications, or, rarely, synchronized cardioversion. Frequent attacks may require radiofrequency ablation, in which the abnormally conducting tissue in the heart is destroyed.

A heart rate monitor (HRM) is a personal monitoring device that allows one to measure/display heart rate in real time or record the heart rate for later study. It is largely used to gather heart rate data while performing various types of physical exercise. Measuring electrical heart information is referred to as electrocardiography.

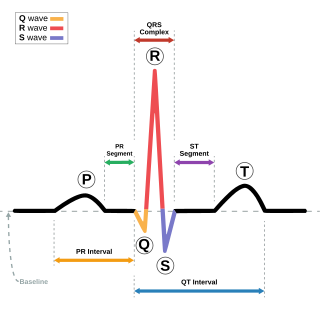
In electrocardiography, the T wave represents the repolarization of the ventricles. The interval from the beginning of the QRS complex to the apex of the T wave is referred to as the absolute refractory period. The last half of the T wave is referred to as the relative refractory period or vulnerable period. The T wave contains more information than the QT interval. The T wave can be described by its symmetry, skewness, slope of ascending and descending limbs, amplitude and subintervals like the Tpeak–Tend interval.
The QRS complex is the combination of three of the graphical deflections seen on a typical electrocardiogram. It is usually the central and most visually obvious part of the tracing. It corresponds to the depolarization of the right and left ventricles of the heart and contraction of the large ventricular muscles.
Premature atrial contraction (PAC), also known as atrial premature complexes (APC) or atrial premature beats (APB), are a common cardiac dysrhythmia characterized by premature heartbeats originating in the atria. While the sinoatrial node typically regulates the heartbeat during normal sinus rhythm, PACs occur when another region of the atria depolarizes before the sinoatrial node and thus triggers a premature heartbeat, in contrast to escape beats, in which the normal sinoatrial node fails, leaving a non-nodal pacemaker to initiate a late beat.

In cardiology, T wave alternans (TWA) is a periodic beat-to-beat variation in the amplitude or shape of the T wave in an electrocardiogram . TWA was first described in 1908. At that time, only large variations could be detected. Those large TWAs were associated with increased susceptibility to lethal ventricular tachycardias.

Left bundle branch block (LBBB) is a conduction abnormality in the heart that can be seen on an electrocardiogram (ECG). In this condition, activation of the left ventricle of the heart is delayed, which causes the left ventricle to contract later than the right ventricle.
Lown–Ganong–Levine syndrome (LGL) is a pre-excitation syndrome of the heart. Those with LGL syndrome have episodes of abnormal heart racing with a short PR interval and normal QRS complexes seen on their electrocardiogram when in a normal sinus rhythm. LGL syndrome was originally thought to be due to an abnormal electrical connection between the atria and the ventricles, but is now thought to be due to accelerated conduction through the atrioventricular node in the majority of cases. The syndrome is named after Bernard Lown, William Francis Ganong, Jr., and Samuel A. Levine.

The electrical axis of the heart is the net direction in which the wave of depolarization travels. It is measured using an electrocardiogram (ECG). Normally, this begins at the sinoatrial node ; from here the wave of depolarisation travels down to the apex of the heart. The hexaxial reference system can be used to visualise the directions in which the depolarisation wave may travel.

Vectorcardiography (VCG) is a method of recording the magnitude and direction of the electrical forces that are generated by the heart by means of a continuous series of vectors that form curving lines around a central point.
In electrocardiography, left axis deviation (LAD) is a condition wherein the mean electrical axis of ventricular contraction of the heart lies in a frontal plane direction between −30° and −90°. This is reflected by a QRS complex positive in lead I and negative in leads aVF and II.
The Pan–Tompkins algorithm is commonly used to detect QRS complexes in electrocardiographic signals (ECG). The QRS complex represents the ventricular depolarization and the main spike visible in an ECG signal. This feature makes it particularly suitable for measuring heart rate, the first way to assess the heart health state. In the first derivation of Einthoven of a physiological heart, the QRS complex is composed by a downward deflection, a high upward deflection and a final downward deflection.
