Related Research Articles
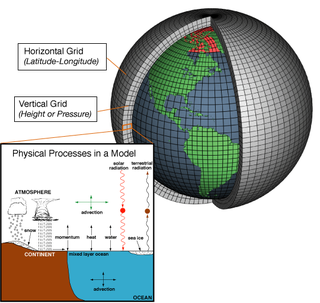
A general circulation model (GCM) is a type of climate model. It employs a mathematical model of the general circulation of a planetary atmosphere or ocean. It uses the Navier–Stokes equations on a rotating sphere with thermodynamic terms for various energy sources. These equations are the basis for computer programs used to simulate the Earth's atmosphere or oceans. Atmospheric and oceanic GCMs are key components along with sea ice and land-surface components.
The World Ocean Database Project, or WOD, is a project established by the Intergovernmental Oceanographic Commission (IOC). The project leader is Sydney Levitus who is director of the International Council for Science (ICSU) World Data Center (WDC) for Oceanography, Silver Spring. In recognition of the success of the IOC Global Oceanographic Data Archaeological and Rescue Project, a proposal was presented at the 16th Session of the Committee on International Oceanographic Data and Information Exchange (IODE), which was held in Lisbon, Portugal, in October–November 2000, to establish the World Ocean Database Project. This project is intended to stimulate international exchange of modern oceanographic data and encourage the development of regional oceanographic databases as well as the implementation of regional quality control procedures. This new Project was endorsed by the IODE at the conclusion of the Portugal meeting, and the IOC subsequently approved this project in June 2001.

Argo is an international program that uses profiling floats to observe temperature, salinity, currents, and, recently, bio-optical properties in the Earth's oceans; it has been operational since the early 2000s. The real-time data it provides is used in climate and oceanographic research. A special research interest is to quantify the ocean heat content (OHC). The Argo fleet consists of almost 4000 drifting "Argo floats" deployed worldwide. Each float weighs 20–30 kg. In most cases probes drift at a depth of 1000 metres and, every 10 days, by changing their buoyancy, dive to a depth of 2000 metres and then move to the sea-surface, measuring conductivity and temperature profiles as well as pressure. From these, salinity and density can be calculated. Seawater density is important in determining large-scale motions in the ocean.
Numerical weather prediction (NWP) uses mathematical models of the atmosphere and oceans to predict the weather based on current weather conditions. Though first attempted in the 1920s, it was not until the advent of computer simulation in the 1950s that numerical weather predictions produced realistic results. A number of global and regional forecast models are run in different countries worldwide, using current weather observations relayed from radiosondes, weather satellites and other observing systems as inputs.
Data assimilation is a mathematical discipline that seeks to optimally combine theory with observations. There may be a number of different goals sought – for example, to determine the optimal state estimate of a system, to determine initial conditions for a numerical forecast model, to interpolate sparse observation data using knowledge of the system being observed, to set numerical parameters based on training a model from observed data. Depending on the goal, different solution methods may be used. Data assimilation is distinguished from other forms of machine learning, image analysis, and statistical methods in that it utilizes a dynamical model of the system being analyzed.

In atmospheric science, an atmospheric model is a mathematical model constructed around the full set of primitive, dynamical equations which govern atmospheric motions. It can supplement these equations with parameterizations for turbulent diffusion, radiation, moist processes, heat exchange, soil, vegetation, surface water, the kinematic effects of terrain, and convection. Most atmospheric models are numerical, i.e. they discretize equations of motion. They can predict microscale phenomena such as tornadoes and boundary layer eddies, sub-microscale turbulent flow over buildings, as well as synoptic and global flows. The horizontal domain of a model is either global, covering the entire Earth, or regional (limited-area), covering only part of the Earth. The different types of models run are thermotropic, barotropic, hydrostatic, and nonhydrostatic. Some of the model types make assumptions about the atmosphere which lengthens the time steps used and increases computational speed.

The bathythermograph, or BT, also known as the Mechanical Bathythermograph, or MBT; is a device that holds a temperature sensor and a transducer to detect changes in water temperature versus depth down to a depth of approximately 285 meters. Lowered by a small winch on the ship into the water, the BT records pressure and temperature changes on a coated glass slide as it is dropped nearly freely through the water. While the instrument is being dropped, the wire is paid out until it reaches a predetermined depth, then a brake is applied and the BT is drawn back to the surface. Because the pressure is a function of depth, temperature measurements can be correlated with the depth at which they are recorded.
TAMDAR is a weather monitoring system that consists of an in situ atmospheric sensor mounted on commercial aircraft for data gathering. It collects information similar to that collected by radiosondes carried aloft by weather balloons. It was developed by AirDat LLC, which was acquired by Panasonic Avionics Corporation in April 2013 and was operated until October 2018 under the name Panasonic Weather Solutions. It is now owned by FLYHT Aerospace Solutions Ltd.
The World Ocean Atlas (WOA) is a data product of the Ocean Climate Laboratory of the National Oceanographic Data Center (U.S.). The WOA consists of a climatology of fields of in situ ocean properties for the World Ocean. It was first produced in 1994, with later editions at roughly four year intervals in 1998, 2001, 2005, 2009, 2013, 2018, and 2023.
The Global Environmental Multiscale Model (GEM), often known as the CMC model in North America, is an integrated forecasting and data assimilation system developed in the Recherche en Prévision Numérique (RPN), Meteorological Research Branch (MRB), and the Canadian Meteorological Centre (CMC). Along with the NWS's Global Forecast System (GFS), which runs out to 16 days, the ECMWF's Integrated Forecast System (IFS), which runs out 10 days, the Naval Research Laboratory Navy Global Environmental Model (NAVGEM), which runs out eight days, the UK Met Office's Unified Model, which runs out to seven days, and Deutscher Wetterdienst's ICON, which runs out to 7.5 days, it is one of the global medium-range models in general use.
The Princeton Ocean Model (POM) is a community general numerical model for ocean circulation that can be used to simulate and predict oceanic currents, temperatures, salinities and other water properties.
The Unified Model is a numerical weather prediction and climate modeling software suite originally developed by the United Kingdom Met Office, and now both used and further developed by many weather-forecasting agencies around the world. The Unified Model gets its name because a single model is used across a range of both timescales and spatial scales. The models are grid-point based, rather than wave based, and are run on a variety of supercomputers around the world. The Unified Model atmosphere can be coupled to a number of ocean models. At the Met Office it is used for the main suite of Global Model, North Atlantic and Europe model (NAE) and a high-resolution UK model (UKV), in addition to a variety of Crisis Area Models and other models that can be run on demand. Similar Unified Model suites with global and regional domains are used by many other national or military weather agencies around the world for operational forecasting.
Ocean reanalysis is a method of combining historical ocean observations with a general ocean model driven by historical estimates of surface winds, heat, and freshwater, by way of a data assimilation algorithm to reconstruct historical changes in the state of the ocean.
An atmospheric reanalysis is a meteorological and climate data assimilation project which aims to assimilate historical atmospheric observational data spanning an extended period, using a single consistent assimilation scheme throughout.

The West Spitsbergen Current (WSC) is a warm, salty current that runs poleward just west of Spitsbergen,, in the Arctic Ocean. The WSC branches off the Norwegian Atlantic Current in the Norwegian Sea. The WSC is of importance because it drives warm and salty Atlantic Water into the interior Arctic. The warm and salty WSC flows north through the eastern side of Fram Strait, while the East Greenland Current (EGC) flows south through the western side of Fram Strait. The EGC is characterized by being very cold and low in salinity, but above all else it is a major exporter of Arctic sea ice. Thus, the EGC combined with the warm WSC makes the Fram Strait the northernmost ocean area having ice-free conditions throughout the year in all of the global ocean.

For information about the CTD-rosette equipment package as a whole, see: Rosette sampler

CORA is a global oceanographic temperature and salinity dataset produced and maintained by the French institute IFREMER. Most of those data are real-time data coming from different types of platforms such as research vessels, profilers, underwater gliders, drifting buoys, moored buoys, sea mammals and ships of opportunity.
Regional Ocean Modeling System (ROMS) is a free-surface, terrain-following, primitive equations ocean model widely used by the scientific community for a diverse range of applications. The model is developed and supported by researchers at the Rutgers University, University of California Los Angeles and contributors worldwide.
Ocean general circulation models (OGCMs) are a particular kind of general circulation model to describe physical and thermodynamical processes in oceans. The oceanic general circulation is defined as the horizontal space scale and time scale larger than mesoscale. They depict oceans using a three-dimensional grid that include active thermodynamics and hence are most directly applicable to climate studies. They are the most advanced tools currently available for simulating the response of the global ocean system to increasing greenhouse gas concentrations. A hierarchy of OGCMs have been developed that include varying degrees of spatial coverage, resolution, geographical realism, process detail, etc.

The Global Drifter Program (GDP) was conceived by Prof. Peter Niiler, with the objective of collecting measurements of surface ocean currents, sea surface temperature and sea-level atmospheric pressure using drifters. It is the principal component of the Global Surface Drifting Buoy Array, a branch of NOAA's Global Ocean Observations and a scientific project of the Data Buoy Cooperation Panel (DBCP). The project originated in February 1979 as part of the TOGA/Equatorial Pacific Ocean Circulation Experiment (EPOCS) and the first large-scale deployment of drifters was in 1988 with the goal of mapping the tropical Pacific Ocean's surface circulation. The current goal of the project is to use 1250 satellite-tracked surface drifting buoys to make accurate and globally dense in-situ observations of mixed layer currents, sea surface temperature, atmospheric pressure, winds and salinity, and to create a system to process the data. Horizontal transports in the oceanic mixed layer measured by the GDP are relevant to biological and chemical processes as well as physical ones.
References
- ↑ Carton, J.A., G. Chepurin, X. Cao, B. Giese, 2000: A Simple Ocean Data Assimilation Analysis of the Global Upper Ocean 1950–95. Part I: Methodology. J. Phys. Oceanogr. , 30, 294–309.
- 1 2 3 Carton, J.A. and B. Giese, 2008: A Reanalysis of Ocean Climate Using Simple Ocean Data Assimilation (SODA). Mon. Weath. Rev. , 136, 2999-3017.
- ↑ Carton, J.A. and B. Giese, 2005: SODA: A Reanalysis of Ocean Climate. [online] Available at: <http://www.atmos.umd.edu/~carton/pdfs/carton&giese05.pdf> [Accessed 26 November 2012].
- ↑ IRI Data Library, 2012. Carton-Giese SODA SODA 2.2.4, 1871-2008 Assimilation Run. [online] Available at: <http://iridl.ldeo.columbia.edu/SOURCES/.CARTON-GIESE/.SODA/.v2p2p4/> [Accessed 26 November 2012].