South Jutland (Folketing constituency)

Last updated

South Jutland
Sydjylland
Constituency
for the Folketing
South Jutland (Folketing constituency).svg
Location of South Jutland within Denmark
Municipality
Region Southern Denmark
Population731,811 (2022) [1]
Electorate526,547 (2022)
Area8,785 km2 (2022) [2]
Current constituency
Created2007
Seats
List
  • 17 (2022–present)
  • 18 (2007–2022)
Members of the Folketing [3]
List
Created from

South Jutland (Danish : Sydjylland) is one of the 12 multi-member constituencies of the Folketing, the national legislature of Denmark. The constituency was established in 2007 following the public administration structural reform. It consists of the municipalities of Aabenraa, Billund, Esbjerg, Fanø, Fredericia, Haderslev, Kolding, Sønderborg, Tønder, Varde, Vejen and Vejle. The constituency currently elects 17 of the 179 members of the Folketing using the open party-list proportional representation electoral system. At the 2022 general election it had 526,547 registered electors.

Contents

Electoral system

South Jutland currently elects 17 of the 179 members of the Folketing using the open party-list proportional representation electoral system. [4] [5] Constituency seats are allocated using the D'Hondt method. [6] [7] Compensatory seats are calculated based on the national vote and are allocated using the Sainte-Laguë method, initially at the provincial level and finally at the constituency level. [8] [9] Only parties that reach any one of three thresholds stipulated by section 77 of the Folketing (Parliamentary) Elections Act - winning at least one constituency seat; obtaining at least the Hare quota (valid votes in province/number of constituency seats in province) in two of the three provinces; or obtaining at least 2% of the national vote - compete for compensatory seats. [10] [11]

Election results

Summary

Election Red–Green
Ø
Green Left
F
Alternative
Å
Social Democrats
A
Social Liberals
B
Venstre
V
Conservative People's
C
Liberal Alliance
I / Y
Danish People's
O
Votes %SeatsVotes %SeatsVotes %SeatsVotes %SeatsVotes %SeatsVotes %SeatsVotes %SeatsVotes %SeatsVotes %Seats
2022 10,3162.40%024,8705.78%16,1381.43%0122,00128.38%69,9722.32%070,74016.45%320,7264.82%132,5807.58%112,1092.82%0
2019 17,7734.09%022,4695.17%17,1721.65%0113,64126.13%625,5515.87%1124,00728.51%622,0495.07%19,3102.14%054,25812.48%3
2015 22,6145.09%113,5083.04%011,5512.60%0104,39123.50%513,9623.14%0104,48323.52%59,6252.17%033,2777.49%1126,05828.37%6
2011 17,2663.83%034,7177.70%1108,93724.15%529,7426.59%1149,14833.06%717,9053.97%021,9124.86%166,66614.78%3
2007 3,6260.82%050,48411.37%2101,55722.86%515,2013.42%0153,68834.60%737,0558.34%18,4811.91%069,76215.71%3

(Excludes compensatory seats)

Detailed

2022

Results of the 2022 general election held on 1 November 2022: [12] [13] [14] [15] [16]

PartyVotes per nomination districtTotal
Votes
%Seats
Aaben
-raa
Greater Esbjerg Esbjerg City Frede
-ricia
Hader
-slev
Kolding North Kolding South Sønder
-borg
Tønder Varde Vejen Vejle
North
Vejle
South
Con. Com. Tot.
Social Democrats A9,6959,50512,46510,31710,0166,3837,93114,5485,6017,27610,2948,2489,722122,00128.38%606
Venstre V5,3575,8644,5183,4385,4884,0124,2696,6073,2776,9658,5476,4305,96870,74016.45%303
Denmark Democrats Æ4,7753,8753,1552,8773,7372,2653,0334,9183,1904,2725,5833,6343,14048,45411.27%213
Moderates M2,7363,2532,9793,1112,7222,8612,8343,6602,7012,5223,4093,6653,61240,0659.32%202
Liberal Alliance I2,2342,7822,9462,4172,0752,5922,6322,7981,1942,0352,9652,8693,04132,5807.58%112
The New Right D2,6652,1101,9191,6382,5041,3261,7633,0391,6811,9472,9801,5661,64126,7796.23%101
Green Left F1,4541,9932,7392,0501,6141,9142,1832,0231,0741,1881,6932,3262,61924,8705.78%101
Conservative People's Party C1,5581,5651,9271,4431,4081,4681,5611,6369831,5701,8262,0031,77820,7264.82%101
Danish People's Party O1,1588711,1018811,1687049151,2666417681,18769075912,1092.82%011
Red–Green Alliance Ø6186481,4061,0108097587529673354426078231,14110,3162.40%011
Danish Social Liberal Party B6616939396525798809029322774616631,1531,1809,9722.32%011
The Alternative Å3593926195464724894755371782883966597286,1381.43%000
Christian Democrats K2201921881973191242522101922772983152553,0390.71%000
Independent Greens Q8250241108114256852062640492802471,7840.41%000
Kent Nielsen (Independent)261046231619132420123321282910.07%000
Kenneth Vestergaard (Independent)103424315221732580.01%000
Valid Votes33,60833,80637,19230,71033,04526,05429,60143,37621,37230,06540,54734,68535,861429,922100.00%17522
Blank Votes4914696034965653484336683174275714834996,3701.45%
Rejected Votes – Other1251351531021721071002151011221571241611,7740.40%
Total Polled34,22434,41037,94831,30833,78226,50930,13444,25921,79030,61441,27535,29236,521438,06683.20%
Registered Electors41,58740,31747,77738,50240,65731,69335,95253,71226,55935,99949,00240,47844,312526,547
Turnout82.29%85.35%79.43%81.32%83.09%83.64%83.82%82.40%82.04%85.04%84.23%87.19%82.42%83.20%

Votes per municipality:< [17]

PartyVotes per municipalityTotal
Votes
Aaben
-raa
Bil
-lund
Esbjerg Fanø Frede
-ricia
Hader
-slev
Kolding Sønder
-borg
Tønder Varde Vejen Vejle
Social Democrats A9,6953,96121,27369710,31710,01614,31414,5485,6017,2766,33317,970122,001
Venstre V5,3573,59310,1762063,4385,4888,2816,6073,2776,9654,95412,39870,740
Denmark Democrats Æ4,7752,2946,8321982,8773,7375,2984,9183,1904,2723,2896,77448,454
Moderates M2,7361,3216,0122203,1112,7225,6953,6602,7012,5222,0887,27740,065
Liberal Alliance I2,2341,0365,5871412,4172,0755,2242,7981,1942,0351,9295,91032,580
The New Right D2,6659343,948811,6382,5043,0893,0391,6811,9472,0463,20726,779
Green Left F1,4544894,5132192,0501,6144,0972,0231,0741,1881,2044,94524,870
Conservative People's Party C1,5585873,3081841,4431,4083,0291,6369831,5701,2393,78120,726
Danish People's Party O1,1584191,936368811,1681,6191,2666417687681,44912,109
Red–Green Alliance Ø6182031,8971571,0108091,5109673354424041,96410,316
Danish Social Liberal Party B6612541,552806525791,7829322774614092,3339,972
The Alternative Å3591358881235464729645371782882611,3876,138
Christian Democrats K22014237191973193762101922771565703,039
Independent Greens Q822129011081143412062640285271,784
Kent Nielsen (Independent)26115242316322420122249291
Kenneth Vestergaard (Independent)1027024452215558
Valid Votes33,60815,40268,6422,35630,71033,04555,65543,37621,37230,06525,14570,546429,922
Blank Votes4911931,041314965657816683174273789826,370
Rejected Votes – Other1256427711102172207215101122932851,774
Total Polled34,22415,65969,9602,39831,30833,78256,64344,25921,79030,61425,61671,813438,066
Registered Electors41,58718,65285,4402,65438,50240,65767,64553,71226,55935,99930,35084,790526,547
Turnout82.29%83.95%81.88%90.35%81.32%83.09%83.74%82.40%82.04%85.04%84.40%84.70%83.20%

The following candidates were elected: [18] [19]

2019

Results of the 2019 general election held on 5 June 2019: [20] [21] [22] [23]

PartyVotes per nomination districtTotal
Votes
%Seats
Aaben
-raa
Greater Esbjerg Esbjerg City Frede
-ricia
Hader
-slev
Kolding North Kolding South Sønder
-borg
Tønder Varde Vejen Vejle
North
Vejle
South
Con. Com. Tot.
Venstre V10,66610,2858,3606,6759,6117,4917,94112,5217,31810,68413,6149,5599,282124,00728.51%606
Social Democrats A8,8588,91311,7859,4329,3575,8107,16913,4705,4136,81310,3567,2639,002113,64126.13%606
Danish People's Party O5,0763,9584,1733,8914,2132,6163,5905,5112,8894,0505,6104,5504,13154,25812.48%303
Danish Social Liberal Party B1,6551,6472,2831,7851,6602,3541,9272,5727991,3731,8002,8642,83225,5515.87%101
Socialist People's Party F1,4491,7682,3591,7621,6141,6461,9681,8971,2011,1981,5111,9232,17322,4695.17%101
Conservative People's Party C1,4031,8251,7921,7741,5341,7851,6392,0499721,3431,9012,0611,97122,0495.07%101
The New Right D1,5931,3751,4571,1051,7869901,2942,1519991,1911,8179411,12617,8254.10%011
Red–Green Alliance Ø1,0921,3642,6631,6911,4951,2221,1811,4406668881,1971,2681,60617,7734.09%011
Christian Democrats K6785855695568524517895746549041,0091,0348419,4962.18%000
Liberal Alliance I5257117946176277128337393767898278199419,3102.14%011
Hard Line P6955748265956634115249184245706534715457,8691.81%000
The Alternative Å4015437795884955826206712453804736787177,1721.65%000
Klaus Riskær Pedersen E2262643073022401952102811382452792462823,2150.74%000
Michael Thomsen (Independent)201717172416148411162023102890.07%000
Valid Votes34,33733,82938,16430,79034,17126,28129,69944,87822,10530,44441,06733,70035,459434,924100.00%18321
Blank Votes2902963873303552062244202362863582723534,0130.91%
Rejected Votes – Other10191139116112888016810367115651231,3680.31%
Total Polled34,72834,21638,69031,23634,63826,57530,00345,46622,44430,79741,54034,03735,935440,30583.37%
Registered Electors42,39548,24740,28138,03041,54131,46935,52854,72427,69036,58949,56739,03843,009528,108
Turnout81.92%70.92%96.05%82.14%83.38%84.45%84.45%83.08%81.05%84.17%83.81%87.19%83.55%83.37%

Votes per municipality: [24]

PartyVotes per municipalityTotal
Votes
Aaben
-raa
Bil
-lund
Esbjerg Fanø Frede
-ricia
Hader
-slev
Kolding Sønder
-borg
Tønder Varde Vejen Vejle
Venstre V10,6665,56518,1335126,6759,61115,43212,5217,31810,6848,04918,841124,007
Social Democrats A8,8583,68820,1235759,4329,35712,97913,4705,4136,8136,66816,266113,642
Danish People's Party O5,0762,3287,9302013,8914,2136,2065,5112,8894,0503,2828,68154,258
Danish Social Liberal Party B1,6557573,7581721,7851,6604,2812,5727991,3731,0435,69625,551
Socialist People's Party F1,4494823,9381891,7621,6143,6141,8971,2011,1981,0294,09622,469
Conservative People's Party C1,4036033,4311861,7741,5343,4242,0499721,3431,2984,03222,049
The New Right D1,5934982,797351,1051,7862,2842,1519991,1911,3192,06717,825
Red–Green Alliance Ø1,0923723,7862411,6911,4952,4031,4406668888252,87417,773
Christian Democrats K6785351,129255568521,2405746549044741,8759,496
Liberal Alliance I5252901,471346176271,5457393767895371,7609,310
Hard Line P6952281,380205956639359184245704251,0167,869
The Alternative Å4011671,229935884951,2026712453803061,3957,172
Klaus Riskær Pedersen E22698543283022404052811382451815283,215
Michael Thomsen (Independent)2083401724308211161233287
Valid Votes34,33715,61969,6822,31130,79034,17155,98044,87622,10530,44425,44869,160434,923
Blank Votes290145666173303554304202362862136244,012
Rejected Votes – Other10140226411611216817010367751881,370
Total Polled34,72815,80470,5742,33231,23634,63856,57845,46622,44430,79725,73669,972440,305
Registered Electors42,39518,87685,8932,63538,03041,54166,99754,72427,69036,58930,69182,047528,108
Turnout81.92%83.73%82.17%88.50%82.14%83.38%84.45%83.08%81.05%84.17%83.86%85.28%83.37%

The following candidates were elected: [25] [26]

2015

Results of the 2015 general election held on 18 June 2015: [27] [28] [29] [30]

PartyVotes per nomination districtTotal
Votes
%Seats
Aaben
-raa
Greater Esbjerg Esbjerg City Frede
-ricia
Hader
-slev
Kolding North Kolding South Sønder
-borg
Tønder Varde Vejen Vejle
North
Vejle
South
Con. Com. Tot.
Danish People's Party O11,3929,02710,2519,31210,0306,1848,17714,1246,9588,99612,8629,5799,166126,05828.37%606
Venstre V8,7738,9607,1585,4718,4656,1066,2119,9946,31310,32712,1437,4837,079104,48323.52%505
Social Democrats A7,8578,00910,9988,7558,6215,9266,73411,7285,0385,9079,0957,1528,571104,39123.50%505
Liberal Alliance I2,5032,5112,6032,0772,4942,5712,4423,3571,7272,1033,0652,7213,10333,2777.49%112
Red–Green Alliance Ø1,6081,8453,5601,9111,7831,3721,3541,9811,0871,1531,5501,5041,90622,6145.09%101
Danish Social Liberal Party B1,1758931,1077899791,0419761,9836147539131,2881,45113,9623.14%011
Socialist People's Party F8231,1341,4571,0579201,1491,2161,1295607211,0291,0251,28813,5083.04%000
The Alternative Å7008531,0619658858118981,0424886087941,1961,25011,5512.60%000
Conservative People's Party C6397877016397888141,0038184785108968117419,6252.17%000
Christian Democrats K3542952872565021743952403974675064854344,7921.08%000
Valid Votes35,82434,31439,18331,23235,46726,14829,40646,39623,66031,54542,85333,24434,989444,261100.00%18220
Blank Votes2742684142993332172414222002753262683213,8580.86%
Rejected Votes – Other13410516483127861161871031091151061321,5670.35%
Total Polled36,23234,68739,76131,61435,92726,45129,76347,00523,96331,92943,29433,61835,442449,68685.56%
Registered Electors42,57239,99348,40037,39541,76431,08034,62554,93028,31036,75049,88237,97041,938525,609
Turnout85.11%86.73%82.15%84.54%86.02%85.11%85.96%85.57%84.65%86.88%86.79%88.54%84.51%85.56%

Votes per municipality: [24]

PartyVotes per municipalityTotal
Votes
Aaben
-raa
Bil
-lund
Esbjerg Fanø Frede
-ricia
Hader
-slev
Kolding Sønder
-borg
Tønder Varde Vejen Vejle
Danish People's Party O11,3925,30618,8304489,31210,03014,36114,1246,9588,9967,55618,745126,058
Venstre V8,7734,70415,6934255,4718,46512,3179,9946,31310,3277,43914,562104,483
Social Democrats A7,8573,17218,3996088,7558,62112,66011,7285,0385,9075,92315,723104,391
Liberal Alliance I2,5031,1044,9751392,0772,4945,0133,3571,7272,1031,9615,82433,277
Red–Green Alliance Ø1,6085225,1752301,9111,7832,7261,9811,0871,1531,0283,41022,614
Danish Social Liberal Party B1,1753651,929717899792,0171,9836147535482,73913,962
Socialist People's Party F8233562,4751161,0579202,3651,1295607216732,31313,508
The Alternative Å7002821,7911239658851,7091,0424886085122,44611,551
Conservative People's Party C6392771,411776397881,8178184785106191,5529,625
Christian Democrats K35428757572565025692403974672199194,792
Valid Votes35,82416,37571,2532,24431,23235,46755,55446,39623,66031,54526,47868,233444,261
Blank Votes274100657252993334584222002752265893,858
Rejected Votes – Other13440265483127202187103109752381,567
Total Polled36,23216,51572,1752,27331,61435,92756,21447,00523,96331,92926,77969,060449,686
Registered Electors42,57219,04785,8582,53537,39541,76465,70554,93028,31036,75030,83579,908525,609
Turnout85.11%86.71%84.06%89.66%84.54%86.02%85.56%85.57%84.65%86.88%86.85%86.42%85.56%

The following candidates were elected: [31] [32]

2011

Results of the 2011 general election held on 15 September 2011: [33] [34] [35] [36]

PartyVotes per nomination districtTotal
Votes
%Seats
Aaben
-raa
Greater Esbjerg Esbjerg City Frede
-ricia
Hader
-slev
Kolding North Kolding South Sønder
-borg
Tønder Varde Vejen Vejle
North
Vejle
South
Con. Com. Tot.
Venstre V13,14412,95210,7978,57011,9738,7068,79714,7708,94813,63016,86210,3109,689149,14833.06%707
Social Democrats A9,0888,05911,9949,7538,6525,4826,37313,0175,9675,9859,4876,6688,412108,93724.15%505
Danish People's Party O5,7114,4985,3564,8584,9493,4584,5517,3293,3744,5256,6425,8465,56966,66614.78%314
Socialist People's Party F2,1882,6234,0382,5303,0042,5032,9623,3741,6911,8712,5872,4162,93034,7177.70%112
Danish Social Liberal Party B2,0922,3082,4621,9782,2062,1902,1992,7901,3131,9372,4252,9822,86029,7426.59%112
Liberal Alliance I1,5381,6991,5191,3951,8101,6761,6152,0771,1621,4302,1971,7632,03121,9124.86%101
Conservative People's Party C1,2591,1341,1391,2421,3401,3701,6372,4168879611,5591,4811,48017,9053.97%011
Red–Green Alliance Ø1,1421,3492,6191,4361,3971,1631,2001,4677088781,0981,1661,64317,2663.83%011
Christian Democrats K3672592772814801903582514465515203603744,7141.04%000
Jørn Bjorholm (Independent)7665103101242774830.02%000
Niels-Aage Bjerre (Independent)441355336611632710.02%000
Valid Votes36,54034,89140,22032,05335,82626,74429,70547,50924,50631,77143,40033,00234,994451,161100.00%18523
Blank Votes2632082872122731481803372112263232052663,1390.69%
Rejected Votes – Other137126156861097284182981011231141261,5140.33%
Total Polled36,94035,22540,66332,35136,20826,96429,96948,02824,81532,09843,84633,32135,386455,81487.07%
Registered Electors43,04739,69847,94337,13941,62130,64834,27855,47429,04636,60350,07136,99640,936523,500
Turnout85.81%88.73%84.82%87.11%86.99%87.98%87.43%86.58%85.43%87.69%87.57%90.07%86.44%87.07%

Votes per municipality: [24]

PartyVotes per municipalityTotal
Votes
Aaben
-raa
Bil
-lund
Esbjerg Fanø Frede
-ricia
Hader
-slev
Kolding Sønder
-borg
Tønder Varde Vejen Vejle
Venstre V13,1446,74623,0836668,57011,97317,50314,7708,94813,63010,11619,999149,148
Social Democrats A9,0883,34619,5884659,7538,65211,85513,0175,9675,9856,14115,080108,937
Danish People's Party O5,7112,8469,5622924,8584,9498,0097,3293,3744,5253,79611,41566,666
Socialist People's Party F2,1888296,4242372,5303,0045,4653,3741,6911,8711,7585,34634,717
Danish Social Liberal Party B2,0928544,5791911,9782,2064,3892,7901,3131,9371,5715,84229,742
Liberal Alliance I1,5387413,1091091,3951,8103,2912,0771,1621,4301,4563,79421,912
Conservative People's Party C1,2595242,179941,2421,3403,0072,4168879611,0352,96117,905
Red–Green Alliance Ø1,1423863,7961721,4361,3972,3631,4677088787122,80917,266
Christian Democrats K36731752882814805482514465512037344,714
Jørn Bjorholm (Independent)7512051013124221183
Niels-Aage Bjerre (Independent)4314355666113571
Valid Votes36,54016,59772,8742,23732,05335,82656,44947,50924,50631,77126,80367,996451,161
Blank Votes263112479162122733283372112262114713,139
Rejected Votes – Other1375027488610915618298101732401,514
Total Polled36,94016,75973,6272,26132,35136,20856,93348,02824,81532,09827,08768,707455,814
Registered Electors43,04719,08285,1552,48637,13941,62164,92655,47429,04636,60330,98977,932523,500
Turnout85.81%87.83%86.46%90.95%87.11%86.99%87.69%86.58%85.43%87.69%87.41%88.16%87.07%

The following candidates were elected: [37] [38]

2007

Results of the 2007 general election held on 13 November 2007: [39] [40] [41] [42] [43]

PartyVotes per nomination districtTotal
Votes
%Seats
Aaben
-raa
Greater Esbjerg Esbjerg City Frede
-ricia
Hader
-slev
Kolding North Kolding South Sønder
-borg
Tønder Varde Vejen Vejle
North
Vejle
South
Con. Com. Tot.
Venstre V13,63712,83210,3228,35012,7988,3278,63716,1289,73314,40517,31011,2929,917153,68834.60%718
Social Democrats A8,3957,91912,2418,2348,3194,8385,76912,3535,4435,7658,6476,0277,607101,55722.86%505
Danish People's Party O6,2824,6816,1365,0825,6543,5824,5598,7463,7994,4106,5534,9705,30869,76215.71%314
Socialist People's Party F3,1013,6525,7804,2914,0444,1154,6474,5722,1962,4013,6583,5014,52650,48411.37%213
Conservative People's Party C3,0372,5832,6372,8682,5682,9313,1423,4421,9132,2613,3533,1533,16737,0558.34%112
Danish Social Liberal Party B1,0811,1691,1149611,0251,1551,1121,4647361,1061,3241,4861,46815,2013.42%011
New Alliance Y5945426916146796195498703884827957988608,4811.91%011
Christian Democrats K3072262742794182073052503324215013884174,3250.97%000
Unity List Ø2362695052722512342503471661712163263833,6260.82%000
Valid Votes36,67033,87339,70030,95135,75626,00828,97048,17224,70631,42242,35731,94133,653444,179100.00%18624
Blank Votes162199202147190961162421421612601451552,2170.50%
Rejected Votes – Other117991248910463661387157116861311,2610.28%
Total Polled36,94934,17140,02631,18736,05026,16729,15248,55224,91931,64042,73332,17233,939447,65785.90%
Registered Electors43,22438,92947,93236,79841,89430,24833,92056,02029,59836,39049,73536,37140,078521,137
Turnout85.48%87.78%83.51%84.75%86.05%86.51%85.94%86.67%84.19%86.95%85.92%88.46%84.68%85.90%

Votes per municipality: [24]

PartyVotes per municipalityTotal
Votes
Aaben
-raa
Bil
-lund
Esbjerg Fanø Frede
-ricia
Hader
-slev
Kolding Sønder
-borg
Tønder Varde Vejen Vejle
Venstre V13,6376,91622,5376178,35012,79816,96416,1289,73314,40510,39421,209153,688
Social Democrats A8,3953,01319,6455158,2348,31910,60712,3535,4435,7655,63413,634101,557
Danish People's Party O6,2822,63010,5073105,0825,6548,1418,7463,7994,4103,92310,27869,762
Socialist People's Party F3,1011,2659,0553774,2914,0448,7624,5722,1962,4012,3938,02750,484
Conservative People's Party C3,0371,2525,0351852,8682,5686,0733,4421,9132,2612,1016,32037,055
Danish Social Liberal Party B1,0814742,191929611,0252,2671,4647361,1068502,95415,201
New Alliance Y5943021,175586146791,1688703884824931,6588,481
Christian Democrats K307307487132794185122503324211948054,325
Unity List Ø23679728462722514843471661711377093,626
Valid Votes36,67016,23871,3602,21330,95135,75654,97848,17224,70631,42226,11965,594444,179
Blank Votes16283385161471902122421421611773002,217
Rejected Votes – Other117522167891041291387157642171,261
Total Polled36,94916,37371,9612,23631,18736,05055,31948,55224,91931,64026,36066,111447,657
Registered Electors43,22419,00384,3962,46536,79841,89464,16856,02029,59836,39030,73276,449521,137
Turnout85.48%86.16%85.27%90.71%84.75%86.05%86.21%86.67%84.19%86.95%85.77%86.48%85.90%

The following candidates were elected: [44] [45]

Related Research Articles

<span class="mw-page-title-main">Copenhagen (Folketing constituency)</span> Constituency of the Folketing, the national legislature of Denmark

Copenhagen is one of the 12 multi-member constituencies of the Folketing, the national legislature of Denmark. The constituency was established in 2007 following the public administration structural reform. It consists of the municipalities of Copenhagen, Dragør, Frederiksberg and Tårnby. The constituency currently elects 17 of the 179 members of the Folketing using the open party-list proportional representation electoral system. At the 2022 general election it had 549,748 registered electors.

<span class="mw-page-title-main">Greater Copenhagen (Folketing constituency)</span> Constituency of the Folketing, the national legislature of Denmark

Greater Copenhagen is one of the 12 multi-member constituencies of the Folketing, the national legislature of Denmark. The constituency was established in 2007 following the public administration structural reform. It consists of the municipalities of Albertslund, Ballerup, Brøndby, Gentofte, Gladsaxe, Glostrup, Herlev, Høje-Taastrup, Hvidovre, Ishøj, Lyngby-Taarbæk, Rødovre and Vallensbæk. The constituency currently elects 11 of the 179 members of the Folketing using the open party-list proportional representation electoral system. At the 2022 general election it had 371,085 registered electors.

<span class="mw-page-title-main">North Zealand (Folketing constituency)</span> Constituency of the Folketing, the national legislature of Denmark

North Zealand is one of the 12 multi-member constituencies of the Folketing, the national legislature of Denmark. The constituency was established in 2007 following the public administration structural reform. It consists of the municipalities of Allerød, Egedal, Fredensborg, Frederikssund, Furesø, Gribskov, Halsnæs, Helsingør, Hillerød, Hørsholm and Rudersdal. The constituency currently elects 10 of the 179 members of the Folketing using the open party-list proportional representation electoral system. At the 2022 general election it had 341,544 registered electors.

<span class="mw-page-title-main">Zealand (Folketing constituency)</span> Constituency of the Folketing, the national legislature of Denmark

Zealand is one of the 12 multi-member constituencies of the Folketing, the national legislature of Denmark. The constituency was established in 2007 following the public administration structural reform. It consists of the municipalities of Faxe, Greve, Guldborgsund, Holbæk, Kalundborg, Køge, Lejre, Lolland, Næstved, Odsherred, Ringsted, Roskilde, Slagelse, Solrød, Sorø, Stevns and Vordingborg. The constituency currently elects 20 of the 179 members of the Folketing using the open party-list proportional representation electoral system. At the 2022 general election it had 634,513 registered electors.

<span class="mw-page-title-main">Funen (Folketing constituency)</span> Constituency of the Folketing, the national legislature of Denmark

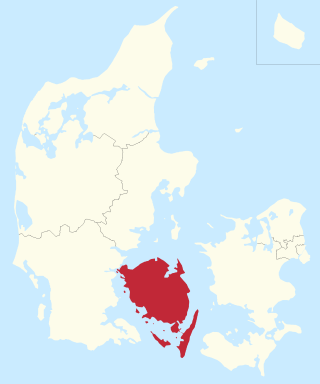
Funen is one of the 12 multi-member constituencies of the Folketing, the national legislature of Denmark. The constituency was established in 2007 following the public administration structural reform. It consists of the municipalities of Ærø, Assens, Faaborg-Midtfyn, Kerteminde, Langeland, Middelfart, Nordfyn, Nyborg, Odense and Svendborg. The constituency currently elects 12 of the 179 members of the Folketing using the open party-list proportional representation electoral system. At the 2022 general election it had 378,832 registered electors.

<span class="mw-page-title-main">East Jutland (Folketing constituency)</span> Constituency of the Folketing, the national legislature of Denmark

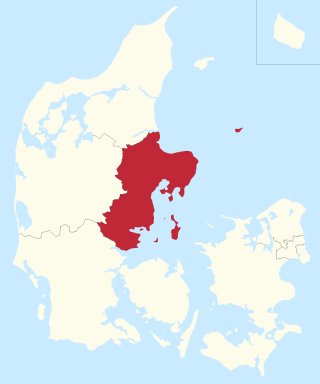
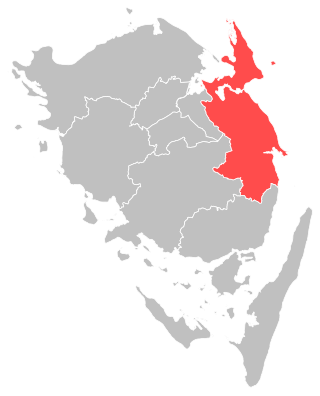
East Jutland is one of the 12 multi-member constituencies of the Folketing, the national legislature of Denmark. The constituency was established in 2007 following the public administration structural reform. It consists of the municipalities of Aarhus, Favrskov, Hedensted, Horsens, Norddjurs, Odder, Randers, Samsø, Skanderborg and Syddjurs. The constituency currently elects 18 of the 179 members of the Folketing using the open party-list proportional representation electoral system. At the 2022 general election it had 602,870 registered electors.

<span class="mw-page-title-main">West Jutland (Folketing constituency)</span> Constituency of the Folketing, the national legislature of Denmark

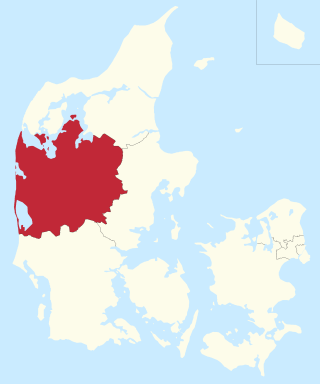
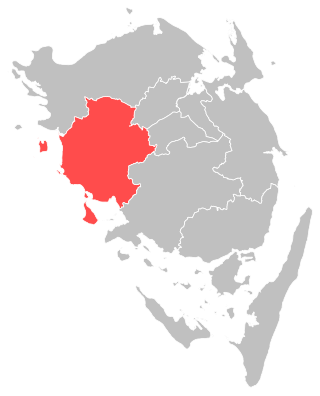
West Jutland is one of the 12 multi-member constituencies of the Folketing, the national legislature of Denmark. The constituency was established in 2007 following the public administration structural reform. It consists of the municipalities of Herning, Holstebro, Ikast-Brande, Lemvig, Ringkøbing-Skjern, Silkeborg, Skive, Struer and Viborg. The constituency currently elects 13 of the 179 members of the Folketing using the open party-list proportional representation electoral system. At the 2022 general election it had 385,528 registered electors.

<span class="mw-page-title-main">North Jutland (Folketing constituency)</span> Constituency of the Folketing, the national legislature of Denmark

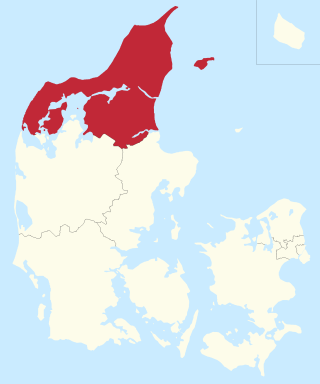
North Jutland is one of the 12 multi-member constituencies of the Folketing, the national legislature of Denmark. The constituency was established in 2007 following the public administration structural reform. It consists of the municipalities of Aalborg, Brønderslev, Frederikshavn, Hjørring, Jammerbugt, Læsø, Mariagerfjord, Morsø, Rebild, Thisted and Vesthimmerland. The constituency currently elects 15 of the 179 members of the Folketing using the open party-list proportional representation electoral system. At the 2022 general election it had 447,556 registered electors.

<span class="mw-page-title-main">Bornholm (Folketing constituency)</span> Constituency of the Folketing, the national legislature of Denmark

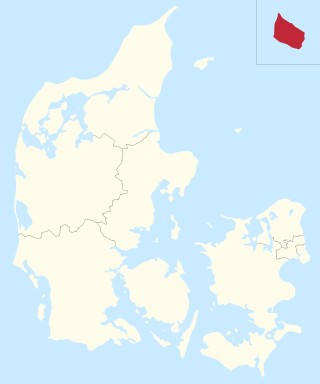
Bornholm is one of the ten multi-member constituencies of the Folketing, the national legislature of Denmark. The constituency was established in 2007 following the public administration structural reform. It consists of the municipality of Bornholm and the unincorporated archipelago of Christiansø (Ertholmene). The constituency currently elects two of the 179 members of the Folketing using the open party-list proportional representation electoral system. At the 2022 general election it had 30,825 registered electors.

<span class="mw-page-title-main">Frederikshavn (nomination district)</span>

Frederikshavn nominating district is one of the 92 nominating districts that exists for Danish elections following the 2007 municipal reform. It consists of Frederikshavn and Læsø municipality. It was created in 1849 as a constituency, and has been a nomination district since 1920, though its boundaries have been changed since then.

<span class="mw-page-title-main">Hjørring (nomination district)</span>

Hjørring nominating district is one of the 92 nominating districts that exists for Danish elections following the 2007 municipal reform. It consists of Hjørring municipality. It was created in 1849 as a constituency, and has been a nomination district since 1920, though its boundaries have been changed since then.

<span class="mw-page-title-main">Holstebro (nomination district)</span>

Holstebro nominating district is one of the 92 nominating districts that exists for Danish elections following the 2007 municipal reform. It consists of Holstebro Municipality. It was created in 1849 as a constituency, and has been a nomination district since 1920, though its boundaries have been changed since then.

<span class="mw-page-title-main">Fredericia (nomination district)</span>

Fredericia nominating district is one of the 92 nominating districts that exits for Danish elections following the 2007 municipal reform. It consists of Fredericia Municipality. It was created in 1849 as a constituency, and has been a nomination district since 1920, though its boundaries have been changed since then.

<span class="mw-page-title-main">Assens (nomination district)</span>

Assens nominating district is one of the 92 nominating districts that exists for Danish elections following the 2007 municipal reform. It consists of Assens Municipality. It was created in 1849 as a constituency, and has been a nomination district since 1920, though its boundaries have been changed since then. It was abolished in 1970 before being recreated in 2007.

<span class="mw-page-title-main">Nyborg (nomination district)</span>

Nyborg nominating district is one of the 92 nominating districts that exists for Danish elections following the 2007 municipal reform. It consists of Kertminde and Nyborg municipality. It was created in 1849 as a constituency, and has been a nomination district since 1920, though its boundaries have been changed since then.

<span class="mw-page-title-main">Køge (nomination district)</span>

Køge nominating district is one of the 92 nominating districts that exists for Danish elections following the 2007 municipal reform. It consists of Køge and Lejre municipality. It was created in 1849 as a constituency, and has been a nomination district since 1920, though its boundaries have been changed on many occasions since then.

<span class="mw-page-title-main">Nørrebro (nomination district)</span>

Nørrebro nominating district is one of the 92 nominating districts that exists for Danish elections following the 2007 municipal reform. It is one of the 9 nominating districts in Copenhagen Municipality. It was created in 1915, though its boundaries have been changed since then.

<span class="mw-page-title-main">Brønshøj (nomination district)</span>

Brønshøj nominating district is one of the 92 nominating districts that exists for Danish elections following the 2007 municipal reform. It is one of the 9 nominating districts in Copenhagen Municipality. It was created in 1950, though its boundaries have been changed since then.

<span class="mw-page-title-main">Vesterbro (nomination district)</span>

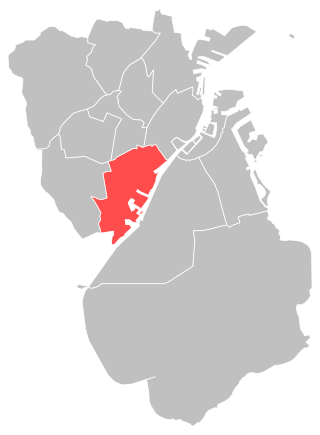
Vesterbro nominating district is one of the 92 nominating districts exists for Danish elections following the 2007 municipal reform. It is one of the 9 nominating districts in Copenhagen Municipality. It was created in 1915, though its boundaries have been changed since then.

<span class="mw-page-title-main">Falkoner (nomination district)</span>

Falkoner nominating district is one of the 92 nominating districts that exists for Danish elections following the 2007 municipal reform. It is one of the 2 nominating districts in Frederiksberg Municipality, the other being Slots. It was created in 1915, though its boundaries have been changed since then.

References

  1. "FOLK1A: Population at the first day of the quarter by region, sex, age and marital status". Copenhagen, Denmark: Statistics Denmark . Retrieved 24 January 2023.
  2. "ARE207: Area 1. January by region". Copenhagen, Denmark: Statistics Denmark . Retrieved 24 January 2023.
  3. "Find et medlem: Du har søgt på storkreds Sydjyllands Storkreds" (in Danish). Copenhagen, Denmark: Folketing . Retrieved 3 February 2023.
  4. "Election for Danish Parliament". Election Guide. Arlington, U.S.A.: International Foundation for Electoral Systems . Retrieved 11 February 2021.
  5. Giannetti, Daniela; Pinto, Luca (2021). "Intra-party ideological heterogeneity: are candidates agents of their parties?". In De Winter, Lieven; Karlsen, Rune; Schmitt, Hermann (eds.). Parliamentary Candidates Between Voters and Parties: A Comparative Perspective. Abingdon, U.K.: Routledge. p. 152. ISBN   978-0-367-24851-2.
  6. "The Electoral System in Denmark: Parliamentary Elections" (PDF) (in Danish). Copenhagen, Denmark: Ministry of the Interior and Housing. p. 3. Retrieved 11 February 2021.
  7. "The Parliamentary Electoral System in Denmark" (in Danish). Copenhagen, Denmark: Folketing. p. 6. Retrieved 11 February 2021.
  8. "The Electoral System in Denmark: Parliamentary Elections" (PDF) (in Danish). Copenhagen, Denmark: Ministry of the Interior and Housing. pp. 3–5. Retrieved 11 February 2021.
  9. "The Parliamentary Electoral System in Denmark" (in Danish). Copenhagen, Denmark: Folketing. p. 8. Retrieved 11 February 2021.
  10. "The Electoral System in Denmark: Parliamentary Elections" (PDF) (in Danish). Copenhagen, Denmark: Ministry of the Interior and Housing. p. 2. Retrieved 11 February 2021.
  11. "The Parliamentary Electoral System in Denmark" (in Danish). Copenhagen, Denmark: Folketing. p. 7. Retrieved 11 February 2021.
  12. "Opgørelse af folketingsvalget den 1. november 2022" (PDF) (in Danish). Copenhagen, Denmark: Statistics Denmark. 11 November 2022. p. 13. Archived from the original (PDF) on 24 December 2022. Retrieved 14 November 2022.
  13. "FV22TOT: Election to the Parliament 2022 by result of the election and region". Copenhagen, Denmark: Statistics Denmark . Retrieved 3 February 2023.
  14. "Opgørelse af folketingsvalget den 1. november 2022" (PDF) (in Danish). Copenhagen, Denmark: Statistics Denmark. 11 November 2022. p. 11. Archived from the original (PDF) on 24 December 2022. Retrieved 14 November 2022.
  15. "Opgørelse af folketingsvalget den 1. november 2022" (PDF) (in Danish). Copenhagen, Denmark: Statistics Denmark. 11 November 2022. p. 20. Archived from the original (PDF) on 24 December 2022. Retrieved 14 November 2022.
  16. "Folketingsvalg tirsdag 1. november 2022: Resultater - Sydjyllands Storkreds" (in Danish). Copenhagen, Denmark: Statistics Denmark. Archived from the original on 2 February 2023. Retrieved 3 February 2023.
  17. "FVKOM: Election to the Parliament by result of the election and municipalities". Copenhagen, Denmark: Statistics Denmark . Retrieved 3 February 2023.
  18. "Opgørelse af folketingsvalget den 1. november 2022" (PDF) (in Danish). Copenhagen, Denmark: Statistics Denmark. 11 November 2022. pp. 29–31. Archived from the original (PDF) on 24 December 2022. Retrieved 14 November 2022.
  19. "Folketingsvalg tirsdag 1. november 2022: Valgte kandidater og stedfortrædere" (in Danish). Copenhagen, Denmark: Statistics Denmark. Archived from the original on 24 December 2022. Retrieved 26 January 2023.
  20. "Opgørelse af folketingsvalget den 5. juni 2019" (PDF) (in Danish). Copenhagen, Denmark: Statistics Denmark. 17 June 2019. p. 12. Archived from the original (PDF) on 19 July 2020. Retrieved 13 July 2020.
  21. "FV19TOTA: Election to the Parliament 2019 by area". Copenhagen, Denmark: Statistics Denmark . Retrieved 8 February 2021.
  22. "Opgørelse af folketingsvalget den 5. juni 2019" (PDF) (in Danish). Copenhagen, Denmark: Statistics Denmark. 17 June 2019. p. 10. Archived from the original (PDF) on 19 July 2020. Retrieved 13 July 2020.
  23. "Folketingsvalg onsdag 5. juni 2019: Resultater - Sydjyllands Storkreds" (in Danish). Copenhagen, Denmark: Statistics Denmark. Archived from the original on 17 January 2021. Retrieved 1 March 2021.
  24. 1 2 3 4 "Den Danske Valgdatabase: Hent Data". Copenhagen, Denmark: Statistics Denmark . Retrieved 9 February 2021.
  25. "Opgørelse af folketingsvalget den 5. juni 2019" (PDF) (in Danish). Copenhagen, Denmark: Statistics Denmark. 17 June 2019. pp. 28–30. Archived from the original (PDF) on 19 July 2020. Retrieved 13 July 2020.
  26. "Folketingsvalg onsdag 5. juni 2019: Valgte kandidater og stedfortrædere" (in Danish). Copenhagen, Denmark: Statistics Denmark. Archived from the original on 16 October 2020. Retrieved 1 March 2021.
  27. "Befolkning og valg: Folketingsvalget den 18. juni 2015" (PDF). Statistiske Efterretninger (in Danish). Vol. 2015, no. 3. Copenhagen, Denmark: Statistics Denmark. 26 June 2015. p. 11. Archived from the original (PDF) on 19 July 2020. Retrieved 13 July 2020.
  28. "FV15S07: Election to the Parliament 2015 in Sydjyllands Storkreds by result of the election and region". Copenhagen, Denmark: Statistics Denmark . Retrieved 1 March 2021.
  29. "Befolkning og valg: Folketingsvalget den 18. juni 2015" (PDF). Statistiske Efterretninger (in Danish). Vol. 2015, no. 3. Copenhagen, Denmark: Statistics Denmark. 26 June 2015. p. 9. Archived from the original (PDF) on 19 July 2020. Retrieved 13 July 2020.
  30. "Folketingsvalg torsdag 18. juni 2015: Resultater - Sydjyllands Storkreds" (in Danish). Copenhagen, Denmark: Statistics Denmark. Archived from the original on 27 February 2021. Retrieved 1 March 2021.
  31. "Befolkning og valg: Folketingsvalget den 18. juni 2015" (PDF). Statistiske Efterretninger (in Danish). Vol. 2015, no. 3. Copenhagen, Denmark: Statistics Denmark. 26 June 2015. pp. 27–29. Archived from the original (PDF) on 19 July 2020. Retrieved 13 July 2020.
  32. "Folketingsvalg torsdag 18. juni 2015: Valgte kandidater og stedfortrædere" (in Danish). Copenhagen, Denmark: Statistics Denmark. Archived from the original on 15 October 2020. Retrieved 4 March 2021.
  33. "Befolkning og valg: Folketingsvalget den 15. september 2011" (PDF). Statistiske Efterretninger (in Danish). Vol. 2011, no. 6. Copenhagen, Denmark: Statistics Denmark. 26 September 2011. p. 12. Archived from the original (PDF) on 19 July 2020. Retrieved 13 July 2020.
  34. "FV11S07: Election to the Parliament 2011 in Sydjyllands Storkreds by result of the election and region". Copenhagen, Denmark: Statistics Denmark . Retrieved 1 March 2021.
  35. "Befolkning og valg: Folketingsvalget den 15. september 2011" (PDF). Statistiske Efterretninger (in Danish). Vol. 2011, no. 6. Copenhagen, Denmark: Statistics Denmark. 26 September 2011. p. 10. Archived from the original (PDF) on 19 July 2020. Retrieved 13 July 2020.
  36. "Folketingsvalg torsdag 15. september 2011: Resultater - Sydjyllands Storkreds" (in Danish). Copenhagen, Denmark: Statistics Denmark. Archived from the original on 12 December 2020. Retrieved 1 March 2021.
  37. "Befolkning og valg: Folketingsvalget den 15. september 2011" (PDF). Statistiske Efterretninger (in Danish). Vol. 2011, no. 6. Copenhagen, Denmark: Statistics Denmark. 26 September 2011. pp. 27–29. Archived from the original (PDF) on 19 July 2020. Retrieved 13 July 2020.
  38. "Folketingsvalg torsdag 15. september 2011: Valgte kandidater og stedfortrædere" (in Danish). Copenhagen, Denmark: Statistics Denmark. Archived from the original on 8 December 2020. Retrieved 4 March 2021.
  39. "Befolkning og valg: Folketingsvalget den 13. november 2007". Statistiske Efterretninger (in Danish). Vol. 2007, no. 17. Copenhagen, Denmark: Statistics Denmark. 27 November 2007. p. 13. Retrieved 13 July 2020.
  40. "FV07S07: Election to the Parliament 2007 in Sydjyllands Storkreds by result of the election and region". Copenhagen, Denmark: Statistics Denmark . Retrieved 4 March 2021.
  41. "Befolkning og valg: Folketingsvalget den 13. november 2007". Statistiske Efterretninger (in Danish). Vol. 2007, no. 17. Copenhagen, Denmark: Statistics Denmark. 27 November 2007. p. 10. Retrieved 13 July 2020.
  42. "Befolkning og valg: Folketingsvalget den 13. november 2007". Statistiske Efterretninger (in Danish). Vol. 2007, no. 17. Copenhagen, Denmark: Statistics Denmark. 27 November 2007. p. 16. Retrieved 13 July 2020.
  43. "Befolkning og valg: Folketingsvalget den 13. november 2007". Statistiske Efterretninger (in Danish). Vol. 2007, no. 17. Copenhagen, Denmark: Statistics Denmark. 27 November 2007. p. 22. Retrieved 13 July 2020.
  44. "Befolkning og valg: Folketingsvalget den 13. november 2007". Statistiske Efterretninger (in Danish). Vol. 2007, no. 17. Copenhagen, Denmark: Statistics Denmark. 27 November 2007. pp. 32–35. Retrieved 13 July 2020.
  45. "I. Kandidaternes stemmetal i de enkelte opstillingskredse og stemmer i alt den 13. november 2007" (PDF) (in Danish). Copenhagen, Denmark: Ministry of the Interior and Housing. pp. 27–31. Archived from the original (PDF) on 11 August 2021. Retrieved 10 February 2021.