
Atomic absorption spectroscopy (AAS) and atomic emission spectroscopy (AES) is a spectroanalytical procedure for the quantitative determination of chemical elements by free atoms in the gaseous state. Atomic absorption spectroscopy is based on absorption of light by free metallic ions.
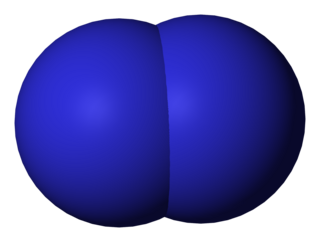
Diatomic molecules are molecules composed of only two atoms, of the same or different chemical elements. If a diatomic molecule consists of two atoms of the same element, such as hydrogen or oxygen, then it is said to be homonuclear. Otherwise, if a diatomic molecule consists of two different atoms, such as carbon monoxide or nitric oxide, the molecule is said to be heteronuclear. The bond in a homonuclear diatomic molecule is non-polar.

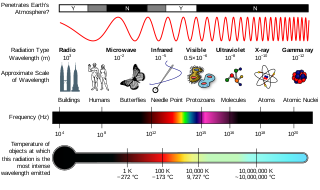
In physics, electromagnetic radiation (EMR) consists of waves of the electromagnetic (EM) field, which propagate through space and carry momentum and electromagnetic radiant energy. Types of EMR include radio waves, microwaves, infrared, (visible) light, ultraviolet, X-rays, and gamma rays, all of which are part of the electromagnetic spectrum.
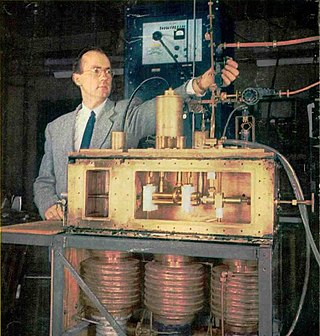
A maser is a device that produces coherent electromagnetic waves, through amplification by stimulated emission. The first maser was built by Charles H. Townes, James P. Gordon, and Herbert J. Zeiger at Columbia University in 1953. Townes, Nikolay Basov and Alexander Prokhorov were awarded the 1964 Nobel Prize in Physics for theoretical work leading to the maser. Masers are also used as the timekeeping device in atomic clocks, and as extremely low-noise microwave amplifiers in radio telescopes and deep-space spacecraft communication ground stations.

Spectroscopy is the field of study that measures and interprets the electromagnetic spectra that result from the interaction between electromagnetic radiation and matter as a function of the wavelength or frequency of the radiation. Matter waves and acoustic waves can also be considered forms of radiative energy, and recently gravitational waves have been associated with a spectral signature in the context of the Laser Interferometer Gravitational-Wave Observatory (LIGO).
Atomic, molecular, and optical physics (AMO) is the study of matter–matter and light–matter interactions, at the scale of one or a few atoms and energy scales around several electron volts. The three areas are closely interrelated. AMO theory includes classical, semi-classical and quantum treatments. Typically, the theory and applications of emission, absorption, scattering of electromagnetic radiation (light) from excited atoms and molecules, analysis of spectroscopy, generation of lasers and masers, and the optical properties of matter in general, fall into these categories.

A quantum mechanical system or particle that is bound—that is, confined spatially—can only take on certain discrete values of energy, called energy levels. This contrasts with classical particles, which can have any amount of energy. The term is commonly used for the energy levels of the electrons in atoms, ions, or molecules, which are bound by the electric field of the nucleus, but can also refer to energy levels of nuclei or vibrational or rotational energy levels in molecules. The energy spectrum of a system with such discrete energy levels is said to be quantized.
A spectral line is a weaker or stronger region in an otherwise uniform and continuous spectrum, resulting from emission or absorption of light in a narrow frequency range, compared with the nearby frequencies. Spectral lines are often used to identify atoms and molecules. These "fingerprints" can be compared to the previously collected ones of atoms and molecules, and are thus used to identify the atomic and molecular components of stars and planets, which would otherwise be impossible.
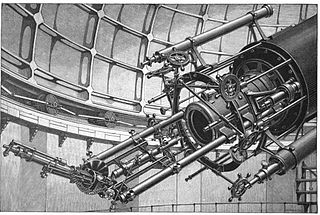
Astronomical spectroscopy is the study of astronomy using the techniques of spectroscopy to measure the spectrum of electromagnetic radiation, including visible light, ultraviolet, X-ray, infrared and radio waves that radiate from stars and other celestial objects. A stellar spectrum can reveal many properties of stars, such as their chemical composition, temperature, density, mass, distance and luminosity. Spectroscopy can show the velocity of motion towards or away from the observer by measuring the Doppler shift. Spectroscopy is also used to study the physical properties of many other types of celestial objects such as planets, nebulae, galaxies, and active galactic nuclei.

The emission spectrum of a chemical element or chemical compound is the spectrum of frequencies of electromagnetic radiation emitted due to an electron making a transition from a high energy state to a lower energy state. The photon energy of the emitted photon is equal to the energy difference between the two states. There are many possible electron transitions for each atom, and each transition has a specific energy difference. This collection of different transitions, leading to different radiated wavelengths, make up an emission spectrum. Each element's emission spectrum is unique. Therefore, spectroscopy can be used to identify elements in matter of unknown composition. Similarly, the emission spectra of molecules can be used in chemical analysis of substances.

Absorption spectroscopy refers to spectroscopic techniques that measure the absorption of electromagnetic radiation, as a function of frequency or wavelength, due to its interaction with a sample. The sample absorbs energy, i.e., photons, from the radiating field. The intensity of the absorption varies as a function of frequency, and this variation is the absorption spectrum. Absorption spectroscopy is performed across the electromagnetic spectrum.
Rotational–vibrational spectroscopy is a branch of molecular spectroscopy concerned with infrared and Raman spectra of molecules in the gas phase. Transitions involving changes in both vibrational and rotational states can be abbreviated as rovibrational transitions. When such transitions emit or absorb photons, the frequency is proportional to the difference in energy levels and can be detected by certain kinds of spectroscopy. Since changes in rotational energy levels are typically much smaller than changes in vibrational energy levels, changes in rotational state are said to give fine structure to the vibrational spectrum. For a given vibrational transition, the same theoretical treatment as for pure rotational spectroscopy gives the rotational quantum numbers, energy levels, and selection rules. In linear and spherical top molecules, rotational lines are found as simple progressions at both higher and lower frequencies relative to the pure vibration frequency. In symmetric top molecules the transitions are classified as parallel when the dipole moment change is parallel to the principal axis of rotation, and perpendicular when the change is perpendicular to that axis. The ro-vibrational spectrum of the asymmetric rotor water is important because of the presence of water vapor in the atmosphere.

Fluorescence spectroscopy is a type of electromagnetic spectroscopy that analyzes fluorescence from a sample. It involves using a beam of light, usually ultraviolet light, that excites the electrons in molecules of certain compounds and causes them to emit light; typically, but not necessarily, visible light. A complementary technique is absorption spectroscopy. In the special case of single molecule fluorescence spectroscopy, intensity fluctuations from the emitted light are measured from either single fluorophores, or pairs of fluorophores.

According to quantum mechanics, atoms and molecules can only hold certain defined quantities of energy, or exist in specific states. When such quanta of electromagnetic radiation are emitted or absorbed by an atom or molecule, energy of the radiation changes the state of the atom or molecule from an initial state to a final state. An absorption band is a range of wavelengths, frequencies or energies in the electromagnetic spectrum which are characteristic of a particular transition from initial to final state in a substance.

Einstein coefficients are quantities describing the probability of absorption or emission of a photon by an atom or molecule. The Einstein A coefficients are related to the rate of spontaneous emission of light, and the Einstein B coefficients are related to the absorption and stimulated emission of light. Throughout this article, "light" refers to any electromagnetic radiation, not necessarily in the visible spectrum.
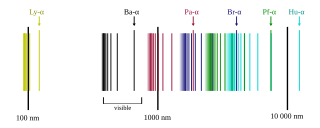
The emission spectrum of atomic hydrogen has been divided into a number of spectral series, with wavelengths given by the Rydberg formula. These observed spectral lines are due to the electron making transitions between two energy levels in an atom. The classification of the series by the Rydberg formula was important in the development of quantum mechanics. The spectral series are important in astronomical spectroscopy for detecting the presence of hydrogen and calculating red shifts.

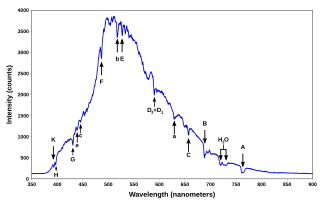
Modern spectroscopy in the Western world started in the 17th century. New designs in optics, specifically prisms, enabled systematic observations of the solar spectrum. Isaac Newton first applied the word spectrum to describe the rainbow of colors that combine to form white light. During the early 1800s, Joseph von Fraunhofer conducted experiments with dispersive spectrometers that enabled spectroscopy to become a more precise and quantitative scientific technique. Since then, spectroscopy has played and continues to play a significant role in chemistry, physics and astronomy. Fraunhofer observed and measured dark lines in the Sun's spectrum, which now bear his name although several of them were observed earlier by Wollaston.
Vibronic spectroscopy is a branch of molecular spectroscopy concerned with vibronic transitions: the simultaneous changes in electronic and vibrational energy levels of a molecule due to the absorption or emission of a photon of the appropriate energy. In the gas phase, vibronic transitions are accompanied by changes in rotational energy also.
In spectroscopy, collision-induced absorption and emission refers to spectral features generated by inelastic collisions of molecules in a gas. Such inelastic collisions may induce quantum transitions in the molecules, or the molecules may form transient supramolecular complexes with spectral features different from the underlying molecules. Collision-induced absorption and emission is particularly important in dense gases, such as hydrogen and helium clouds found in astronomical systems.
In the physical sciences, the term spectrum was introduced first into optics by Isaac Newton in the 17th century, referring to the range of colors observed when white light was dispersed through a prism. Soon the term referred to a plot of light intensity or power as a function of frequency or wavelength, also known as a spectral density plot.