A descriptive statistic is a summary statistic that quantitatively describes or summarizes features from a collection of information, while descriptive statistics is the process of using and analysing those statistics. Descriptive statistics is distinguished from inferential statistics by its aim to summarize a sample, rather than use the data to learn about the population that the sample of data is thought to represent. This generally means that descriptive statistics, unlike inferential statistics, is not developed on the basis of probability theory, and are frequently nonparametric statistics. Even when a data analysis draws its main conclusions using inferential statistics, descriptive statistics are generally also presented. For example, in papers reporting on human subjects, typically a table is included giving the overall sample size, sample sizes in important subgroups, and demographic or clinical characteristics such as the average age, the proportion of subjects of each sex, the proportion of subjects with related co-morbidities, etc.

Statistics is the discipline that concerns the collection, organization, analysis, interpretation, and presentation of data. In applying statistics to a scientific, industrial, or social problem, it is conventional to begin with a statistical population or a statistical model to be studied. Populations can be diverse groups of people or objects such as "all people living in a country" or "every atom composing a crystal". Statistics deals with every aspect of data, including the planning of data collection in terms of the design of surveys and experiments.

In descriptive statistics, summary statistics are used to summarize a set of observations, in order to communicate the largest amount of information as simply as possible. Statisticians commonly try to describe the observations in
Geostatistics is a branch of statistics focusing on spatial or spatiotemporal datasets. Developed originally to predict probability distributions of ore grades for mining operations, it is currently applied in diverse disciplines including petroleum geology, hydrogeology, hydrology, meteorology, oceanography, geochemistry, geometallurgy, geography, forestry, environmental control, landscape ecology, soil science, and agriculture. Geostatistics is applied in varied branches of geography, particularly those involving the spread of diseases (epidemiology), the practice of commerce and military planning (logistics), and the development of efficient spatial networks. Geostatistical algorithms are incorporated in many places, including geographic information systems (GIS).

A choropleth map is a type of statistical thematic map that uses pseudocolor, meaning color corresponding with an aggregate summary of a geographic characteristic within spatial enumeration units, such as population density or per-capita income.
Geographic information science or geoinformation science is a scientific discipline at the crossroads of computational science, social science, and natural science that studies geographic information, including how it represents phenomena in the real world, how it represents the way humans understand the world, and how it can be captured, organized, and analyzed. It is a sub-field of geography, specifically part of technical geography. It has applications to both physical geography and human geography, although its techniques can be applied to many other fields of study as well as many different industries.
Spatial ecology studies the ultimate distributional or spatial unit occupied by a species. In a particular habitat shared by several species, each of the species is usually confined to its own microhabitat or spatial niche because two species in the same general territory cannot usually occupy the same ecological niche for any significant length of time.

Spatial analysis is any of the formal techniques which studies entities using their topological, geometric, or geographic properties. Spatial analysis includes a variety of techniques using different analytic approaches, especially spatial statistics. It may be applied in fields as diverse as astronomy, with its studies of the placement of galaxies in the cosmos, or to chip fabrication engineering, with its use of "place and route" algorithms to build complex wiring structures. In a more restricted sense, spatial analysis is geospatial analysis, the technique applied to structures at the human scale, most notably in the analysis of geographic data. It may also be applied to genomics, as in transcriptomics data.

The modifiable areal unit problem (MAUP) is a source of statistical bias that can significantly impact the results of statistical hypothesis tests. MAUP affects results when point-based measures of spatial phenomena are aggregated into spatial partitions or areal units as in, for example, population density or illness rates. The resulting summary values are influenced by both the shape and scale of the aggregation unit.
Spatial descriptive statistics is the intersection of spatial statistics and descriptive statistics; these methods are used for a variety of purposes in geography, particularly in quantitative data analyses involving Geographic Information Systems (GIS).

In the context of spatial analysis, geographic information systems, and geographic information science, a field is a property that fills space, and varies over space, such as temperature or density. This use of the term has been adopted from physics and mathematics, due to their similarity to physical fields (vector or scalar) such as the electromagnetic field or gravitational field. Synonymous terms include spatially dependent variable (geostatistics), statistical surface ( thematic mapping), and intensive property (physics and chemistry) and crossbreeding between these disciplines is common. The simplest formal model for a field is the function, which yields a single value given a point in space (i.e., t = f(x, y, z) )
Geographic information systems (GISs) and geographic information science (GIScience) combine computer-mapping capabilities with additional database management and data analysis tools. Commercial GIS systems are very powerful and have touched many applications and industries, including environmental science, urban planning, agricultural applications, and others.
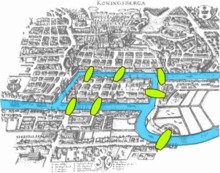
A boundary problem in analysis is a phenomenon in which geographical patterns are differentiated by the shape and arrangement of boundaries that are drawn for administrative or measurement purposes. The boundary problem occurs because of the loss of neighbors in analyses that depend on the values of the neighbors. While geographic phenomena are measured and analyzed within a specific unit, identical spatial data can appear either dispersed or clustered depending on the boundary placed around the data. In analysis with point data, dispersion is evaluated as dependent of the boundary. In analysis with areal data, statistics should be interpreted based upon the boundary.
Quantitative geography is a subfield and methodological approach to geography that develops, tests, and uses mathematical and statistical methods to analyze and model geographic phenomena and patterns. It aims to explain and predict the distribution and dynamics of human and physical geography through the collection and analysis of quantifiable data. The approach quantitative geographers take is generally in line with the scientific method, where a falsifiable hypothesis is generated, and then tested through observational studies. This has received criticism, and in recent years, quantitative geography has moved to include systematic model creation and understanding the limits of their models. This approach is used to study a wide range of topics, including population demographics, urbanization, environmental patterns, and the spatial distribution of economic activity. The methods of quantitative geography are often contrasted by those employed by qualitative geography, which is more focused on observing and recording characteristics of geographic place. However, there is increasing interest in using combinations of both qualitative and quantitative methods through mixed-methods research to better understand and contextualize geographic phenomena.

CrimeStat is a crime mapping software program. CrimeStat is Windows-based program that conducts spatial and statistical analysis and is designed to interface with a geographic information system (GIS). The program is developed by Ned Levine & Associates under the direction of Ned Levine, with funding by the National Institute of Justice (NIJ), an agency of the United States Department of Justice. The program and manual are distributed for free by NIJ.
Crime hotspots are areas that have high crime intensity. These are usually visualized using a map. They are developed for researchers and analysts to examine geographic areas in relation to crime. Researchers and theorists examine the occurrence of hotspots in certain areas and why they happen, and analysts examine the techniques used to perform the research. Developing maps that contain hotspots are becoming a critical and influential tool for policing; they help develop knowledge and understanding of different areas in a city and possibly why crime occurs there.

The second law of geography, according to Waldo Tobler, is "the phenomenon external to a geographic area of interest affects what goes on inside." This is an extension of his first. He first published it in 1999 in reply to a paper titled "Linear pycnophylactic reallocation comment on a paper by D. Martin" and then again in response to criticism of his first law of geography titled "On the First Law of Geography: A Reply." Much of this criticism was centered on the question of if laws were meaningful in geography or any of the social sciences. In this document, Tobler proposed his second law while recognizing others have proposed other concepts to fill the role of 2nd law. Tobler asserted that this phenomenon is common enough to warrant the title of 2nd law of geography. Unlike Tobler's first law of geography, which is relatively well accepted among geographers, there are a few contenders for the title of the second law of geography. Tobler's second law of geography is less well known but still has profound implications for geography and spatial analysis.
Arbia’s law of geography states, "Everything is related to everything else, but things observed at a coarse spatial resolution are more related than things observed at a finer resolution." Originally proposed as the 2nd law of geography, this is one of several laws competing for that title. Because of this, Arbia's law is sometimes referred to as the second law of geography, or Arbia's second law of geography.

The uncertain geographic context problem (UGCoP) is a source of statistical bias that can significantly impact the results of spatial analysis when dealing with aggregate data. The UGCoP is very closely related to the Modifiable areal unit problem (MAUP), and like the MAUP, arises from how we divide the land into areal units. It is caused by the difficulty, or impossibility, of understanding how phenomena under investigation in different enumeration units interact between enumeration units, and outside of a study area over time. It is particularly important to consider the UGCoP within the discipline of time geography, where phenomena under investigation can move between spatial enumeration units during the study period. Examples of research that needs to consider the UGCoP include food access and human mobility.