Television ratings in Australia

Last updated

Television ratings in Australia are used to determine the size and composition of audiences across Australian broadcast and subscription television, primarily for the purpose of informing advertisers what programming is popular with the audience they are attempting to sell their product or service to. [1]

Contents

Ratings are monitored year-round, however, viewership figures are only officially counted for 40 weeks during the year, excluding a two-week break during Easter and ten weeks over summer. Thus, the majority of locally produced programming and popular international shows on commercial networks are shown during the rating period. [2] [3]

A 2016 report found that commercial television in Australia reaches 85.1% of the population aged over 13 years old (down from 93.1% in 2008) with viewership decreasing fastest in viewers aged under 50. The decline in free-to-air television audiences of recent years has been attributed to a tougher and more competitive environment brought about by video on demand and streaming services. [4]

History

Until 1991, AGB McNair provided television ratings data, covering only homes in Sydney and Melbourne. From 1991 until 2000, 'Nielsen Media Research Australia' was the company that measured television ratings, introducing People meters for the first time. From 2001 onwards, OzTAM and Regional TAM took over. [5] OzTAM is wholly owned by the three commercial broadcasters (Seven Network, Nine Network and Network Ten), while Regional TAM is owned by a number of regional broadcasters, however both operate independently. [6] [7]

In total, OzTAM measures ratings from 3,500 homes, with 950 homes in Sydney, 900 in Melbourne, 650 in Brisbane and 500 each in Adelaide and Perth, with these ratings commonly referred to as 'five city metro ratings'. [8] A further 2,000 homes outside these five cities are measured by Regional TAM, and an additional 1,200 homes monitor viewing of subscription television in Australia. [2] [9] Nielsen are contracted to provide the audience measurement services to both OzTAM and Regional TAM [8] having previously operated their own measurement service. [10] In 2017, the metropolitan homes measured will increase to 5,250. [11]

From 27 December 2009, OzTAM and Regional TAM introduced time shift ratings, measuring viewers who watch a program within seven days of its first broadcast. [12] Ratings reports were subsequently broken out into two parts:

From 1st May 2023, OzTAM introduced Virtual Australia, or ‘VOZ’, brings together broadcast viewing on TV sets and connected devices to provide all-screen, cross-platform planning and reporting for Australia’s television industry.

In October 2014, Australia became the third country to introduce Nielsen Twitter TV ratings, measuring reach and activity of television related discussions on the social media platform. [13]

From 3 April 2016, OzTAM began releasing timeshift viewing data for programs watched up to 28 days after broadcast, noting that genres such as dramas, mini-series and films could add up to 20% of their audience with the new data, even though viewing between 8 and 28 days after initial broadcast accounted for only 1.8% of total television viewing. [14]

Measurements

In Australian media, the most common ratings metric reported publicly is total viewers of a program from all age groups. However, advertisers typically prefer the viewership of demographic ranges based on the type of viewers they are seeking to promote their product to. [15] The three common aged-based demographic groups, known as the 'key demographics,' include people aged 16 to 39, 18 to 49 and 25 to 54. [16] [17]

In advertising and media, the reporting of ratings has historically been confined to what is known as '5 city metro,' which only includes viewership of the OzTAM panels in the five largest cities (Sydney, Melbourne, Brisbane, Adelaide, and Perth). [18] Since the 2010s, it has become more common for television networks to publicly spruik 'national ratings' which combine the 5 city metro audience with ratings from Regional TAM. [19]

Ratings performance

In 1989, for the first time since 1978, the Seven Network overtook its rivals Nine Network and Network 10 in terms of average viewers and have remained ahead of Nine and Ten every year until 1994, where due to lower ratings than expected, and a launch of new programs not performing as hoped, the Nine Network defeated Seven Network and regained the title as the highest rating television network in Australia, with the latter relegated back to second highest for the first time in twelve years. In 1990, for the first time since OzTAM began, the Seven Network won all forty weeks of the official ratings period, and, as of 1994, has won the last five years of ratings consecutively throughout the late 1980s and early 1990:.

From 1994 up until 2004, the Nine Network had generally been the ratings leader in Australia, typically followed by the Seven Network and Network Ten respectively. While Network Ten generally rates lower in total viewers, it has traditionally been the market leader for younger viewers. [16] The two national broadcasters, ABC TV and SBS One, typically attract fewer viewers than the three commercial networks due to their various public service obligations. [20]

In 2005, for the first time since 2000, the late 1980s and early 1990s and 1978, the Seven Network overtook its rival Nine Network in terms of average viewers [21] and have remained ahead of Nine and Ten every year until 2019, where due to lower ratings than expected, and a launch of new programs not performing as hoped, the Nine Network defeated Seven Network and regained the title as the highest rating television network in Australia, with the latter relegated back to second highest for the first time in twelve years. In 2011, for the first time since OzTAM began, the Seven Network won all forty weeks of the official ratings period, [22] and, as of 2017, has won the last thirteen years of ratings consecutively. [23] [24]

As of 2016, FOX8 is the most viewed subscription channel on the Foxtel platform. [25]

Top-rated programs per year

The highest-rated programs on Australian television typically include sporting events, reality shows and locally produced scripted programs. [26] [27] They do not factor in digital streaming services, nor do they account for aggregate ratings for events simulcast across multiple networks (e.g. in 2011 the wedding of Prince William and Catherine Middleton attracted over 6 million viewers spread across five networks [28] ).

YearProgramNetworkRatingNotes/Ref
2023* 2023 FIFA Women's World Cup Semi FinalSeven7.13 millionThe highest rated broadcast since Oztam ratings began. [29]
2022 2022 Australian Open – Women's singles FinalNine4.1 million [30]
2021 2021 AFL Grand Final Seven3.91 million [31] [32]
2020 2020 AFL Grand Final Seven3.01 million [33]
2019 2019 State of Origin series Game INine3.23 million [34]
2018 2018 AFL Grand Final PresentationsSeven2.62 million [35]
2017 2017 AFL Grand Final Seven2.72 million [36]
2016 2016 AFL Grand Final PresentationsSeven3.20 million [37]
2015 2015 Cricket World Cup Final Nine/FOX Sports 33.9 million [38] [39] 2015 CWC Final was simulcast on both Nine and FOX Sports 3.
2014 2014 NRL Grand Final Nine3.99 million [40]
2013 My Kitchen Rules Seven3.27 million [41]
2012 The Voice Nine3.33 million [42]
2011 The Block Nine3.37 million [43]
2010 MasterChef Australia Ten4.03 million [44]
2009 MasterChef Australia Ten3.72 million [45]
2008 2008 Summer Olympics opening ceremony Seven2.82 million [46] [26]
2007 2007 AFL Grand Final Ten2.56 million [26]
2006 2006 Commonwealth Games opening ceremony Nine3.56 million [26]
2005 2005 Australian Open – Men's Singles final Seven4.04 million [26]
2004 Australian Idol Ten3.34 million [26]
2003 2003 Rugby World Cup Final Seven4.02 million [26]
2002 Test Australia: The National IQ Test Nine2.78 million [26]
2001 2001 Wimbledon Championships – Men's Singles Nine3.04 million [26]

*Year to date.

Yearly shares

The following table lists the average shares for the survey period of the calendar year, for total viewers in the 5 metropolitan cities during primetime between 6pm and midnight. Prior to 2010, shares were not broken out into a network's different multi-channels.

Network2008 [47] 2009 [48] 2010 [49] 2012 [50] 2014 [51] 2016 [52] 2018

[53]

2019 [54] 2020 [55]
ABC N/AN/A11.9%10.3%10.4%10.1%9.6%10.8%
ABC Comedy N/AN/A1.3%2.1%2.2%2.4%2.2%2.3%
ABC ME N/AN/A0.4%0.6%0.7%0.6%0.5%0.4%
ABC News 24 N/AN/A0.2%0.7%0.9%1.1%1.1%1.5%
ABC channels 14.2%14.0%13.8%13.7%14.2%14.2%15.8%15.1%
Channel Seven N/AN/A20.2%18.6%17.8%14.9%20.6%12.9%15.5%
7Two N/AN/A2.8%3.4%3.7%3.0%3.7%2.9%2.8%
7mate N/AN/A0.5%2.7%3.3%2.6%4.1%2.5%2.8%
7flix N/AN/AN/AN/AN/A2.3%2.0%1.6%1.6%
7food network N/AN/AN/AN/AN/AN/AN/A0.6%N/A
Seven Network 24.2%23.0%23.5%24.7%24.8%22.8%30.4%20.5%22.8%
Channel Nine N/AN/A19.2%17.7%17.3%14.8%16.7%16.2%
9Go! N/AN/A3.1%3.1%3.8%2.9%2.7%2.2%
9Gem N/AN/A0.3%2.1%2.7%2.1%2.9%2.3%
9Life N/AN/AN/AN/AN/A1.9%1.7%1.7%
9Rush N/AN/AN/AN/AN/AN/AN/A0.7%
Nine Network 21.9%21.9%22.7%22.9%23.8%21.7%24.0%23.1%
Network 10 N/AN/A16.2%10.5%9.7%10.0%9.5%9.9%
10 Bold N/AN/A1.1%2.0%2.4%2.8%2.8%3.1%
10 Peach N/AN/AN/A2.5%2.4%2.3%1.7%1.9%
10 Shake N/AN/AN/AN/AN/AN/AN/A0.1%
Network 10 17.0%18.4%17.3%15.1%14.6%15.1%14.0%15.0%
SBS N/AN/A4.1%3.7%3.4%3.8%5.4%4.0%4.3%
SBS Viceland N/AN/A0.5%0.7%0.7%0.8%1.0%1.1%
NITV N/AN/AN/A0.0%0.1%0.2%0.1%0.1%
SBS Food N/AN/AN/AN/AN/A0.9%0.8%0.8%
SBS World Movies N/AN/AN/AN/AN/AN/A0.3%0.8%
SBS channels 4.6%4.8%4.6%4.4%4.2%5.7%7.6%6.3%7.1%
Subscription
channels
15.5%15.9%15.5%16.9%16.1%18.5%16.2%14.5%

See also

Related Research Articles

<span class="mw-page-title-main">Network 10</span> Australian television network

Network 10 is an Australian commercial television network owned by Ten Network Holdings, a division of the Paramount Networks UK & Australia subsidiary of Paramount Global. One of five national free-to-air networks, 10's owned-and-operated stations can be found in the state capital cities of Sydney, Melbourne, Brisbane, Adelaide and Perth while affiliates extend the network to regional areas of the country.

<span class="mw-page-title-main">Seven Network</span> Australian broadcast television network

The Seven Network is a major Australian commercial free-to-air television network. It is owned by Seven West Media Limited, and is one of five main free-to-air television networks in Australia. The network's headquarters are located in Sydney.

<span class="mw-page-title-main">Television in Australia</span> Overview of television in Australia

Television in Australia began experimentally as early as 1929 in Melbourne with radio stations 3DB and 3UZ, and 2UE in Sydney, using the Radiovision system by Gilbert Miles and Donald McDonald, and later from other locations, such as Brisbane in 1934.

OzTAM is an Australian audience measurement research firm that collects and markets television ratings data. It is jointly owned by the Seven Network, the Nine Network and Network Ten, and is the official source of television ratings data for all metropolitan television in Sydney, Melbourne, Brisbane, Adelaide and Perth as well as subscription services on a national basis.

WOW is an Australian television station licensed to WIN Television, serving regional and remote Western Australia. The station officially commenced transmissions on 26 March 1999 as the second commercial regional broadcaster in Western Australia, alongside former monopoly, Golden West Network.

Television news ratings in Australia are collected by three main organisations: OzTAM in metropolitan areas, Regional TAM in regional areas serviced by three commercial television networks, and in areas with two commercial networks, Nielsen Media Research Australia. Ratings are collected for 40 weeks during the year, excluding a two-week break during Easter and ten weeks over summer. The majority of locally produced news and public affairs top the rating charts week after week.

<span class="mw-page-title-main">7two</span> Australian television channel

7two is an Australian free-to-air digital television multichannel, which was launched by the Seven Network on 1 November 2009.

<span class="mw-page-title-main">13th Street (Australian TV channel)</span> Australian television channel

13th Street was an Australian television channel which specialised in airing action and suspense programmes. The channel was owned by NBC Universal and was launched on 15 November 2009 as part of Foxtel's Next Generation launch. It launched on Fetch TV in 2017 as part of Fetch TV's channel pack revamp.

This is a list of Australian television events and premieres which occurred, or are scheduled to occur, in 2012, the 57th year of continuous operation of television in Australia.

<i>Wonderland</i> (season 2) Season of television series

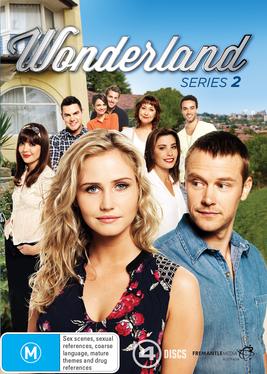
The second season of the Australian drama television series Wonderland, began airing on 15 October 2014 on Network Ten and will conclude on 19 November 2014. The season airs on Wednesdays at 8:30pm.

<i>800 Words</i>  TV series or program

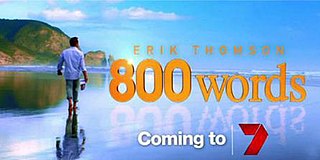
800 Words is a comedy-drama television series, co-produced by South Pacific Pictures and Seven Productions for the Seven Network.

9Life is an Australian free-to-air digital television multichannel owned by Nine Entertainment. The channel airs mostly foreign lifestyle and reality programs, with the channel having a licensing agreement with Discovery Inc. for the distribution of many formats.

High-definition television in Australia is available via cable, IPTV, satellite and terrestrial television. The first high-definition broadcasts began in 2001 and since then the number of channels available to view has grown to a maximum of 27 that can be viewed on pay-TV service, Foxtel.

This is a list of Australian television-related events, debuts, finales, and cancellations that are scheduled to occur in 2017, the 62nd year of continuous operation of television in Australia.

True Story with Hamish & Andy is an Australian television series starring radio and television hosts Hamish Blake and Andy Lee, that was first aired on 5 June 2017. This is their third series for the Nine Network.

This is a list of Australian television-related events, debuts, finales, and cancellations that are scheduled to occur in 2019, the 64th year of continuous operation of television in Australia.

References

  1. "About Ratings". ThinkTV. Retrieved 3 May 2016.
  2. 1 2 Walters, Conrad (23 April 2011). "Made to measure but can we trust TV ratings?". The Sydney Morning Herald .
  3. "Explaining TV's non-rating period". Crikey. 11 January 2005. Retrieved 3 May 2016.
  4. "1 in 7 Australians now watch no Commercial TV, nearly half of all broadcasting reaches people 50+, and those with SVOD watch 30 minutes less a day". Roy Morgan Research. 1 February 2016.
  5. "In the archive - About the archived ratings data". Screen Australia . Retrieved 3 May 2016.
  6. Knox, David (22 November 2013). "How robust is our Ratings system?". TV Tonight.
  7. "Frequently Asked Questions". OzTAM. Retrieved 3 May 2016.
  8. 1 2 "OzTAM extends long-term agreement with Nielsen" (PDF). OzTAM. 10 September 2012. Retrieved 3 May 2016.
  9. "Latest Available reports". OzTAM. Retrieved 3 May 2016.
  10. "Regional Television Diary". Nielsen Media Research. 2007. Archived from the original on 14 April 2007. Retrieved 15 July 2007.
  11. Knox, David (20 July 2016). "OzTAM to increase homes with people meters". TV Tonight.
  12. "Consolidated ratings FAQ". Think TV. Archived from the original on 3 May 2016. Retrieved 3 May 2016.
  13. Knox, David (17 November 2014). "Sport, Reality top first Twitter TV Ratings". TV Tonight .
  14. Hickman, Arvind (30 March 2016). "OzTam to release 28-day time shift audience data". Ad News.
  15. Knox, David (12 November 2008). "Total People v Demographics". TV Tonight.
  16. 1 2 "The perfect TV age". The Age. 10 March 2005.
  17. Lallo, Michael (20 February 2016). "TV battles of 2016: Nine recruits key demographics, marches on Seven stronghold". The Sydney Morning Herald.
  18. "About Ratings". Think TV. Retrieved 18 October 2016.
  19. Knox, David (12 July 2013). "Should ratings rule be national, not metro?". TV Tonight.
  20. Warneke, Ross (2 December 2004). "Nine wins year again". The Age.
  21. "Nine scores ratings goal on back of league draw". The Age . AsiaMedia. 29 May 2007. Archived from the original on 12 March 2008. Retrieved 6 June 2007.
  22. "40 weeks makes a clean sweep for Seven". TV Tonight . 27 November 2011. Retrieved 25 December 2011.
  23. Hickman, Arvind (28 November 2016). "Ratings scorecard: Seven wins total, Nine claims demos, Ten talks up growth". AdNews.
  24. @MrTVAus (13 August 2017). "SEVEN WIN 2017 RATINGS 🎉 21 weeks won of the 40 week survey, unbeatable position. Lead by #MKR, #HouseRules & the @AFL. Congratulations!" (Tweet) via Twitter.
  25. "Temperatures are rising on FOX8 this summer!". MultiChannelNetwork. 5 September 2016. Archived from the original on 18 October 2016.
  26. 1 2 3 4 5 6 7 8 9 "Top 20 programs shown on television, 1998–2009". Screen Australia. Retrieved 17 October 2016.
  27. Duck, Siohban (19 November 2012). "Sport and reality shows big hits in TV ratings". news.com.au.
  28. "Seven dominates as royal wedding sets record". The Australia. 2 May 2011.
  29. "Matildas crush all-time TV ratings records despite World Cup heartbreak in semi-final loss". news.com.au. 17 August 2023.
  30. "FEATURES OzTam ratings 2022: Seven retains total audience crown, while Nine keeps key demos". Mumbrella. 28 November 2022.
  31. Manning, James (26 September 2021). "Weekend TV ratings Saturday September 25, 2021". Mediaweek. Retrieved 26 September 2021.
  32. "AFL grand final the most-watched TV event of 2021".
  33. Knox, David (3 February 2021). "Ratings 2020: the final word". TV Tonight. TV tonight . Retrieved 5 February 2021.
  34. Halfpenny, Kate (2 December 2019). "Nine wins 2019 TV ratings with sport and reality as Seven aims to regroup".
  35. Knox, David (7 February 2019). "2018 ratings: the final word". TV Tonight.
  36. Knox, David (2 February 2018). "2017 TV: the final word". TV Tonight.
  37. Knox, David (5 February 2017). "Ratings 2016: final tally". TV Tonight.
  38. "Cricket World Cup win breaks ratings records".
  39. "2015 ratings: the final word".
  40. Vickery, Colin (12 November 2014). "My Kitchen Rules, The Block, AFL Grand Final and NRL Grand Final dominate the top TV events of 2014". news.com.au.
  41. "The ratings reality show: the most watched TV of 2013". The Sydney Morning Herald . Fairfax Media. 5 December 2013. Archived from the original on 5 October 2016. Retrieved 26 September 2018.
  42. Knox, David (4 December 2012). "2012 Ratings: Seven wins Total People, Nine wins Demos". TV Tonight.
  43. Ma, Wenlei (28 November 2011). "The Block most watched in 2011". Ad News.
  44. Knox, David (29 November 2010). "2010 Ratings winners". TV Tonight.
  45. Knox, David (6 December 2009). "2009: The Top 100". TV Tonight.
  46. Knox, David (30 November 2008). "2008: The Top 200". TV Tonight.
  47. 2008. Metropolitan TV Share of All Viewing - All Homes (D1) - 5 City Share Report. Oztam. Retrieved on 31 March 2012.
  48. 2009. Metropolitan TV Share of All Viewing - All Homes (D1) - 5 City Share Report. Oztam. Retrieved on 31 March 2012.
  49. 2010. Metropolitan TV Share of All Viewing - All Homes (D1) - 5 City Share Report. Oztam. Retrieved on 31 March 2012.
  50. 2012. Metropolitan TV Share of All Viewing - All Homes (D1) - 5 City Share Report. Oztam. Retrieved on 17 October 2016.
  51. 2014. Metropolitan TV Share of All Viewing - All Homes (D1) - 5 City Share Report. Oztam. Retrieved on 6 November 2015.
  52. 2016. Metropolitan TV Share of All Viewing - All Homes (D1) - 5 City Share Report. Oztam. Retrieved on 15 October 2017.
  53. Lallo, Michael (1 December 2018). "Most-watched programs of 2018 revealed". The Sydney Morning Herald. Retrieved 4 July 2021.
  54. 2019. Metropolitan TV Share of All Viewing - All Homes (D1) - 5 City Share Report. Oztam. Retrieved on 22 December 2020.
  55. 2020. Metropolitan TV Share of All Viewing - All Homes (D1) - 5 City Share Report. Oztam. Retrieved on 30 June 2021.