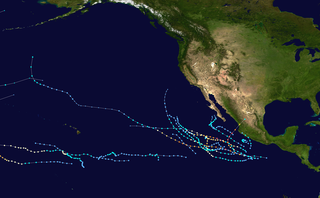
The 2002 Pacific hurricane season was an above-average season which produced fifteen named storms. Eight hurricanes formed, including three Category 5 hurricanes, which tied for the most in a season with 1994 and 2018. Moreover, the season was a near-average season in terms of accumulated cyclone energy (ACE), with a total index of 125 units. The season officially began on May 15 in the East Pacific Ocean, and on June 1 in the Central Pacific and they both ended on November 30. These dates conventionally delimit the period of each year when most tropical cyclones form in the Pacific basin. However, the formation of tropical cyclones is possible at any time of the year.

The 2006 Atlantic hurricane season was a cycle of the annual tropical cyclone season in the Atlantic Ocean in the Northern Hemisphere. The season officially began on June 1, 2006, and ended on November 30, 2006. These dates, adopted by convention, historically describe the period in each year when most subtropical or tropical cyclogenesis occurs in the Atlantic Ocean. The first storm to form in 2006 was Tropical Storm Alberto on June 10; the last, Hurricane Isaac, dissipated on October 2.

The 2008 Atlantic hurricane season was an event in the annual tropical cyclone season in the north Atlantic Ocean. An above-average Atlantic hurricane season season, it was the first on record to have a major hurricane in every month from July to November.

The 1983 Atlantic hurricane season was an event in the annual tropical cyclone season in the north Atlantic Ocean. It was the least active Atlantic hurricane season in 53 years, during which four storms formed. The season officially began on June 1, 1983 and ended November 30, 1983. These dates, adopted by convention, historically describe the period in each year when most systems form. The first named storm, Hurricane Alicia, formed on August 15. The last storm of the season, Tropical Storm Dean, dissipated on September 30.

The 1982 Atlantic hurricane season was an event in the annual tropical cyclone season in the north Atlantic Ocean. It was an inactive Atlantic hurricane season, during which only five tropical cyclones formed. The season officially began on June 1, 1982 and ended November 30, 1982. These dates, adopted by convention, historically describe the period in each year when most systems form. this year, however, most tropical activity was constrained to the month of September.

The 1974 Atlantic hurricane season was a cycle of the annual tropical cyclone season in the Atlantic Ocean in the Northern Hemisphere. There was near-average activity during the season, which officially began on June 1, 1974 and ended on November 30, 1974. These dates, adopted by convention, historically describe the period in each year when most tropical systems form. The first system of the season, Tropical Depression One, formed on June 22. The final system of the season, Tropical Depression Seventeen, dissipated on November 11.

The 2009 Atlantic hurricane season was an event in the annual tropical cyclone season in the north Atlantic Ocean. It was below-average Atlantic hurricane season with nine named storms, the fewest since the 1997 season. The season officially began on June 1, 2009, and ended on November 30, 2009, dates that conventionally delimit the period of each year when most tropical cyclones develop in the Atlantic basin. The first storm to form was Tropical Depression One on May 28, 2009, while the last storm, Hurricane Ida, dissipated on November 10.

The 2009 Pacific hurricane season officially started on May 15 in the East Pacific Ocean, and on June 1 in the Central Pacific; they both ended on November 30. These dates conventionally delimit the period of each year when most tropical cyclones form in the Pacific basin. No tropical cyclones formed during the month of May, making 2009 the first time that no tropical cyclones formed during May since 1999. The first tropical cyclone of the year, Tropical Depression One-E, formed June 18, and dissipated the following day. The first named storm of the season, Hurricane Andres formed on June 21. The final storm of the season, Neki, dissipaed on October 27.

The 1988 Atlantic hurricane season was an event in the annual Atlantic hurricane season in the north Atlantic Ocean. It was an active season during which twelve tropical cyclones formed. The season officially began on June 1, 1988 and ended November 30, 1988. These dates, adopted by convention, historically describe the period in each year when most systems form.

The 2002 Atlantic hurricane season was an average Atlantic hurricane season in which twelve named storms formed. Although Tropical Storm Arthur formed on July 14, the season officially began on June 1 and ended on November 30, dates that conventionally delimit the period of each year when most tropical cyclones develop in the Atlantic basin. The season's final storm, Tropical Depression Fourteen, dissipated on October 16.

The 1990 Atlantic hurricane season featured the most named storms of any hurricane season at the time. During the season, 14 tropical cyclones in the Atlantic Ocean became named storms. The season officially started on June 1, 1990, and ended on November 30. These dates, adopted by the convention, historically delimit the period each year when most Atlantic tropical systems form. However, storm formation is possible at any time of the year, as was the case this season, when Tropical Depression One formed on May 24; Hurricane Nana, the season's final storm, dissipated on October 21.

The 1980 Atlantic hurricane season was an event in the annual tropical cyclone season in the north Atlantic Ocean. It was an average Atlantic hurricane season in which eleven named storms formed. The season officially began on June 1, 1980 and ended November 30, 1980. These dates, adopted by convention, historically describe the period in each year when most Atlantic systems form. Even so, Tropical Depression One did not form until July 17. The season's final storm, Hurricane Karl, dissipated on November 28.

The 1992 Pacific hurricane season was the most active season on record, featuring 27 named storms. The season officially started on May 15, in the Eastern Pacific—designated as the area east of 140°W—and on June 1, in the Central Pacific, which is between the International Date Line and 140°W. The season officially ended in both basins on November 30. These dates typically limit the period of each year when most tropical cyclones form in the eastern Pacific basin. Lasting 24 days, Hurricane Tina became the longest lived North Pacific tropical cyclone on record. Its longevity broke the old record for the Eastern and Central Pacific of 20 days, set by Hurricane Fico in 1978; and the old record for the Western Pacific of 22 days, set by Typhoon Rita in 1972.

The 2011 Pacific hurricane season officially started on May 15, 2011 in the eastern Pacific, designated as the area east of 140°W, and on June 1, 2011 in the central Pacific, which is between the International Date Line and 140°W, and lasted until November 30, 2011. These dates typically limit the period of each year when most tropical cyclones form in the eastern Pacific basin. This timeline documents all the storm formations, strengthening, weakening, landfalls, extratropical transitions, as well as dissipation.
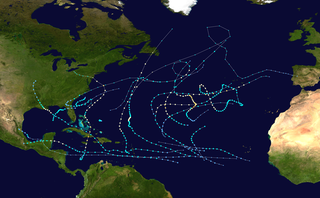
The 2011 Atlantic hurricane season was an event in the annual hurricane season in the north Atlantic Ocean. It was well above average, with 19 tropical storms forming. Even so, it was the first season on record in which the first eight storms failed to attain hurricane strength. The season officially began on June 1, 2011, and ended on November 30, 2011, dates that conventionally delimit the period of each year when most tropical cyclones develop in the Atlantic basin. The season's first storm, Tropical Storm Arlene did not form until June 28. The final storm to develop, Tropical Storm Sean, dissipated on November 11.

The 1990 Pacific hurricane season saw a then-record 16 hurricanes form. Throughout the year, 21 tropical cyclones became named storms in the eastern Pacific Ocean. Hurricane Alma formed on May 12, 1990, three days before the season's official start on May 15. The Central Pacific hurricane season began on June 1, covering tropical cyclone formation in the region between 140°W and International Dateline. Hurricane Trudy was the last storm to dissipate, doing so on November 1, nearly a month before the Pacific hurricane season officially ended on November 30.
The 2012 Pacific hurricane season was an above-average year in which seventeen named storms formed. The hurricane season officially began on May 15 in the east Pacific—defined as the region east of 140°W—and on June 1 in the central Pacific—defined as the region west of 140°W to the International Date Line—and ended on November 30 in both regions. These dates conventionally delimit the period during each year when most tropical cyclones form in the northeastern Pacific Ocean. This year, the first storm of the season, Tropical Storm Aletta, formed on May 14, and the last, Tropical Storm Rosa, dissipated on November 3.
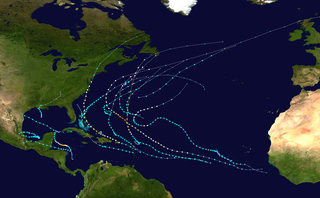
The 2012 Atlantic hurricane season was an event in the annual hurricane season in the north Atlantic Ocean. For the third year in a row there were 19 named storms. The season officially began on June 1, 2012, and ended on November 30, 2012, dates that conventionally delimit the period of each year when most tropical cyclones develop in the Atlantic basin. Surprisingly, two preseason storms formed: Alberto on May 19, and Beryl on May 26. This was the first such occurrence since the 1951 season. The final storm to dissipate was Sandy, on October 29. Altogether, ten storms became hurricanes, of which two intensified into major hurricanes.

The 1991 Pacific hurricane season produced 16 tropical depressions, 14 of which became tropical storms or hurricanes. The season officially started on May 15, 1991 in the Eastern Pacific—designated as the area east of 140°W—and on June 1, 1991 in the Central Pacific, which is between the International Date Line and 140°W. The season officially ended in both basins on November 30, 1991. These dates typically limit the period of each year when most tropical cyclones form in the eastern Pacific basin. This timeline documents all the storm formations, strengthening, weakening, landfalls, extratropical transitions, as well as dissipation. The timeline also includes information which was not operationally released, meaning that information from post-storm reviews by the National Hurricane Center, such as information on a storm that was not operationally warned on, has been included.

The 2013 Pacific hurricane season was an above-average year in which twenty named storms developed. The hurricane season officially began on May 15 in the East Pacific, coinciding with the formation of Tropical Storm Alvin, and on June 1 in the Central Pacific; it ended on November 30 in both basins. These dates conventionally delimit the period during each year when most tropical cyclones form. The final system of the year, Tropical Storm Sonia, dissipated on November 4.