Trajectory inference as implemented in Slingshot for (a) a simulated two-dimensional dataset and (b) a single-cell RNA-seq dataset of the olfactory epithelium.
Trajectory inference or pseudotemporal ordering is a computational technique used in single-cell transcriptomics to determine the pattern of a dynamic process experienced by cells and then arrange cells based on their progression through the process. Single-cell protocols have much higher levels of noise than bulk RNA-seq,[1] so a common step in a single-cell transcriptomics workflow is the clustering of cells into subgroups.[2] Clustering can contend with this inherent variation by combining the signal from many cells, while allowing for the identification of cell types.[3] However, some differences in gene expression between cells are the result of dynamic processes such as the cell cycle, cell differentiation, or response to an external stimuli. Trajectory inference seeks to characterize such differences by placing cells along a continuous path that represents the evolution of the process rather than dividing cells into discrete clusters.[4] In some methods this is done by projecting cells onto an axis called pseudotime which represents the progression through the process.[5]
Since 2015, more than 50 algorithms for trajectory inference have been created.[6] Although the approaches taken are diverse there are some commonalities to the methods. Typically, the steps in the algorithm consist of dimensionality reduction to reduce the complexity of the data, trajectory building to determine the structure of the dynamic process, and projection of the data onto the trajectory so that cells are positioned by their development through the process and cells with similar expression profiles are situated near each other.[6] Trajectory inference algorithms differ in the specific procedure used for dimensionality reduction, the kinds of structures that can be used to represent the dynamic process, and the prior information that is required or can be provided.[2] A comprehensive benchmarkign of trajectory inference methods is provided by DynVerse.
PCA of a multivariate Gaussian distribution. The vectors shown are the first (longer vector) and second principal components, which indicate the directions of maximum variance.
Dimensionality reduction
The data produced by single-cell RNA-seq can consist of thousands of cells each with expression levels recorded across thousands of genes.[7] In order to efficiently process data with such high dimensionality many trajectory inference algorithms employ a dimensionality reduction procedure such as principal component analysis (PCA), independent component analysis (ICA), or t-SNE as their first step.[8] The purpose of this step is to combine many features of the data into a more informative measure of the data.[4] For example, a coordinate resulting from dimensionality reduction could combine expression levels from many genes that are associated with the cell cycle into one value that represents a cell's position in the cell cycle.[8] Such a transformation corresponds to dimensionality reduction in the feature space, but dimensionality reduction can also be applied to the sample space by clustering together groups of similar cells.[1]
Trajectory building
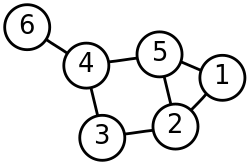
A graph with six vertices. Many trajectory inference algorithms use graphs to build the trajectory.
Many methods represent the structure of the dynamic process via a graph-based approach. In such an approach the vertices of the graph correspond to states in the dynamic process, such as cell types in cell differentiation, and the edges between the nodes correspond to transitions between the states.[6] The creation of the trajectory graph can be accomplished using k-nearest neighbors or minimum spanning tree algorithms.[9] The topology of the trajectory refers to the structure of the graph and different algorithms are limited to creation of graph topologies of a particular type such as linear, branching, or cyclic.[4]
Use of prior information
Some methods require or allow for the input of prior information which is used to guide the creation of the trajectory. The use of prior information can lead to more accurate trajectory determination, but poor priors can lead the algorithm astray or bias results towards expectations.[6] Examples of prior information that can be used in trajectory inference are the selection of start cells that are at the beginning of the trajectory, the number of branches in the trajectory, and the number of end states for the trajectory.[10]
Software
MARGARET
MARGARET employs a deep unsupervised metric learning approach for inferring the cellular latent space and cell clusters. The trajectory is modeled using a cluster-connectivity graph to capture complex trajectory topologies. MARGARET utilizes the inferred trajectory for determining terminal states and inferring cell-fate plasticity using a scalable Absorbing Markov chain model.[11]
Monocle
Monocle first employs a differential expression test to reduce the number of genes then applies independent component analysis for additional dimensionality reduction. To build the trajectory Monocle computes a minimum spanning tree, then finds the longest connected path in that tree. Cells are projected onto the nearest point to them along that path.[5]
p-Creode
p-Creode finds the most likely path through a density-adjusted k-nearest neighbor graph. Graphs from an ensemble are scored with a graph similarity metric to select the most representative topology. p-Creode has been tested on a range of single-cell platforms, including mass cytometry, multiplex immunofluorescence,[12] and single-cell RNA-seq. No prior information is required.[13]
PHLOWER
Phlower leverages the harmonic component of the Hodge decomposition on simplicial complexes to infer flow embeddings from single-cell multimodal data. PHLOWER was evaluated in a comprehensive benchmarking data sets with large cell differentiation trees, which supported it advanteges towards state of the art methods. It was also used to dissect regulatory programs controlling a kidney organoid cell differentiation. [14]
Slingshot
Slingshot takes cluster labels as input and then orders these clusters into lineages by the construction of a minimum spanning tree. Paths through the tree are smoothed by fitting simultaneous principal curves and a cell's pseudotime value is determined by its projection onto one or more of these curves. Prior information, such as initial and terminal clusters, is optional.[10]
Wishbone is built on Wanderlust and allows for a bifurcation in the graph topology, whereas Wanderlust creates a linear graph. Wishbone combines principal component analysis and diffusion maps to achieve dimensionality reduction then also creates a KNN graph.[17]
Waterfall
Waterfall performs dimensionality reduction via principal component analysis and uses a k-means algorithm to find cell clusters. A minimal spanning tree is built between the centers of the clusters. Waterfall is entirely unsupervised, requiring no prior information, and produces linear trajectories.[18]
This page is based on this Wikipedia article Text is available under the CC BY-SA 4.0 license; additional terms may apply. Images, videos and audio are available under their respective licenses.