
Transportation engineering or transport engineering is the application of technology and scientific principles to the planning, functional design, operation and management of facilities for any mode of transportation in order to provide for the safe, efficient, rapid, comfortable, convenient, economical, and environmentally compatible movement of people and goods transport.

Transportation planning is the process of defining future policies, goals, investments, and spatial planning designs to prepare for future needs to move people and goods to destinations. As practiced today, it is a collaborative process that incorporates the input of many stakeholders including various government agencies, the public and private businesses. Transportation planners apply a multi-modal and/or comprehensive approach to analyzing the wide range of alternatives and impacts on the transportation system to influence beneficial outcomes.

Parking is the act of stopping and disengaging a vehicle and leaving it unoccupied. Parking on one or both sides of a road is often permitted, though sometimes with restrictions. Some buildings have parking facilities for use of the buildings' users. Countries and local governments have rules for design and use of parking spaces.
A prediction, or forecast, is a statement about a future event or data. They are often, but not always, based upon experience or knowledge. There is no universal agreement about the exact difference from "estimation"; different authors and disciplines ascribe different connotations.

Travel behavior is the study of what people do over space, and how people use transport.

The concentric zone model, also known as the Burgess model or the CCD model, is one of the earliest theoretical models to explain urban social structures. It was created by sociologist Ernest Burgess in 1925.
A traffic analysis zone or transportation analysis zone (TAZ) is the unit of geography most commonly used in conventional transportation planning models. The size of a zone varies, but for a typical metropolitan planning software, a zone of under 3,000 people is common. The spatial extent of zones typically varies in models, ranging from very large areas in the exurb to as small as city blocks or buildings in central business districts. There is no technical reason zones cannot be as small as single buildings, however additional zones add to the computational burden.

Trip distribution is the second component in the traditional four-step transportation forecasting model. This step matches tripmakers’ origins and destinations to develop a “trip table”, a matrix that displays the number of trips going from each origin to each destination. Historically, this component has been the least developed component of the transportation planning model.
Mode choice analysis is the third step in the conventional four-step transportation forecasting model. The steps, in order, are trip generation, trip distribution, mode choice analysis, and route assignment. Trip distribution's zonal interchange analysis yields a set of origin destination tables that tells where the trips will be made. Mode choice analysis allows the modeler to determine what mode of transport will be used, and what modal share results.
Route assignment, route choice, or traffic assignment concerns the selection of routes between origins and destinations in transportation networks. It is the fourth step in the conventional transportation forecasting model, following trip generation, trip distribution, and mode choice. The zonal interchange analysis of trip distribution provides origin-destination trip tables. Mode choice analysis tells which travelers will use which mode. To determine facility needs and costs and benefits, we need to know the number of travelers on each route and link of the network. We need to undertake traffic assignment. Suppose there is a network of highways and transit systems and a proposed addition. We first want to know the present pattern of traffic delay and then what would happen if the addition were made.
Land-use forecasting undertakes to project the distribution and intensity of trip generating activities in the urban area. In practice, land-use models are demand-driven, using as inputs the aggregate information on growth produced by an aggregate economic forecasting activity. Land-use estimates are inputs to the transportation planning process.
In medical research, social science, and biology, a cross-sectional study is a type of observational study that analyzes data from a population, or a representative subset, at a specific point in time—that is, cross-sectional data.
In mathematics and transportation engineering, traffic flow is the study of interactions between travellers and infrastructure, with the aim of understanding and developing an optimal transport network with efficient movement of traffic and minimal traffic congestion problems.

Spatial analysis or spatial statistics includes any of the formal techniques which studies entities using their topological, geometric, or geographic properties. Spatial analysis includes a variety of techniques, many still in their early development, using different analytic approaches and applied in fields as diverse as astronomy, with its studies of the placement of galaxies in the cosmos, to chip fabrication engineering, with its use of "place and route" algorithms to build complex wiring structures. In a more restricted sense, spatial analysis is the technique applied to structures at the human scale, most notably in the analysis of geographic data or transcriptomics data.

The modifiable areal unit problem (MAUP) is a source of statistical bias that can significantly impact the results of statistical hypothesis tests. MAUP affects results when point-based measures of spatial phenomena are aggregated into districts, for example, population density or illness rates. The resulting summary values are influenced by both the shape and scale of the aggregation unit.

Transportation forecasting is the attempt of estimating the number of vehicles or people that will use a specific transportation facility in the future. For instance, a forecast may estimate the number of vehicles on a planned road or bridge, the ridership on a railway line, the number of passengers visiting an airport, or the number of ships calling on a seaport. Traffic forecasting begins with the collection of data on current traffic. This traffic data is combined with other known data, such as population, employment, trip rates, travel costs, etc., to develop a traffic demand model for the current situation. Feeding it with predicted data for population, employment, etc. results in estimates of future traffic, typically estimated for each segment of the transportation infrastructure in question, e.g., for each roadway segment or railway station. The current technologies facilitate the access to dynamic data, big data, etc., providing the opportunity to develop new algorithms to improve greatly the predictability and accuracy of the current estimations.
TRANSIMS is an integrated set of tools developed to conduct regional transportation system analyses. With the goal of establishing TRANSIMS as an ongoing public resource available to the transportation community, TRANSIMS is made available under the NASA Open Source Agreement Version 1.3

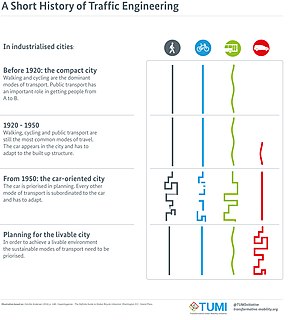
Walkability is a measure of how friendly an area is for walking. Walkability has health, environmental, and economic benefits. Factors influencing walkability include the presence or absence and quality of footpaths, sidewalks or other pedestrian rights-of-way, traffic and road conditions, land use patterns, building accessibility, and safety, among others. Walkability is an important concept in sustainable urban design. Project Drawdown describes making cities walkable as an important solution in the toolkit for adapting cities to climate change: it reduces carbon emissions, and improves quality of life.
Design of robust and reliable networks and network services relies on an understanding of the traffic characteristics of the network. Throughout history, different models of network traffic have been developed and used for evaluating existing and proposed networks and services.


