United States presidential elections in Michigan

Last updated

Presidential elections in Michigan
Michigan in United States.svg
Number of elections47
Voted Democratic17
Voted Republican28
Voted Whig1
Voted other1 [lower-alpha 1]
Voted for winning candidate34
Voted for losing candidate13

Following is a table of United States presidential elections in Michigan, ordered by year. Since its admission to statehood in 1837, Michigan has participated in every U.S. presidential election, although they did participate in the 1836 election and receive electoral votes. Michigan is tied with Pennsylvania and Wisconsin for the longest active streak of voting for the winning candidate, last voting for a losing candidate in 2004 when they backed John Kerry.

Contents

Winners of the state are in bold. The shading refers to the state winner, and not the national winner.

Elections from 1864 to present

YearWinner (nationally)VotesPercentRunner-up (nationally)VotesPercentOther national
candidates [lower-alpha 2]
VotesPercentElectoral
Votes
Notes
2020 [1] Joe Biden 2,804,04050.62 Donald Trump 2,649,85247.8416
2016 [2] Donald Trump [lower-alpha 3] 2,279,54347.25 Hillary Clinton 2,268,83947.03 Gary Johnson 173,0573.616
2012 [3] Barack Obama 2,564,56954.21 Mitt Romney 2,115,25644.71-16
2008 [4] Barack Obama 2,872,57957.43 John McCain 2,048,63940.96-17
2004 [5] George W. Bush 2,313,74647.81 John Kerry 2,479,18351.23-17
2000 [6] George W. Bush [lower-alpha 3] 1,953,13946.15 Al Gore 2,170,41851.28-18
1996 [7] Bill Clinton 1,989,65351.69 Bob Dole 1,481,21238.48 Ross Perot 336,6708.7518
1992 Bill Clinton 1,871,18243.77 George H. W. Bush 1,554,94036.38 Ross Perot 824,81319.318
1988 George H. W. Bush 1,965,48653.57 Michael Dukakis 1,675,78345.67-20
1984 Ronald Reagan 2,251,57159.23 Walter Mondale 1,529,63840.24-20
1980 Ronald Reagan 1,915,22548.99 Jimmy Carter 1,661,53242.50 John B. Anderson 275,2237.0421
1976 Jimmy Carter 1,696,71446.44 Gerald Ford 1,893,74251.83-21
1972 Richard Nixon 1,961,72156.20 George McGovern 1,459,43541.81-21
1968 Richard Nixon 1,370,66541.46 Hubert Humphrey 1,593,08248.18 George Wallace 331,96810.0421
1964 Lyndon B. Johnson 2,136,61566.70 Barry Goldwater 1,060,15233.10-21
1960 John F. Kennedy 1,687,26950.85 Richard Nixon 1,620,42848.84-20
1956 Dwight D. Eisenhower 1,713,64755.63 Adlai Stevenson II 1,359,89844.15 T. Coleman Andrews/
Unpledged Electors [lower-alpha 4]
-20
1952 Dwight D. Eisenhower 1,551,52955.44 Adlai Stevenson II 1,230,65743.97-20
1948 Harry S. Truman 1,003,44847.57 Thomas E. Dewey 1,038,59549.23 Strom Thurmond -19
1944 Franklin D. Roosevelt 1,106,89950.19 Thomas E. Dewey 1,084,42349.18-19
1940 Franklin D. Roosevelt 1,032,99149.52 Wendell Willkie 1,039,91749.85-19
1936 Franklin D. Roosevelt 1,016,79456.33 Alf Landon 699,73338.76-19
1932 Franklin D. Roosevelt 871,70052.36 Herbert Hoover 739,89444.44-19
1928 Herbert Hoover 965,39670.36 Al Smith 396,76228.92-15
1924 Calvin Coolidge 874,63175.37 John W. Davis 152,35913.13 Robert M. La Follette 122,01410.5115
1920 Warren G. Harding 762,86572.76 James M. Cox 233,45022.27 Parley P. Christensen 10,4801.0015
1916 Woodrow Wilson 286,77544.05 Charles E. Hughes 339,09752.09-15
1912 Woodrow Wilson 150,75127.36 Theodore Roosevelt 214,58438.95 William H. Taft 152,24427.6315
1908 William H. Taft 335,58061.93 William Jennings Bryan 175,77132.44-14
1904 Theodore Roosevelt 364,95769.51 Alton B. Parker 135,39225.79-14
1900 William McKinley 316,26958.10 William Jennings Bryan 211,68538.89-14
1896 William McKinley 293,33653.77 William Jennings Bryan 237,16643.47-14
1892 Grover Cleveland 201,62443.26 Benjamin Harrison 222,70847.79 James B. Weaver 19,9314.2814Electoral vote split 9–5 by Congressional District method.
1888 Benjamin Harrison [lower-alpha 3] 236,38749.73 Grover Cleveland 213,46944.91-13
1884 Grover Cleveland 189,36147.20 James G. Blaine 192,66948.02-13
1880 James A. Garfield 185,33552.49 Winfield S. Hancock 131,59737.27 James B. Weaver 34,8959.8811
1876 Rutherford B. Hayes [lower-alpha 3] 166,90152.41 Samuel J. Tilden 141,68544.49-11
1872 Ulysses S. Grant 138,75862.66 Horace Greeley 78,55135.47-11
1868 Ulysses S. Grant 128,56357.0 Horatio Seymour 97,06943.0-8
1864 Abraham Lincoln 91,13355.1 George B. McClellan 74,14644.9-8

Election of 1860

The election of 1860 was a complex realigning election in which the breakdown of the previous two-party alignment culminated in four parties each competing for influence in different parts of the country. The result of the election, with the victory of an ardent opponent of slavery, spurred the secession of eleven states and brought about the American Civil War.

YearWinner (nationally)VotesPercentRunner-up (nationally)VotesPercentRunner-up (nationally)VotesPercentRunner-up (nationally)VotesPercentElectoral
Votes
1860 Abraham Lincoln 88,48157.2 Stephen A. Douglas 65,05742.0 John C. Breckinridge 8050.5 John Bell 4150.36

Elections prior to 1860

YearWinner (nationally)VotesPercentRunner-up (nationally)VotesPercentOther national
candidates [lower-alpha 2]
VotesPercentElectoral
Votes
Notes
1856 James Buchanan 52,13941.52 John C. Frémont 71,76257.15 Millard Fillmore 1,6601.326
1852 Franklin Pierce 41,84250.45 Winfield Scott 33,86040.83 John P. Hale 7,2378.736
1848 Zachary Taylor 23,94736.8 Lewis Cass 30,74247.24 Martin Van Buren 10,39315.975
1844 James K. Polk 27,73749.75 Henry Clay 24,37543.72-5
1840 William Henry Harrison 22,93351.71 Martin Van Buren 21,09647.57-3
1836 Martin Van Buren 7,12256.22 William Henry Harrison 5,54543.78various [lower-alpha 5] --3

See also

Notes

  1. Theodore Roosevelt, 1912.
  2. 1 2 For purposes of these lists, other national candidates are defined as those who won at least one electoral vote, or won at least ten percent of the vote in multiple states.
  3. 1 2 3 4 Won the electoral college while losing the popular vote
  4. Was allied with a slate of unpledged electors in Louisiana, Mississippi and South Carolina
  5. Three other candidates ran and received electoral votes nationally as part of the unsuccessful Whig strategy to defeat Martin Van Buren by running four candidates with local appeal in different regions of the country. The others were Hugh Lawson White, Daniel Webster, and Willie Person Mangum. None of these candidates appeared on the ballot in Michigan.

Related Research Articles

<span class="mw-page-title-main">United States presidential elections in Alabama</span>

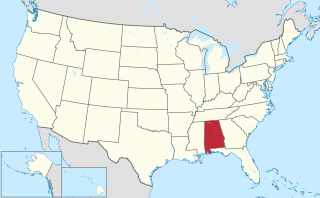
Following is a table of United States presidential elections in Alabama, ordered by year. Since its admission to statehood in 1819, Alabama has participated in every U.S. presidential election except the election of 1864, during the American Civil War, when the state had seceded to join the Confederacy.

<span class="mw-page-title-main">United States presidential elections in Delaware</span>

Following is a table of United States presidential elections in Delaware, ordered by year. Since its admission to statehood in 1787, Delaware has participated in every U.S. presidential election.

<span class="mw-page-title-main">United States presidential elections in Georgia</span>

Following is a table of United States presidential elections in Georgia, ordered by year. Since its admission to statehood in 1788, Georgia has participated in every U.S. presidential election except the election of 1864, when it had seceded in the American Civil War.

<span class="mw-page-title-main">United States presidential elections in Illinois</span> US election season

Following is a table of United States presidential elections in Illinois, ordered by year. Since its admission to statehood in 1818, Illinois has participated in every U.S. presidential election.

<span class="mw-page-title-main">United States presidential elections in Indiana</span> United States presidential election results in Indiana from 1864 to present

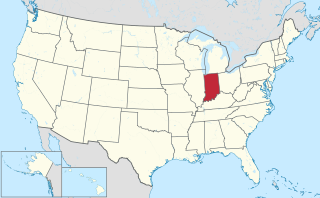
Following is a table of United States presidential elections in Indiana, ordered by year. Since its admission to statehood in 1816, Indiana has participated in every U.S. presidential election.

<span class="mw-page-title-main">United States presidential elections in Iowa</span>

Following is a table of United States presidential elections in Iowa, ordered by year. Since its admission to statehood in 1846, Iowa has participated in every U.S. presidential election.

<span class="mw-page-title-main">United States presidential elections in Kentucky</span>

Following is a table of United States presidential elections in Kentucky, ordered by year. Since its admission to statehood in 1792, Kentucky has participated in every U.S. presidential election. Prior to the election of 1792, Kentucky was part of Virginia, and residents of the area voted as part of that state.

<span class="mw-page-title-main">United States presidential elections in Louisiana</span>

Following is a table of United States presidential elections in Louisiana, ordered by year. Since its admission to statehood in 1812, Louisiana has participated in every U.S. presidential election except the election of 1864, during the American Civil War. At that time, Louisiana was controlled by the Union and held elections, but electors were not ultimately counted.

<span class="mw-page-title-main">United States presidential elections in Maine</span>

Following is a table of United States presidential elections in Maine, ordered by year. Since its admission to statehood in 1820, Maine has participated in every U.S. presidential election. Prior to 1820, much of the territory currently comprising the state of Maine was part of the state of Massachusetts, and citizens residing in that area have thus been able to participate in every U.S. election. Since 1972, Maine awards two electoral votes based on the statewide vote, and one vote for each of the two congressional districts. However, it is rare that this results in a split vote. It has done so twice, in 2016 and 2020.

<span class="mw-page-title-main">United States presidential elections in Maryland</span>

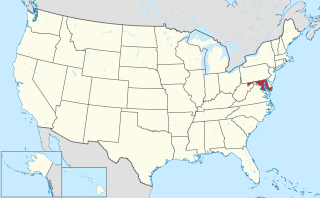
Following is a table of United States presidential elections in Maryland, ordered by year. Since its admission to statehood in 1788, Maryland has participated in every U.S. presidential election. Considered a bellwether state during the 20th century, only voting for the losing candidate three times during that century, Maryland has since become one of the most blue (Democratic) states, last voting for a Republican candidate in 1988.

<span class="mw-page-title-main">United States presidential elections in Massachusetts</span>

Following is a table of United States presidential elections in Massachusetts, ordered by year. Since its admission to statehood in 1788, Massachusetts has participated in every U.S. presidential election.

<span class="mw-page-title-main">United States presidential elections in Minnesota</span>

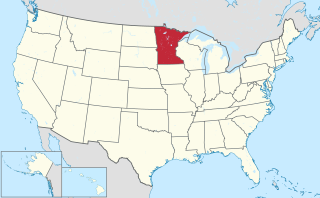
Following is a table of United States presidential elections in Minnesota, ordered by year. Since its admission to statehood in 1858, Minnesota has participated in every U.S. presidential election.

<span class="mw-page-title-main">United States presidential elections in Nevada</span>

The following is a table of United States presidential elections in Nevada, ordered by year. Since its admission to statehood in 1864, Nevada has participated in every U.S. presidential election. Since New Mexico's statehood in 1912, Nevada has voted for the same candidate as New Mexico in all presidential elections except for 2000.

<span class="mw-page-title-main">United States presidential elections in New York</span>

Following is a table of United States presidential elections in New York, ordered by year. Since its admission to statehood in 1788, New York has participated in every U.S. presidential election except the election of 1788–1789, when it failed to appoint its allotment of eight electors because of a deadlock in the state legislature.

<span class="mw-page-title-main">United States presidential elections in North Carolina</span>

Following is a table of United States presidential elections in North Carolina, ordered by year. Since its admission to statehood in 1789, North Carolina has participated in every U.S. presidential election except the election of 1864, during the American Civil War, when the state had seceded to join the Confederacy. North Carolina did not participate in the 1788–89 United States presidential election, as it did not ratify the Constitution of the United States until months after the end of that election and after George Washington had assumed office as President of the United States.

<span class="mw-page-title-main">United States presidential elections in Oregon</span>

Following is a table of United States presidential elections in Oregon, ordered by year. Since its admission to statehood in 1859, Oregon has participated in every U.S. presidential election.

<span class="mw-page-title-main">United States presidential elections in Rhode Island</span>

Following is a table of United States presidential elections in Rhode Island, ordered by year. Since its admission to statehood in 1790, Rhode Island has participated in every U.S. presidential election.

<span class="mw-page-title-main">United States presidential elections in South Carolina</span>

Following is a table of United States presidential elections in South Carolina, ordered by year. Since its admission to statehood in 1788, South Carolina has participated in every U.S. presidential election except the election of 1864 during the American Civil War, when the state had seceded to join the Confederacy.

<span class="mw-page-title-main">United States presidential elections in Tennessee</span>

Following is a table of United States presidential elections in Tennessee, ordered by year. Since its admission to statehood in 1796, Tennessee has participated in every U.S. presidential election except the election of 1864, during the American Civil War. At that time, Tennessee was controlled by the Union and held elections, but electors were not ultimately counted.

<span class="mw-page-title-main">United States presidential elections in Vermont</span>

Following is a table of United States presidential elections in Vermont, ordered by year. Since its admission to statehood in 1791, Vermont has participated in every U.S. presidential election.

References

  1. "Presidential Election Results: Biden Wins". The New York Times . 3 November 2020. Retrieved November 15, 2020.
  2. 2016 official Federal Election Commission report.
  3. 2012 official Federal Election Commission report.
  4. 2008 official Federal Election Commission report.
  5. "Federal Elections 2004: Election Results for the U.S. President, the U.S. Senate and the U.S. House of Representatives" (PDF). Federal Elections Commission. May 2005.
  6. "2000 Presidential Election Statistics". Dave Leip’s Atlas of U.S. Presidential Elections.
  7. "1996 Presidential Election Statistics". Dave Leip’s Atlas of U.S. Presidential Elections. Retrieved 2018-03-05.