United States tropical cyclone rainfall climatology

Last updated
All tropical cyclone tracks between the years 1985 and 2005. Global tropical cyclone tracks-edit2.jpg
All tropical cyclone tracks between the years 1985 and 2005.

The United States tropical cyclone rainfall climatology concerns the amount of precipitation, primarily in the form of rain, which occurs during tropical cyclones and their extratropical cyclone remnants across the United States. Typically, five tropical cyclones and their remnants impact the country each year, contributing between a tenth and a quarter of the annual rainfall across the southern tier of the country. The highest rainfall amounts appear close to the coast, with lesser amounts falling farther inland. Obstructions to the precipitation pattern, such as the Appalachian mountains, focus higher amounts from northern Georgia through New England. While most impacts occur with systems moving in from the Atlantic Ocean or Gulf of Mexico, some emanate from the eastern Pacific Ocean, with a few crossing Mexico before impacting the Southwest. Those making landfall within the Southeast portion of the country tend to have the greatest potential for heavy rains.

Contents

Long-term averages

On average, five North Atlantic hurricanes or their remnants lead to rainfall across the contiguous United States each year, contributing between a tenth and a quarter of the annual rainfall to the southern United States. While many of these storms form in the Atlantic basin, some systems or their remnants move through Mexico from the Eastern Pacific basin. Tropical cyclones from the eastern Pacific bring nearly 20 percent of the average annual rainfall to southern California. [1] The average storm total rainfall for a tropical cyclone impacting the contiguous United States from the Atlantic basin is about 16 in (410 mm), with 70 to 75 percent of the storm total falling within a 24‑hour period.

Highest known amounts for the United States since 1950

Below is a list of the top ten highest known storm total rainfall amounts from individual tropical cyclones across the United States since 1950. Four of the wettest systems struck Texas, three strongly impacted Hawaii, while two others made their biggest mark on Florida, and another impacted Puerto Rico.

Flooding in Port Arthur, Texas caused by Hurricane Harvey. Harvey was both the wettest and costliest tropical cyclone in United States history. Support during Hurricane Harvey (TX) (50).jpg
Flooding in Port Arthur, Texas caused by Hurricane Harvey. Harvey was both the wettest and costliest tropical cyclone in United States history.
  1. 60.58 in (1,539 mm) Harvey 2017 in Nederland, Texas
  2. 52.02 in (1,321 mm) Lane 2018 in Mountainview, Hawaii
  3. 52.00 in (1,321 mm) Hiki 1950 at the Kanalohuluhulu Ranger Station, Hawaii
  4. 48 in (1,200 mm) Amelia 1978 in Medina, Texas
  5. 45.20 in (1,148 mm) Easy 1950 in Yankeetown, Florida
  6. 45 in (1,100 mm) Claudette 1979 in Alvin, Texas
  7. 41.68 in (1,059 mm) T.D. # 15 1970 in Jayuya, Puerto Rico
  8. 40.68 in (1,033 mm) Allison 2001 in northwest Jefferson County, Texas
  9. 38.76 in (985 mm) Paul 2000 at the Kapapala Ranch 36, Hawaii
  10. 38.46 in (977 mm) Georges 1998 in Munson, Florida

Maximum per state for the contiguous United States

U.S. tropical cyclone rainfall maxima per state TCstaterainfall.gif
U.S. tropical cyclone rainfall maxima per state

State maxima relating to tropical cyclones and their remnants are shown on the left, color-coded by amount. Tropical cyclones from the Atlantic basin have the most sway along the Gulf coast and Eastern Seaboard. The impact of tropical cyclones and their remnants originally from the eastern Pacific stretches as far east as Michigan and Indiana. Rainfall related to the low pressure area once associated with a tropical cyclone, or its remnants aloft, are included in this sample. No additional rainfall from pre-existing upper lows as seen before cyclones such as Hurricane Fran of 1996 or from upper cyclones that closed off behind former tropical cyclones such as Hurricane Juan of 1985 was included. [2]

The state of Texas has the highest amounts, followed by Florida, Alabama, North Carolina, and Mississippi. In the western United States, the same can be said for the remnants of Hurricane Kathleen of 1976 in California, and the remnants of Tropical Storm Nora of 1997 in Arizona. In addition, some rainfall records across the Midwest occurred during Tropical Storm Candy of 1968. [2]

U.S. Tropical Cyclone Rainfall Accumulations per time frame ShortTermRainfallAccumulations.jpg
U.S. Tropical Cyclone Rainfall Accumulations per time frame

Average and record statistics per time frame for the contiguous United States

To the right is a graphic showing averages and extremes for a 15-year sample of tropical cyclones and their remnants affecting the contiguous United States. The units of the rainfall amounts are in inches, while the time units are in hours. The bars in the graph express the percent of the storm total rainfall, which is defined to be 100 percent in the final column. Note that, on average, as much as one-fourth of the total occurs in 2–3 hours, while half falls within 12 hours, and almost three-quarters of the storm total falls within a 24‑hour period. Cases where a cyclone scraped the coast were not separated out from those that made a more direct landfall. Also, Pacific and Atlantic cases were not separated. This all explains the average storm total of the sample being depressed to 13.34 in (339 mm). On the bottom of the graphic are listed the averages per time frame and the records. The records were mainly set during Tropical Storm Allison of 2001 and Hurricane Danny of 1997. This graphic will be updated as the climatology pushes farther back in time. [3]

United States rules of thumb for forecasting

Kraft rule

During the late 1950s, this rule of thumb came into being, developed by R. H. Kraft. [4] It was noted from rainfall amounts (in imperial units) reported by the first order rainfall network in the United States that the storm total rainfall fit a simple equation: 100 divided by the speed of motion in knots. [5] This rule works as long as a tropical cyclone is moving and only the first order or synoptic station network (with observations spaced about 60 mi (97 km) apart) are used to derive storm totals. Canada uses a modified version of the Kraft rule which divides the results by a factor of two, which takes into account the lower sea surface temperatures seen around Atlantic Canada and the prevalence of systems undergoing vertical wind shear at their northerly latitudes. [6] The main problem with this rule is that the rainfall observing network is denser than either the synoptic reporting network or the first order station networks, which means the absolute maximum is likely to be underestimated. Another problem is that it does not take the size of the tropical cyclone or topography into account.

Eight inch or 203 mm rule

Rusty Pfost, now the head of the Miami National Weather Service Forecast Office, did a study in 1999 reviewing rainfall totals from tropical systems affecting Florida between 1960 and 1998. He found that for tropical cyclones moving at greater than 6 knots, the average storm total was normally in the 510 inch (127254 mm) range. Slower moving storms usually forced greater than 15 in (380 mm) of rain to fall. [5]

Sixteen inch or 406 mm rule

U.S. Tropical Cyclone Rainfall Accumulations per time frame ShortTermRainfallAccumulations.jpg
U.S. Tropical Cyclone Rainfall Accumulations per time frame

David Roth, a forecaster at the Hydrometeorological Prediction Center, determined that the average amount for all tropical cyclones impacting the United States was 13.34 in (339 mm) between 1991 and 2005. [7] When removing the storms that grazed the domain, an average of near 16 in (410 mm) was obtained. [8] Using this latter amount appears to work best for systems that experience little vertical wind shear and are of at least average size. Amounts measured in small/midget tropical cyclones showed storm total amounts closer to 6 in (150 mm). Operationally, variations to these amounts are introduced if the cyclone encounters mountain zones, interacts with a nearby front, or the storm is significantly sheared. [5]

See also

Related Research Articles

<span class="mw-page-title-main">1971 Atlantic hurricane season</span> Hurricane season in the Atlantic Ocean

The 1971 Atlantic hurricane season was an active Atlantic hurricane season overall, producing 13 named storms, of which 6 strengthened into hurricanes. The season officially began on June 1, 1971, and lasted until November 30, 1971. These dates conventionally delimit the period of each year when most tropical cyclones form in the Atlantic basin. This season, the first storm, Arlene, developed on July 4, while the last, Laura, dissipated on November 22.

<span class="mw-page-title-main">1973 Atlantic hurricane season</span> Hurricane season in the Atlantic Ocean

The 1973 Atlantic hurricane season was a below average tropical cyclone season overall. Of the 24 tropical or subtropical cyclones which developed, only 8 became named storms, and of those, only 4 became hurricanes, with 1 reaching major hurricane status on the newly implemented Saffir–Simpson hurricane wind scale. This continued the pattern of storm activity from the previous season, as hostile El Niño–Southern Oscillation (ENSO) conditions again hindered tropical cyclogenesis and intensification in the tropical Atlantic Ocean and Caribbean Sea.

<span class="mw-page-title-main">1981 Atlantic hurricane season</span> Hurricane season in the Atlantic Ocean

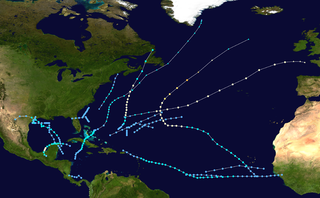
The 1981 Atlantic hurricane season featured direct or indirect impacts from nearly all of its 12 tropical or subtropical storms. Overall, the season was fairly active, with 22 tropical depressions, 12 of which became a namable storm, while 7 of those reached hurricane status and 3 intensified into major hurricanes. The season officially began on June 1, 1981, and lasted until November 30, 1981. These dates conventionally delimit the period of each year when most tropical cyclones form in the Atlantic basin. However, tropical cyclogenesis can occur before these dates, as demonstrated with the development of two tropical depressions in April and Tropical Storm Arlene in May. At least one tropical cyclone formed in each month between April and November, with the final system, Subtropical Storm Three, becoming extratropical on November 17, 1981.

<span class="mw-page-title-main">1957 Atlantic hurricane season</span> Hurricane season in the Atlantic Ocean

The 1957 Atlantic hurricane season featured one of the longest-travelling tropical cyclones in the Atlantic basin, Hurricane Carrie. Nevertheless, the season was generally inactive, with eight tropical storms – two of which went unnamed – and three hurricanes, two of which intensified further to attain major hurricane intensity. The season officially began on June 15 and ended on November 15, though the year's first tropical cyclone developed prior to the start of the season on June 8. The final storm dissipated on October 27, well before the official end of the season. The strongest hurricane of the year was Carrie, which reached the equivalent of a Category 4 hurricane on the Saffir–Simpson hurricane scale on two separate occasions in the open Atlantic; Carrie later caused the sinking of the German ship Pamir southwest of the Azores, resulting in 80 deaths.

<span class="mw-page-title-main">Tropical cyclone rainfall climatology</span>

A tropical cyclone rainfall climatology is developed to determine rainfall characteristics of past tropical cyclones. A tropical cyclone rainfall climatology can be used to help forecast current or upcoming tropical cyclone impacts. The degree of a tropical cyclone rainfall impact depends upon speed of movement, storm size, and degree of vertical wind shear. One of the most significant threats from tropical cyclones is heavy rainfall. Large, slow moving, and non-sheared tropical cyclones produce the heaviest rains. The intensity of a tropical cyclone appears to have little bearing on its potential for rainfall over land, but satellite measurements over the last several years show that more intense tropical cyclones produce noticeably more rainfall over water. Flooding from tropical cyclones remains a significant cause of fatalities, particularly in low-lying areas.

<span class="mw-page-title-main">Tropical Storm Frances (1998)</span> Atlantic tropical storm in 1998

Tropical Storm Frances caused extensive flooding in Mexico and Texas in September 1998. The sixth tropical cyclone and sixth named storm of the annual hurricane season, Frances developed from a low pressure area in the Gulf of Mexico on September 8. The cyclone moved northward through the western Gulf of Mexico, making landfall across the central Texas coastline before recurving across the Midwest through southeast Canada and New England. A large tropical cyclone for the Atlantic basin, yet an average sized system by western Pacific standards, the storm produced heavy rains across the Isthmus of Tehuantepec, Texas, western Louisiana and the Great Plains.

<span class="mw-page-title-main">Mexico tropical cyclone rainfall climatology</span>

Mexico tropical cyclone rainfall climatology discusses precipitation characteristics of tropical cyclones that have struck Mexico over the years. One-third of the annual rainfall received along the Mexican Riviera and up to half of the rainfall received in Baja California Sur is directly attributable to tropical cyclones moving up the west coast of Mexico. The central plateau is shielded from the high rainfall amounts seen on the oceanward slopes of the Sierra Madre Oriental and Occidental mountain chains.

<span class="mw-page-title-main">Tropical Storm Candy</span> Atlantic tropical storm in 1968

Tropical Storm Candy produced minor impact in the state of Texas during the 1968 Atlantic hurricane season. The third tropical cyclone of the annual season, it developed from a tropical disturbance in the southwestern Gulf of Mexico on June 22. Gradual strengthening occurred, with the depression becoming Tropical Storm Candy on the following day. The storm reached its peak intensity of 70 mph (110 km/h) later that day and made landfall Port Aransas, Texas on June 23. Candy weakened into a tropical depression only hours after moving inland. However, the system remained a designated cyclone until June 26, at which time it completed extratropical transition over the state of Michigan.

References

  1. Kristen L. Corbosiero; Michael J. Dickinson & Lance F. Bosart (2009). "The Contribution of Eastern North Pacific Tropical Cyclones to the Rainfall Climatology of the Southwest United States". Monthly Weather Review . 137 (8). American Meteorological Society: 2415–2435. Bibcode:2009MWRv..137.2415C. doi: 10.1175/2009MWR2768.1 . ISSN   0027-0644.
  2. 1 2 David M. Roth (2009-09-15). "Maximum Rainfall Caused By Tropical Cyclones and Their Remnants Per State (1961-2009)". Hydrometeorological Prediction Center . Retrieved 2010-01-21.
  3. Roth, David (2007-01-01). "Tropical Cyclone Rainfall Data". Hydrometeorological Prediction Center Home Page. National Weather Service . Retrieved 2007-01-13.
  4. Frank Marks. WSR-88D Derived Rainfall Distributions in Hurricane Danny (1997). Retrieved on 2007-04-13.
  5. 1 2 3 Norman W. Junker. Hurricanes and Extreme Rainfall. Retrieved on 2007-03-15.
  6. David M. Roth Tropical Cyclone Rainfall (July 2007 presentation). Retrieved on 2007-07-19.
  7. David Roth. Tropical Cyclone QPF. Archived 2007-09-27 at the Wayback Machine Retrieved on 2007-03-15.
  8. David Roth. Developing a Recent Tropical Cyclone Rainfall Climatology For the United States. 25th Conference on Hurricanes and Tropical Meteorology. American Meteorological Society, 2002.