Water supply and sanitation in Peru

Last updated
Water supply and sanitation in Peru
Flag of Peru.svg
Data
Access to an improved water source 85% [1]
Access to improved sanitation 71% [1]
Share of collected wastewater treated22% (2004)
Continuity of supply71% [2]
Average urban water use (L/person/day)259
Average urban water and sanitation tariff (US$/m3)0.38
Share of household metering50%
Annual investment in WSSUS$6/capita
Share of self-financing by utilitiesvery low
Share of tax-financingn/a
Share of external financingn/a
Institutions
Decentralization to municipalitiesFull, since 1990
National water and sanitation companyNone
Water and sanitation regulatorYes
Responsibility for policy settingMinistry of Housing, Construction and Sanitation
Sector lawYes (1994 and amended subsequently)
No. of urban service providers50 companies and 490 municipalities
No. of rural service providers11,800

The water and sanitation sector in Peru has made important advances in the last two decades, including the increase of water coverage from 30% to 85% between 1980 and 2010. Sanitation coverage has also increased from 9% to 37% from 1985 to 2010 in rural areas. [3] Advances have also been achieved concerning the disinfection of drinking water and in sewage treatment. Nevertheless, many challenges remain, such as:

Contents

Access

Access to water and sanitation increased during the last decades. Political efforts to increase access include the program Agua para todos which started in 2006 under President Alan García (see below).

Joint Monitoring Program

According to the Joint Monitoring Program (JMP) by WHO and UNICEF the coverage of improved drinking water service was 85% and 71% had access to improved sanitation in 2010. Access increased from 75% concerning water and 54% concerning sanitation in 1990. In 2010, urban coverage was 91% for water and 81% for sanitation. In rural areas coverage of drinking water was 65% and sanitation 37%. [1]

Access to Water and Sanitation in Peru (2010) [1]
Urban
(77% of the population)
Rural
(23% of the population)
Total
Water Total Improved 91%65%85%
Piped on premises83%46%74%
Sanitation Improved sanitation 81%37%71%
Shared9%3%8%
Open defecation1%28%7%

National figures

According to the Peruvian National Statistics and Informatic Institute (Instituto Nacional de Estadística e Informática - INEI), about 73% of the population had access to drinking water supply in 2009, while about 57% had access to sewerage. [4] In the framework of the development plan Plan Bicentenario it is envisaged to increase water supply coverage to 85% and access to sewerage to 79% by 2021. [5]

Social access

Parts of Peru are located in vast deserts, limiting water accessibility. While there has been an emphasis within the country on improving infrastructure to increase water access and restore watersheds, [6] much of Peru still remains under-served, with over 1.5 million people estimated to have no running water in their homes. [7] [8] A 2015 UN Water Global Analysis and Assessment of Sanitation and Drinking Water report stated that Peru has made significant improvements within the last fifteen years to promote sanitation and improve access to water. [9] Water access, however, is still unequal; some Peruvians pay 1.3 sols (.40 USD) for one cubic meter of running water, while poorer citizens who rely on water delivery trucks to bring them their resources pay around 20 sols ($6 USD) for one cubic meter of running water, an over 1500% increase. [10] Water delivered in Peru tends to be unsanitary and non-potable. However, wealthier citizens are more easily able to treat water in their homes, while poorer citizens often lack the resources to properly treat their water. [10]

Service quality

In a national survey conducted in 2008, 64% of respondents indicated that they were satisfied with the quality of the water they received. Those who were not satisfied complained about turbidity, high levels of chlorine, bad taste and bad smell. This figure apparently does not include the level of satisfaction related to the continuity or pressure of water supply.

Continuity of water service

Urban areas received water service for an average of 17 hours per day in 2005. [2] Only one Peruvian service company has continuous service, the company EMSAP in the Amazon region. [11]

Back in 1997, the total continuity average was at 12 hours per day, 5 hours less than in 2005. Rural areas averaged 18 hours, while in urban areas, service was provided on average for 12 hours. Service averaged 8 hours on the coast, 18 hours in forested and mountainous regions, and 10 hours in metropolitan Lima. [12]

Disinfection

In 2000, 80% of urban water supply systems used disinfection measures. [13] In urban areas, 43 companies that provided information to the regulator complied with the norms for residual chlorine in the network.

In rural areas, however, in a sample consisting of 1,630 analyzed systems, 59% do not disinfect the water because of lacking the necessary facilities or the lack of chlorine. Considering that locations with less than 2,000 inhabitants have around 11,800 systems, it can be estimated that around 7,000 rural water systems provide water without disinfection. [14]

Wastewater treatment

The share of treated wastewater in 2004 was estimated at 22%. This is to say that more than three fourths of the wastewater generated did not receive any type of treatment prior to its final discharge, which poses a serious threat to the environment. [15] Back in 1997, the coverage of wastewater treatment had only been 13%. [16] In 2005, only two companies treated all of their sewage, one of them being from the Provincia de Marañón. [11]

The great majority of sewage of the Lima-Callao metropolitan area is discharged without treatment into the ocean, resulting in serious contamination of the surrounding beaches. The Japanese Bank of International Cooperation (JBIC) provided a loan for the sanitation of the Lima-Callao area in 1997. [17] However, the project was not implemented.

In 2013 the Taboada wastewater treatment plant was commissioned in Lima. With a capacity of 1,8 million cubic meters/day it is the largest wastewater treatment plant in South America. It was privately financed as a Build-Operate-Transfer (BOT) project by the Spanish firm Técnicas de Desalinización de Aguas (Tedagua). It is envisaged that some of the treated water will be used for the irrigation of urban parks. [18] Financing for another wastewater treatment plant in La Atarjea has been secured in February 2014 through a 48,66 million Euro loan from the German development bank KfW. The treated waster will be reused for irrigation after being discharged into an existing irrigation canal.

Water resources and impact of climate change

On average, surface water in Peru is abundant. Nevertheless, it is unequally distributed in space and time. Especially the coastal area, where the country's major cities are located and two thirds of the population live, is very dry. Lima with 8 million people, is the world's second largest city located on a desert (after Cairo).

The peaks of the Andes are the source of many Peruvian rivers. Alpamayo.jpg
The peaks of the Andes are the source of many Peruvian rivers.

Peru contains over two-thirds of all tropical glaciers [19] which provide important water sources for the dry western half of the country. These glaciers are rapidly melting as a result of climate change, [19] making the flow of rivers more irregular, leading to more droughts and floods. A report by a team from the World Bank published in June 2007 in the bulletin of the American Geophysical Union (AGU) predicts that many of the lower glaciers in the Andes will be gone in the next decade or so, and that glacial runoff may dry up altogether within 20 years. The last comprehensive satellite survey by Peru's National Environmental Council, carried out in 1997, found that the area covered by glaciers had shrunk by 22% since the early 1960s. Partial surveys by geologists suggest that the rate at which the glaciers are melting has sped up over the past decade. [20] Additionally, as these glaciers rapidly melt, they also expose the water to contaminants in the glaciers, such as lead and cadmium, making it unsafe to consume,

[21]

For example, the Quelccaya Ice Cap is the second largest in the Peruvian Andes and has shrunk by 30% in the last 33 years. Streams fed by glaciers and rainwater provide water further downstream.

Parts of Peru are in arid, dry desert-like conditions, which in turn have created a drought-like situation. As global temperatures increase, these areas are at higher risk of not obtaining steady access to water in already limited amounts. [22] This is seen in Peru in the primarily Northern part of the country where there is much more desert-like conditions,

Sustainability

Discussed in Treehugger magazine, there is a sustainability sweet spot, in which a nation has a high level of human development cross-checked with ecologically sustainable use of resources. Peru is one of the very few countries falling into this sweet spot. The sustainability methods of Peru is a relatively modern ideology that has not been thought about in the grand scheme of time. Peru is able to pursue a method of sustainability since it has a large amount of readily available natural resources, as opposed to other countries that rely heavily on imports for mass amounts of natural resources. [23] It is also important to understand how sustainable Peru's future water resources will remain as climate change progresses and rapidly affects the water supply. For example, the Rimac, Chillon, and Lurin River are all central to Peru's water supply, and are not equipped to handle the growing population. [8] As it stands, there are no current plans by the government to deal with this issue.

Sustainability generally refers to the capacity for earth's biosphere and human civilization to coexist. Sustainability is a vital aspect of the WASH sector in development because it conserves the environment, is cost friendly, and promotes healthier development practices. The National Environmental Policy Act of 1969 committed the United States to sustainability, declaring it a national policy "to create and maintain conditions under which humans and nature can exist in productive harmony, that permit fulfilling the social, economic, and other requirements of present and future generations". [24] Institutional sustainability in the WASH sector means that WASH systems, institutions, policies, and procedures at the local level are functional and meet the demand of users of WASH services. [25] The element of environmental sustainability implies placing WASH interventions in the wider context of the natural environment and implementing an approach of integrated and sustainable management of water and waste(-water) flows and resources. [25]

Water use

In 2005, an average of 259 liters/person/day of water were produced in urban areas. Actual water consumption is much lower than this level due to distribution losses estimated around 45%. Per capita water production has decreased by 26% since 1997 when production was at 352 liters/person/day. This decrease may be partly due to an increase in the share of metered users from 24% to 47% (1997–2005). According to the National Sanitation Plan, it is inadmissible that with such high levels of production water supply remains intermittent in many cities. [2]

In rural areas, water use is much lower than in urban areas.

According to a 2008 national survey by the radio station RPP and the World Bank's Water and Sanitation Program (WSP), 38% of respondents indicate that they "take great care" of water in the household. 89% of respondents indicated that they treat tap water before drinking it, primarily by boiling it, and 48% store water in their house because of intermittent supply or because they have no access to piped drinking water. [26]

History

Pre-colonial and colonial water infrastructure

Prior to Spanish colonization, the indigenous people of Peru managed their water using surface catchments and artesian wells, as well as subterranean aqueducts (puquios) and sewer systems. [27] Roughly 1,700 years old, some of these aqueducts are still in use in the Nazca region; as of 2019 they were under consideration as a World Heritage Site. [28]

The arrival of Spanish conquistadors in the mid-1500s left existing systems largely unchanged, as the Spanish themselves made use of the indigenous systems. [27] However, indigenous infrastructure was put under strain as population centers grew along the dry western coast of Peru; additionally, under colonial policy surplus water withdrawals were encouraged to aid gold and silver mining (as opposed to agriculture). [27] This marked the beginning of the mining industry’s heavy water consumption in Peru, which continues to be a point of high contention in the modern nation’s water sector. [27]

Over the course of the following centuries, rural areas preserved a mix of colonial and indigenous water practices while urban centers like Lima continued to develop along the European model. [27] After the establishment of the independent Peruvian state in 1821, conveyance pipes for drinking water began to be installed throughout Peru, slowly displacing the manual water porter and self-dug wells; the first potable water disinfection plant was installed in Lima in 1917. [27] However waste was still collected in open ditches, and the investments in infrastructure were not organized. [27]

The 20th and 21st centuries

The institutional framework for the water and sanitation sector has undergone many successive changes, including some reforms that were never implemented and some that considerably changed the responsibilities in the sector. Two reforms that had a lasting impact were the transfer of the responsibility for water supply and sanitation from municipalities to the national government in the late 1960s and the creation of a national water holding company in 1981 consisting of utilities in the large cities. In 1990, the government gave service responsibility in urban areas back to the municipalities. The new government of Fujimori introduced a policy of promoting the private sector and of commercializing the municipal utilities. In 1994 an autonomous regulatory agency was created at the national level. In the meantime the program to promote the private sector stalled: Only in 2005 the first and so far only water concession in Peru was awarded in the city of Tumbes.

From municipal service provision to a national holding company

In the beginning of the 1960s, the municipalities had the responsibility of providing water and sanitation services. However, this responsibility was transferred to the Ministry of Housing and Construction in most urban areas towards the end of the decade. In rural areas, investments were realized through the Ministry of Public Health. The systems, once built, were handed over to community-based organizations for operation and maintenance. [29] In the 1970s, the large cities of Lima, Arequipa and Trujillo created their own Water and Sanitation Companies. [30]

Cusco Cusco-c02.jpg
Cusco

In 1981, the government of Fernando Belaúnde Terry merged the three Sanitation Companies of Lima, Arequipa, and Trujillo and the General Directorate for Water and Sanitation of the Ministry of Housing and Construction in a single national state holding company, the National Service of Water and Sewage Supply (SENAPA). SENAPA was composed of 15 constituent companies and 10 operational units. SEDAPAL in Lima was the largest one. 200 cities (20%) were left out of SENAPA and administered their own services.

The Government of Alan García (1985–1990) passed a law that transferred the functions related to rural water and sanitation construction and technical assistance to regional governments. With the change in government in 1990, these changes did not materialize, as the regionalization stalled. [31]

Decentralization and commercialization

During the 1990s, the water and sanitation sector was decentralized again. In May 1990, the outgoing government of Alan García decided to transfer all SENAPA constituent companies and operational units to the municipalities. SENAPA was to be converted into a company in charge of only giving technical assistance to the municipalities, a decision that was never implemented. [29]

The Government of Alberto Fujimori (1990–2000) initiated another restructuring of the sector with the objectives of commercializing and privatizing the service providers. [30] In 1991, the government enacted the Private Investment Promotion Law for water and sanitation. In 1992, the National Water and Sewage Program (PRONAP) was created. SENAPA and SEDAPAL were placed under the direct authority of the President. In 1994, a new law was passed that created the legal figure of the municipal utility (EPS) as an entity that is legally and financially separate of the municipality. [32] More than ten years later, in 2005, the Water and Sanitation Program of the World Bank called the commercialization of municipal water utilities in the interior of the country a "silent reform in the sector". [33]

The General Law of the National Superintendence of Sanitation Services (SUNASS) was passed in 1994. [29] A tariff restructuring with the objective of achieving financial viability of the EPS was carried out in parallel. Despite the government's expectations, no single public-private partnership in water supply and sanitation was put in place during the Fujimori government and all service providers remained public. Only in October 2005 the first water and sanitation concession contract in Peru was signed in the province of Tumbes. The 30-year concession was awarded after open bidding to a Peruvian-Argentine consortium, Latinaguas-Concyssa. [34] The interventions under the concession were to be financed with the support of a loan and grant from the German development bank KfW. [35]

In La Libertad Region the public company for water supply and sanitation is SEDALIB which is formed by shareholders of municipalities of the Region.

Reassertion of state ownership

In 2009, a new water law reasserted the state's ownership of national water resources, affirming the government's absolute power in deciding where and by whom water is used. [36] This affirmation resulted in a renewed push for centralized infrastructure via public-private partnerships, with corporations building and operating for an initial period before ownership is re-assumed by the state. [37]

Water policy and regulation

Policy

Casa de Pizarro is the official residence of the President. PalacioEjecutivodelPeru.jpg
Casa de Pizarro is the official residence of the President.

The Ministry of Housing, Construction, and Sanitation is the sector governing entity through the Vice Ministry of Construction and Sanitation (VMCS) and the National Sanitation Board (DNS). [38] The Ministry formulates, approves, executes and supervises the application of the national water and sanitation policies. The Ministry was created on June 11, 2002, through the Organic Law #27779. [39]

Various drafts of a General Water Law for water resources management have been in discussion for two decades. Nevertheless, no law has been approved up to now.

Regulation

The sector regulating entity is the National Sanitation Services Supervisory (SUNASS), created by law in 1992. Its functions are to regulate and supervise service providers, approve tariffs, establish norms, impose sanctions for violations of the law, and resolve user controversies and complaints. As part of its supervision activities SUNASS has established a benchmarking system to monitor the performance of service providers.

SUNASS is funded through a 2% surcharge on water bills with an annual budget of approximately US$4 million. According to the law, it enjoys administrative and financial autonomy. [40] Its Board consists of five members nominated as follows:

Provision of services

Arequipa Arequipa-plaza-armas-c01.jpg
Arequipa

The Peruvian Constitution of 1993 bestows the responsibility of water and sanitation service provision to the city councils. The Ley Orgánica de Municipalidades (Law Nº 27972) states that the function of the provincial municipalities is to directly or by concession administer and regulate the water service, sewage, and drainage. Peru has 194 provincial city councils. [41]

The service providers in the country are:

When mayors change in Peru this often leads to the removal of the general manager of the municipal service provider (EPS) or of the head of the municipal department in charge of water supply in smaller municipalities that do not have an EPS. In 1999 it was estimated that the EPS changed general managers on the average every 17 months. [43] This happens although the majority of the EPS are made up of several provincial municipalities, which in theory should decrease the influence of city governments and reduce the political interference in the administration of companies.

Nearly all of the country's service providers remain weak in financial and institutional aspects, as well as in human resources, despite attempts to strengthen them.

Support to Communal Organizations

A key function in the water and sanitation sector that is frequently neglected is the support to communal organizations that provide services, mainly in rural areas. This function can be assigned to municipalities, EPS, or to national entities with departmental filiations.

The WHO observed that in 2000 the municipal participation in assistance to rural services was insufficient to different extents, ranging from its total exclusion to the need for support in the preparation of the technical records and the complete integration in the planning, financing, and construction supervision processes. [13]

The regional governments have technical and financial supporting functions (also see Peru Regulation). [44] The 24 separate Regional Boards of Housing, Construction, and Sanitation – one in each department – support them in this role.

Many interventions in rural areas during the 1990s were made without verifying the community demand and without their contributions to the execution of the projects. This resulted in overly designed systems that the communities did not maintain thus leading to loss of public funds. [45]

Since 2002, the PRONASAR project supports the Administrative Assemblies of Sanitation Services (JASS) directly and through NGOs as well as municipalities. [46]

Other functions

The Ministry of Health (MINSA) is also participating in the sector through the General Director's Office of Environmental Health (DIGESA) and the Executive Director's Office on Basic Sanitation (DESAB), entities which exert functions in the aspects pertaining to sanitary and water quality for human consumption and the protection of a healthy environment.

Other institutions which act and participate in the sector are the Ministry of Economy and Finances (MEF) that specifically interferes in the aspects of economic sectoral and normative planning related to finances; several NGOs and the private sector, among others.

The National Cooperation Fund for Social Development (FONCODES), created in 1991, channels resources to investing in marginalized rural and urban areas in various sectors including potable water and sanitation. Within the framework of the state decentralization process, since October 2003, FONCODES transfers resources to the district city councils verified for social infrastructure projects, offering technical assistance and contributes to the capacity building for the responsible handling of social investments. The FONCODES depends on the Ministry of Women and Social Development (MIMDES). Since the beginning of PRONASAR, FONCODES has retired from water and sanitation activities in rural areas.

Some 46 service providers have formed the National Peruvian Association of Sanitation Service Providers (ANEPPSA) to "promote the excellence in sanitation services management" through training and exchange of experiences.

Ongoing public-private partnerships

In 2006-07 nine small towns (between 5,000 and 25,000 inhabitants) across Peru introduced a new water and sanitation management model, under which the community is being more empowered, including through deciding themselves about a certain level of service quality, such as low-cost technologies, and corresponding tariffs. Subsequently the municipality hires a specialized operator who is being regulated by a Community Supervision Board under a Public-Private-Social Partnership. The specialized operator can be a private or a mixed company. The aim of the new approach was to break with the low-level equilibrium of poor service quality and poor cost recovery that prevails throughout small towns in Peru, under which poor quality water services are provided directly by the municipality. The new approach was supported through the Small Town Pilot Project (STPP) of the Ministry of Housing, with technical support from the World Bank's Water and Sanitation Program (WSP) and financial support of US$6.6 million from the Canadian International Development Agency for limited infrastructure investments and training for both the operator and members of the Community Supervision Boards. After the municipal elections of 2007, 3 new mayors decided to abandon the new approach and to return to the old model of direct municipal management. In the 6 other cities specialized operators continue to operate. [47]

"Agua para todos" (2006)

In September 2006, the new President Alan García announced an ambitious investment plan for the water and sanitation sector called Agua para todos (that is, water for everyone), promising water access to all Peruvians – mainly to the poorest – by the end of his mandate. However, as of 2020, there have been no further developments on this proposed plan. Currently, water delivery projects by the Peruvian government involve partnerships with NGOs such as the non-profit also called "Water for Everyone". [48]

EcoSwell

Founded in 2013, the NGO EcoSwell works on water and sanitation projects across Peru (amongst other sectors of work); they are based in the northwestern Lobitos district of the Talara region, an arid coastal area that faces water stress. [49] To combat the challenges of derelict infrastructure and environmental degradation [49] , EcoSwell primarily constructs physical WASH projects with the help of local residents and interns, including bio-remediation for wastewater management, dry toilets, grey water reuse, desalination, and groundwater monitoring. [50] Their bottom-up approach to community mobilization focuses on the long-term sustainability of Peru's ecology, with a commitment to a steady-state economy. [51]

Economic efficiency

It is estimated that 45% of the water produced is not counted due to physical and commercial losses, which is higher than the other 40% average of Water and sanitation in Latin America. This coefficient has not changed a lot during the last 12 years. [52] The highest levels are detected in the provinces of Marañón and Barranca (greater than 70%). Some companies had water levels not accounted for at less than 10%, however, these values do not seem viable given the low level of household metering (50%). [53]

Financial aspects

Water tariffs in Peru are somewhat low compared to other Latin American countries and water bills are often not paid. As a result, according to an estimate, 95% of the country's urban service providers can be considered bankrupt. In many urban areas it is common to spend significant sums to water tanker operators, which are prevalent because of intermittent supply and deficient coverage. In rural areas, tariffs are even lower than the already low tariffs in urban areas, making it impossible to properly maintain water systems.

Urban areas

Tariffs In 2004, water tariffs in Peru were on average Sol 1.29/m3 (US$0.38/m3) in urban areas. [54] Average urban tariffs increased slightly from Sol 1.04/m3 in 1997 (US$0.40/m3 with 1997 monetary values) to Sol 1.45/m3 in 2000 (US$0.42/m3), however dropped in real terms thereafter. [16] Each provider has its own tariffs, with significant differences between them, ranging from Sol 0.45/m3 in Valle del Mantaro (US$0.14/m3) to Sol 2.60/m3 in Ilo (US$0.79/m3) in 2005. [53]

Users in urban areas that do not have access to piped water pay much higher prices for water from water tankers.

According to a 2008 national survey by Radio RPP, respondents indicated that, on average, they paid 44 Soles (close to US$15) per month and per household for water. [55] 44% of respondents said that they paid "much or too much" for water. [56]

Cost recovery In 1999, water companies billed only 55% of the produced water and of this value only 50% was actually paid. Payment arrears were equivalent to 140 days of billed revenues. [43]

There are significant differences in levels of cost recovery among service providers. For example, SEDAPAL had an operating margin of 35% in 2000, while the EPS had an average operating margin of only 16%. 6 out of 46 EPS had a negative operating margin. [57]

Only five years later in 2005, according to the World Bank's Water and Sanitation Program, no more than 5% of the EPS and of the municipalities had the financial capacity to carry out their functions. The rest are considered financially bankrupt. [33] In the same year, the government decided to apply a new tariff regulation model. [58] The government contracted studies for the elaboration of this model with the support from the Public-Private Infrastructure Advisory Facility (PPIAF), a World Bank trust fund, and later from the IDB.

Rural areas

In rural areas, the water committees apply fixed monthly tariffs independently of use as the use of water meters is not common in these areas. The tariff is estimated to be the equivalent of US$0.50/month and household. [59] At a consumption of 20 cubic meter per month and household this corresponds to US$0.025 per cubic meter, or about 15 times less than the average tariff in urban areas. Needless to say, the revenues generated are insufficient for the operation and maintenance of the systems.

Ability to Pay

In 1997, the average the Peruvian household spent 1.8% of their total expenses in water, including water bought from carro-tanques, but without spending in sanitation. In urban areas they spent 1.9% of the expenses for water and only 0.8% in rural areas. The poorest (first decil) spent 2.4% in urban areas and 1.7% in rural areas. [60]

Investments and financing

As shown in the bar chart below, investment levels increased substantially during much of the 1990s, from US$39 million in 1990 to a peak of US$422 million in 1997. Since then investments have declined again to US$106 million in 2004 and US$190 million in 2005. Total investment between 1990 and 2005 was at US$43.3 billion, the average being at US$205m p.a. [61] Investments are financed through programs providing subsidies to municipal utilities, as well as to a limited extent by internal cash generation and debt.

Water supply and sanitation in Peru

In the 1990s

Between 1990 and 1998, an annual average of US$228.9 million was invested for water and sanitation infrastructure, equivalent to 0.5% of the GDP. In this period the investments in the sector increased from US$1.1/per capita in 1990 to US$15/per capita in 1998, the latter being an unusually high investment level compared to other Latin American countries. [13] [33] These investments were financed as follows:

  • 26% by SEDAPAL, financed by internal cash generation and debt;
  • 17% by grants from the central government through the Social Fund FONCODES, destined primarily at rural areas,
  • 10% by grants through the Program for the Support of Water Sector Reform (PARSSA), destined primarily at provincial cities;
  • 22% by municipal companies, municipalities and NGOs;
  • 23% by debt from the National Housing Fund FONAVI; and
  • 2% by the Southern Zone Lima Metropolitan Sewer System Improvement Project (MESIAS), a project to improve the sanitary conditions of southern Lima, reducing the coastal contamination from wastewater. [62]

In 2000 total debt contracted by service providers stood at US$1.15 billion, equivalent to the operating margin of all service providers over 9 years. 46% of this debt contributed to reimbursable contributions by the National Housing Fund FONAVI. [63]

2000-2005

The period between 2000 and 2005 witnessed investments of US$833.1 million (US$166.6 million/year) in the sector, carried out by the following entities: [64]

ProgramShare of investment
SEDAPAL45%
PARSSA14%
MESIAS12%
EPS10%
Municipalities7%
FONCODES7%
Others5%
Total100%
Plaza de Armas in the city of Piura Piura Plaza de Armas.jpg
Plaza de Armas in the city of Piura

Future investments

The government's draft National Sanitation Plan considers that investments of US$4,789 million would be needed in 2005-2015 (US$497 million/year) to achieve the Millennium Development Goals in the sector. [65]

However, billions more would be needed to divert water along tunnels beneath the Andes if glacial melting accelerates. [20]

External cooperation

Multilateral financial institutions including the World Bank, the Inter-American Development Bank, and the Andean Development Corporation (CAF) as well as bilateral cooperation agencies (the German KfW and GTZ, the Canadian CIDA, and the Japanese JICA (ex-JBIC), among others) play an important role in investment financing and in technical assistance in the sector.

Assistance to segments of the sector, differentiated by the size of localities, is provided by different donors:

An example of this support is the agreement signed in September 2009 by the Japan International Cooperation Agency (JICA) to provide a loan for up to $60 million for the North Lima Metropolitan Area Water Supply and Sewerage Optimization Project. The purpose of the project is to improve the quality of water and sanitation services by renovating the water supply network and improving its operation and management. It aims at reducing non-revenue water and increasing the continuity of water supply. [66] The project complements another JICA-supported project to build a water treatment plant, water distribution systems, and sewerage systems in marginal areas of the same place. [67]

See also

Related Research Articles

<span class="mw-page-title-main">Water supply and sanitation in Latin America</span>

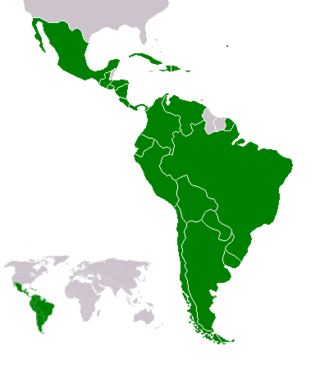
Water supply and sanitation in Latin America is characterized by insufficient access and in many cases by poor service quality, with detrimental impacts on public health. Water and sanitation services are provided by a vast array of mostly local service providers under an often fragmented policy and regulatory framework. Financing of water and sanitation remains a serious challenge.

Water supply and sanitation in Mexico is characterized by achievements and challenges. Among the achievements is a significant increase in access to piped water supply in urban areas as well as in rural areas between 1990 and 2010. Additionally, a strong nationwide increase in access to improved sanitation was observed in the same period. Other achievements include the existence of a functioning national system to finance water and sanitation infrastructure with a National Water Commission as its apex institution; and the existence of a few well-performing utilities such as Aguas y Drenaje de Monterrey.

Drinking water supply and sanitation in Ecuador is characterized by a number of achievements and challenges. One key achievement is a significant increase in both access to an at least basic water source and at least basic sanitation. Significant increases in coverage in urban areas were achieved both by the public utility EMAAP-Q, serving the capital Quito, and the private concessionaire Interagua in the country's largest city Guayaquil. However, municipalities rely overwhelmingly upon central government investment, rather than recouping the costs at a local level. Another problem is intermittent water supply, which affects half of the urban areas. Also, only 8% of all collected wastewater is being treated. The level of non-revenue water is estimated at 65%, one of the highest in Latin America. Addressing these challenges is complicated by the atomization of the sector: A multitude of stakeholders – the Ministry of Housing, the Emergency Social Investment Fund, the Solidarity Fund, the State Bank, NGOs, municipalities and others – intervene in the sector. Despite the existence of an Interinstitutional Committee for Water and Sanitation there remains room to improve coordination.

Water supply and sanitation in Colombia have been improved in many ways over the past decades. Between 1990 and 2010, access to improved sanitation increased from 67% to 82%, but access to improved water sources increased only slightly from 89% to 94%. In particular, coverage in rural areas lags behind. Furthermore, despite improvements, the quality of water and sanitation services remains inadequate. For example, only 73% of those receiving public services receive water of potable quality and in 2006 only 25% of the wastewater generated in the country underwent any kind of treatment.

Access to drinking water and sanitation in El Salvador has been increased significantly. A 2015 conducted study by the University of North Carolina called El Salvador the country that has achieved the greatest progress in the world in terms of increased access to water supply and sanitation and the reduction of inequity in access between urban and rural areas. However, water resources are heavily polluted and the great majority of wastewater is discharged without any treatment into the environment. Institutionally a single public institution is both de facto in charge of setting sector policy and of being the main service provider. Attempts at reforming and modernizing the sector through new laws have not borne fruit over the past 20 years.

<span class="mw-page-title-main">Water supply and sanitation in Chile</span> Municipal water infrastructure in Chile

Water supply and sanitation in Chile were once considered efficient and equitable but in 2022 Chile struggled to reliably provide water throughout the country. Chile's water resources have been strained by the Chilean water crisis, which was partially caused by a continuing megadrought that began in 2010, along with an increased demand for agricultural and other commercial interests.

Access to at least basic water increased from 94% to 97% between 2000 and 2015; an increase in access to at least basic sanitation from 73% to 86% in the same period;

Drinking water supply and sanitation coverage in Honduras has increased significantly in the last decades. However, the sector is still characterized by poor service quality and poor efficiency in many places. Coverage gaps still remain, particularly in rural areas.

Drinking water and sanitation in Nicaragua are provided by a national public utility in urban areas and water committees in rural areas. Despite relatively high levels of investment, access to drinking water in urban areas has barely kept up with population growth, access to urban sanitation has actually declined and service quality remains poor. However, a substantial increase in access to water supply and sanitation has been reached in rural areas.

<span class="mw-page-title-main">Water supply and sanitation in Argentina</span>

Drinking water supply and sanitation in Argentina is characterized by relatively low tariffs, mostly reasonable service quality, low levels of metering and high levels of consumption for those with access to services. At the same time, according to the WHO, 21% of the total population remains without access to house connections and 52% of the urban population do not have access to sewerage. The responsibility for operating and maintaining water and sanitation services rests with 19 provincial water and sewer companies, more than 100 municipalities and more than 950 cooperatives, the latter operating primarily in small towns. Among the largest water and sewer companies are Agua y Saneamientos Argentinos (AYSA) and Aguas Bonarenses S.A. (ABSA), both operating in Greater Buenos Aires, Aguas Provinciales de Santa Fe, and Aguas Cordobesas SA, all of them now publicly owned. In 2008 there were still a few private concessions, such as Aguas de Salta SA, which is majority-owned by Argentine investors, and Obras Sanitarias de Mendoza (OSM).

Bolivia's drinking water and sanitation coverage has greatly improved since 1990 due to a considerable increase in sectoral investment. However, the country continues to suffer from what happens to be the continent's lowest coverage levels and from low quality of services. Political and institutional instability have contributed to the weakening of the sector's institutions at the national and local levels. Two concessions to foreign private companies in two of the three largest cities—Cochabamba and La Paz/El Alto—were prematurely ended in 2000 and 2006 respectively. The country's second largest city, Santa Cruz de la Sierra, relatively successfully manages its own water and sanitation system by way of cooperatives. The government of Evo Morales intends to strengthen citizen participation within the sector. Increasing coverage requires a substantial increase of investment financing.

Water supply and sanitation in Venezuela is currently limited and many poor people remain without access to piped water. Service quality for those with access is mixed, with water often being supplied only on an intermittent basis and most wastewater not being treated. Non-revenue water is estimated to be high at 62%, compared to the regional average of 40%. The sector remains centralized despite a decentralization process initiated in the 1990s that has now been stalled. Within the executive, sector policies are determined by the Ministry of Environment. The national water company HIDROVEN serves about 80% of the population.

Costa Rica has made significant progress in the past decade in expanding access to water supply and sanitation, but the sector faces key challenges in low sanitation connections, poor service quality, and low cost recovery.

The Dominican Republic has achieved impressive increases in access to water supply and sanitation over the past two decades. However, the quality of water supply and sanitation services remains poor, despite the country's high economic growth during the 1990s.

<span class="mw-page-title-main">Water supply and sanitation in Jamaica</span>

Water supply and sanitation in Jamaica is characterized by high levels of access to an improved water source, while access to adequate sanitation stands at only 80%. This situation affects especially the poor, including the urban poor many of which live in the country's over 595 unplanned squatter settlements in unhealthy and unsanitary environments with a high risk of waterborne disease. Despite a number of policy papers that were mainly focused on water supply and despite various projects funded by external donors, increases in access have remained limited.

The drinking water supply and sanitation sector in Guatemala is characterized by low and inconsistent service coverage, especially in rural areas; unclear allocation of management responsibilities; and little or no regulation and monitoring of service provision.

Water supply and sanitation in Panama is characterized by relatively high levels of access compared to other Latin American countries. However, challenges remain, especially in rural areas. Panama has a tropical climate and receives abundant rainfall, yet the country still suffers from limited water access and pollution. Intense El Niño periods, periodic droughts, reduce water availability. Multiple factors like urbanization, impacts of climate change, and economic development have decreased water resources. The high frequency of floods in recent years and the lack of corresponding measures resulted in tension among the local population. Rapid population growth in recent decades led to an unprecedented increase in freshwater demand. Regional inequality exists in water resources and water governance. An estimated 7.5-31% of Panama's population lives in isolated rural areas with minimal access to potable water and few sewage treatment facilities.

While Peru accounts for about four per cent of the world's annual renewable water resources, over 98% of its water is available east of the Andes, in the Amazon region. The coastal area of Peru, with most of economic activities and more than half of the population, receives only 1.8% of the national freshwater renewable water resources. Economic and population growth are taking an increasing toll on water resources quantity and quality, especially in the coastal area of Peru.

<span class="mw-page-title-main">Water supply and sanitation in Benin</span>

Drinking water supply and sanitation in Benin has been subject to considerable progress since the 1990s, in particular in rural areas, where coverage is higher than in many other African countries, and almost all development partners follow a national demand-responsive strategy, which has been adopted in 1992. New strategies to increase water supply in rural and urban areas have been adopted in 2005 and 2006. Tariffs in urban and rural areas are usually high enough to cover the costs for operation and maintenance.

<span class="mw-page-title-main">Water supply and sanitation in Mozambique</span>

Water supply and sanitation in Mozambique is characterized by low levels of access to at least basic water sources, low levels of access to at least basic sanitation and mostly poor service quality. In 2007 the government has defined a strategy for water supply and sanitation in rural areas, where 62% of the population lives. In urban areas, water is supplied by informal small-scale providers and by formal providers.

References

  1. 1 2 3 4 World Health Organization; UNICEF (2010). "Joint Monitoring Program". Archived from the original on 2008-02-16. Retrieved 2011-08-23.
  2. 1 2 3 (in Spanish) National Housing and Water Plan 2006-2015, p. 73
  3. "WHO/UNICEF JMP". Archived from the original on 2014-02-09. Retrieved 2012-07-16.
  4. "Plan Bicentenario: El Perú hacia el 2021". Centro Nacional de Planeamiento Estratégico. July 2011. Retrieved 2011-08-23., p. 78
  5. "Plan Bicentenario: El Perú hacia el 2021". Centro Nacional de Planeamiento Estratégico. July 2011. Retrieved 2011-08-23., p. 56
  6. Ioris, Antonio (2012-11-01). "The persistent water problems of Lima, Peru: Neoliberalism, institutional failures and social inequalities". Singapore Journal of Tropical Geography. 33 (3): 335–350. doi:10.1111/sjtg.12001. hdl: 20.500.11820/83634ef2-ec01-4c69-9633-baef6e857ef9 .
  7. "Thirsty Lima Uses Robust Planning to Address Its Future Water Needs". World Bank. Retrieved 2020-04-26.
  8. 1 2 Ritter, Kayla (2018-06-28). "Water Access In Lima Complicated by Inequality and Climate Uncertainty". Circle of Blue. Retrieved 2020-04-26.
  9. "Peru - Sanitation, drinking-water and hygiene status overview" (PDF). Archived from the original (PDF) on 2021-04-14. Retrieved 2023-08-18.
  10. 1 2 Tegel, Simeon (May 21, 2018). "The World's Looming Dry Taps". U.S. News.
  11. 1 2 (in Spanish) SUNASS gráficos promedio 1
  12. (in Spanish) Evaluation of Peru's National Sanitation Policies 2004
  13. 1 2 3 (in Spanish) WHO/PAHO 2000 Archived 2009-05-15 at the Wayback Machine
  14. (in Spanish) National Housing and Water Plan 2006-2015, p. 76
  15. (in Spanish) National Housing and Water Plan 2006-2015, p. 89
  16. 1 2 (in Spanish) SUNASS: evolution of indicators, 2005
  17. Japan Bank for International Cooperation (JBIC) - List of projects
  18. "Taboada WWTP, Peru". Global Water Intelligence, February 2014.
  19. 1 2 Climate change and tropical Andean glaciers: Past, present and future
  20. 1 2 "When Ice turns to water", The Economist, July 12, 2007
  21. Miller, Ben; Sweigart, Emilie (October 21, 2019). "How Countries Manage Water: Peru". www.americasquarterly.org. Retrieved 2020-04-26.
  22. Dupre, Brandon (23 April 2018). "Lobitos: How Peru's Secret Surf Spot Has a Dark Past". Culture Trip. Retrieved 2020-04-26.
  23. "Peru: The Only Nation in the World Hitting the Sustainability Sweet Spot". TreeHugger. Retrieved 2020-04-26.
  24. "Learn About Sustainability". US EPA. 2014-11-05. Retrieved 2021-05-13.
  25. 1 2 "The Five Principles of Sustainable WASH". www.wvi.org. Retrieved 2021-05-13.
  26. Ministerio de Vivienda/JICA/JBIC/Grupo RPP/RPP Noticias/WSP:Construyendo una cultura del agua en el Perú. Estudio de perecepción sobre el agua y hábitos de consumo en la población, 2008, p. 10
  27. 1 2 3 4 5 6 7 Angelakis, Andreas N. (2014). "Evolution of Sanitation and Wastewater Technologies through the Centuries". Water Intelligence Online. 13. doi:10.2166/9781780404851. ISSN   1476-1777.
  28. "The ancient Nasca aqueducts are a brilliant engineering feat - Upworthy". www.upworthy.com. Retrieved 2024-04-17.
  29. 1 2 3 (in Spanish) WHO/PAHO 2000 Archived 2007-10-24 at the Wayback Machine
  30. 1 2 (in Spanish) PIDHDD 2006
  31. "Organization and Functions of the Ministry of Health Law" of 1990 (Legislative Decree N. 584)
  32. General Law of Sanitation Services
  33. 1 2 3 4 (in Spanish) WSP Revista Agua No. 19 Junio 2005, p. 4-5
  34. (in Spanish) SODEPAZ
  35. (in Spanish) TUMBES: primera concesión de una Empresa de Agua en el Perú
  36. Lynch, Barbara (2014-09-04). "River of Contention: Scarcity Discourse and Water Competition in Highland Peru". Georgia Journal of International & Comparative Law. 42 (1): 69. ISSN   0046-578X.
  37. Ullberg, S. B. (2019). "Making the megaproject: Water infrastructure and hydrocracy at the public-private interface in Peru". Water Alternatives. 12 (3): 503–520 via ResearchGate.
  38. In Peru the term "sanitation" also encompasses water provision, sewage systems, and raw sewage.
  39. (in Spanish) National Housing and Water Plan 2006-2015, p. 34
  40. (in Spanish) National Housing and Water Plan 2006-2015, p. 69-71
  41. Furthermore, there are 1831 district municipalities.
  42. (in Spanish) National Housing and Water Plan 2006-2015
  43. 1 2 (in Spanish) WHO/PAHO 2000, fortalezas y aspectos críticos del sector Archived 2010-02-11 at the Wayback Machine
  44. According to the Ley Orgánica of Regional Governments, Law Nº 27867
  45. Cockburn 2004
  46. World Bank: PRONASAR
  47. Jorge McGregor, Water and Sanitation Program: Small Town Pilot Project (STPP), London, June 10–11, 2008
  48. "Clean Water in Peru | Where We Work". Water For People. Retrieved 2020-04-26.
  49. 1 2 "Our Story". EcoSwell. Retrieved 2024-04-15.
  50. "Water and Sanitation". EcoSwell. Retrieved 2024-04-15.
  51. "EcoSwell". ecoswell.org. Retrieved 2020-04-26.
  52. (in Spanish) SUNASS: evolution of indicators, 2005 The 1997 value is probably not reliable due to micromeasurements
  53. 1 2 (in Spanish) SUNASS "gráficos promedio 2"
  54. (in Spanish) National Housing and Water Plan 2006-2015, p. 79
  55. using the August 29, 2008 exchange rate of US$ 1=Sol 2.97, see www.oanda.com. It is not clear if this amount includes payments for water from vendors.
  56. Ministerio de Vivienda/JICA/JBIC/Grupo RPP/RPP Noticias/WSP:Construyendo una cultura del agua en el Perú.Estudio de perecepción sobre el agua y hábitos de consumo en la población, 2008, p. 19-20
  57. USAID/EHP/WSP/OPS 2004, p. 16
  58. (in Spanish) IDB: Desarrollo del marco tarifario de los servicios de agua potable y saneamiento básico del Perú, p. 3
  59. WSP 2005
  60. (in Spanish) OMS/OPS 2001, p. 17-20
  61. Sources: 1990-1997: Ministry of urban development and housing; 1997-2005: Ministry of Economy and finance; investments at the municipal level are not included.
  62. Calculated based on USAID/EHP/WSP/PAHO 2004, p. 18-19, quoting the 1999 Sanitation Subsector Assessment by the Directorate General of Sanitation
  63. Calculated based on USAID/EHP/WSP/PAHO 2004, p. 17, quoting the Vice-Ministry of Housing and Sanitation
  64. (in Spanish) National Housing and Water Plan 2006-2015, p. 79-80
  65. (in Spanish) Plan Nacional de Saneamiento
  66. Japan International Cooperation Agency: Japanese ODA Loan Agreement with Peru: Efficient Water Use in Arid North Lima, September 29, 2009
  67. Lima Marginal Areas Sanitary Improvement Project, September 5, 2000

Sources