West Tyrone (District Electoral Area)

Last updated

West Tyrone
Fermanagh and Omagh District Council DEA constituency
Current constituency
Created1985
Seats7 (1985-2014)
6 (2014-)
Councillors
  •   Mark Buchanan (DUP)
  •   Glenn Campbell (SF)
  •   Ann-Marie Donnelly (SF)
  •   Stephen McCann (SF)
  •   Colette McNulty (SF)
  •   Allan Rainey (UUP)

West Tyrone is one of the seven district electoral areas (DEA) in Fermanagh and Omagh, Northern Ireland. [1] The district elects six members to Fermanagh and Omagh District Council and contains the wards of Dromore, Drumquin, Fairy Water, Fintona, Newtownsaville and Trillick. [2] Omagh forms part of the West Tyrone constituencies for the Northern Ireland Assembly and UK Parliament.

Contents

It was created for the 1985 local elections, replacing Omagh Area A and Omagh Area B which had existed since 1973, where it contained seven wards (Clanabogan, Dromore, Drumquin, Fairy Water, Fintona, Newtownsaville and Trillick). For the 2014 local elections it was reduced to six wards, although it maintained the Clanabogan area.

Councillors

ElectionCouncillor
(Party)
Councillor
(Party)
Councillor
(Party)
Councillor
(Party)
Councillor
(Party)
Councillor
(Party)
Councillor
(Party)
2023 Glenn Campbell
(Sinn Féin)
Ann-Marie Donnelly
(Sinn Féin)
Stephen McCann
(Sinn Féin)
Colette McNulty
(Sinn Féin)
Allan Rainey
(UUP)
Mark Buchanan
(DUP)
5 seats
2014–present
2019 Mary Garrity
(SDLP)
2014 Frankie Donnelly
(Sinn Féin)
2011 Peter Kelly
(Sinn Féin)
Patrick McDonnell
(SDLP)
Thomas Buchanan
(DUP)
Cecilia Quinn
(Sinn Féin)
2005 Barry McElduff
(Sinn Féin)
2001 Patrick Watters
(Sinn Féin)
Liam McQuaid
(SDLP)
1997 Kevin McQuaid
(Sinn Féin)
Cathal Quinn
(Sinn Féin)
Arthur McFarland
(UUP)
1993 Gerry McMenamin
(Sinn Féin)
Patrick Watters
(Sinn Féin)
John Duffy
(SDLP)
1989 Cecilia Quinn
(Sinn Féin)
Gregory McMullan
(SDLP)
Harry Cairns
(DUP)
1985 Robert Moses
(UUP)

2023 Election

2019: 3 x Sinn Féin, 1 x DUP, 1 x UUP, 1 x SDLP

2023: 4 x Sinn Féin, 1 x DUP, 1 x UUP

2019–2023 Change: Sinn Féin gain from SDLP

West Tyrone - 6 seats [3]
PartyCandidateFPv%Count
1234
DUP Mark Buchanan*19.50%1,619   
Sinn Féin Glenn Campbell*15.41%1,279   
Ulster Unionist Allan Rainey*9.99%8291,232.38  
Sinn Féin Ann-Marie Donnelly*13.60%1,1291,129.81 1,174.81 1,209.74
Sinn Féin Colette McNulty13.84%1,1491,151.43 1,163.43 1,171.20
Sinn Féin Stephen McCann*13.17%1,0931,093.00 1,112.00 1,153.16
SDLP Mary Garrity*8.99%746750.32 1,044.45 1,049.77
Alliance Joyce Donnelly5.51%457465.91   
Electorate: 12,652  Valid: 8,301 (65.61%)  Spoilt: 112  Quota: 1,186  Turnout: 8,413 (66.50%)  

    2019 Election

    2014: 3 x Sinn Féin, 1 x DUP, 1 x UUP, 1 x SDLP

    2019: 3 x Sinn Féin, 1 x DUP, 1 x UUP, 1 x SDLP

    2014-2019 Change: No change

    West Tyrone - 6 seats [4]
    PartyCandidateFPv%Count
    123456
    DUP Mark Buchanan*20.48%1,546     
    Ulster Unionist Allan Rainey*14.51%1,095     
    SDLP Mary Garrity*13.87%1,0471,203.24    
    Sinn Féin Ann-Marie Donnelly9.96%752752.62 772.62 772.62 1,307.62 
    Sinn Féin Glenn Campbell*13.03%983986.1 1,038.1 1,038.72 1,104.72 
    Sinn Féin Stephen McCann*11.12%839839.62 881.62 885.34 929.34 1,144.45
    Alliance Fia Cowan5.17%390667.76 732.44 797.54 804.54 814.34
    Sinn Féin Frankie Donnelly*8.65%653654.24 662.24 662.24   
    Aontú Cathal McCrory3.21%242265.56     
    Electorate: 12,201  Valid: 7,547 (61.86%)  Spoilt: 116  Quota: 1,079  Turnout: 7,663 (62.81%)  

      2014 Election

      2011: 4 x Sinn Féin, 1 x DUP, 1 x SDLP, 1 x UUP

      2014: 3 x Sinn Féin, 1 x UUP, 1 x DUP, 1 x SDLP

      2011-2014 Change: Sinn Féin loss due to the reduction of one seat

      West Tyrone - 6 seats [5]
      PartyCandidateFPv%Count
      123456
      Sinn Féin Glenn Campbell*21.38%1,595     
      Ulster Unionist Allan Rainey*17.39%1,297     
      Sinn Féin Frankie Donnelly*13.91%1,0381,447.53    
      DUP Mark Buchanan12.28%916916 916.62 1,034.16 1,071.16 
      SDLP Mary Garrity10.51%784808.09 838.78 840.76 917.34 1,216.34
      Sinn Féin Stephen McCann8.71%650715.34 1,036.81 1,037.35 1,051.54 1,068.54
      DUP Elaine Thompson*7.24%540540.33 540.33 626.37 661.59 662.59
      SDLP Cathal Lynch5.36%400407.92 419.39 421.91 461.65  
      Alliance Stephen Donnelly2.32%173180.92 189.6 196.08   
      Independent Susan-Anne White 0.90%67     
      Electorate: 11,815  Valid: 7,460 (63.14%)  Spoilt: 140  Quota: 1,066  Turnout: 7,600 (64.33%)  

        2011 Election

        2005: 4 x Sinn Féin, 1 x DUP, 1 x SDLP, 1 x UUP

        2011: 4 x Sinn Féin, 1 x DUP, 1 x SDLP, 1 x UUP

        2005-2011 Change: No change

        West Tyrone - 7 seats [6]
        PartyCandidateFPv%Count
        12345
        Sinn Féin Glenn Campbell17.28%1,375    
        DUP Thomas Buchanan *15.90%1,265    
        SDLP Patrick McDonnell*15.65%1,245    
        Sinn Féin Cecilia Quinn*12.88%1,025    
        Sinn Féin Frankie Donnelly*9.01%7171,017.44   
        Ulster Unionist Allan Rainey*10.60%843845.8 888.48 1,100.48 
        Sinn Féin Peter Kelly*9.38%746808.44 808.66 815.78 1,055.17
        DUP Elaine Thompson6.27%499499.28 703.66 736.16 745.78
        Ulster Unionist Jane Clarke3.03%241243.8 265.58   
        Electorate: 11,926  Valid: 7,956 (66.71%)  Spoilt: 174  Quota: 995  Turnout: 8,130 (68.17%)  

          2005 Election

          2001: 3 x Sinn Féin, 2 x SDLP, 1 x DUP, 1 x UUP

          2005: 4 x Sinn Féin, 1 x SDLP, 1 x DUP, 1 x UUP

          2001-2005 Change: Sinn Féin gain from SDLP

          West Tyrone - 7 seats [7]
          PartyCandidateFPv%Count
          1234567
          DUP Thomas Buchanan *21.00%1,810      
          Sinn Féin Barry McElduff *17.07%1,471      
          Ulster Unionist Allan Rainey*8.53%7351,141.08     
          SDLP Patrick McDonnell*12.30%1,0601,063.29 1,109.19    
          Sinn Féin Cecilia Quinn11.41%983983.47 1,027.75 1,146.75   
          Sinn Féin Frankie Donnelly9.17%790790 990.61 1,060.93 1,072.93 1,072.93 1,084.18
          Sinn Féin Peter Kelly*8.33%718718 791.44 862.92 912.92 913.08 932.58
          Ulster Unionist William Bleakley6.01%518824.91 824.91 856.18 856.18 918.74 918.74
          SDLP Liam McQuaid*6.20%534536.35 557.41     
          Electorate: 11,153  Valid: 8,619 (77.28%)  Spoilt: 173  Quota: 1,078  Turnout: 8,792 (78.83%)  

            2001 Election

            1997: 2 x Sinn Féin, 2 x SDLP, 2 x UUP, 1 x DUP

            2001: 3 x Sinn Féin, 2 x SDLP, 1 x DUP, 1 x UUP

            1997-2001 Change: Sinn Féin gain from UUP

            West Tyrone - 7 seats [8]
            PartyCandidateFPv%Count
            12345678
            SDLP Patrick McDonnell*15.07%1,372       
            Sinn Féin Barry McElduff 14.01%1,276       
            Ulster Unionist Allan Rainey*12.46%1,1351,136.19 1,136.41 1,140.41    
            DUP Thomas Buchanan *12.00%1,0931,093.34 1,093.34 1,099.34 1,334.34   
            Sinn Féin Peter Kelly9.21%839856.85 884.13 894.58 925.47 925.47 1,331.47 
            Sinn Féin Patrick Watters8.38%763771.16 780.18 788.23 796.62 796.62 961.65 1,132.75
            SDLP Liam McQuaid*7.46%679843.05 851.08 889.77 985.68 986.68 1,057.61 1,074.72
            Ulster Unionist David Sterritt7.31%666666.17 666.17 668.17 689.51 861.51 861.51 862.69
            Sinn Féin Damien McCrossan6.74%614622.67 696.37 728.91 750.41 751.41   
            Workers' Party Tommy Owens2.32%211222.05 227.44 280.79     
            DUP Stephen Harpur2.82%257257.34 257.34 258.34     
            Independent Gerry McMenamin2.22%202210.67 219.8      
            Electorate: 11,005  Valid: 9,107 (82.75%)  Spoilt: 179  Quota: 1,139  Turnout: 9,286 (84.38%)  

              1997 Election

              1993: 2 x UUP, 2 x SDLP, 2 x Sinn Féin, 1 x DUP

              1997: 2 x UUP, 2 x SDLP, 2 x Sinn Féin, 1 x DUP

              1993-1997 Change: No change

              West Tyrone - 7 seats [9]
              PartyCandidateFPv%Count
              123456789
              Ulster Unionist Arthur McFarland*16.27%1,243        
              Sinn Féin Kevin McGrade14.46%1,105        
              Ulster Unionist Allan Rainey*9.52%727963.67       
              DUP Thomas Buchanan *10.73%820843 843 843 849 891.84 1,144.84  
              SDLP Liam McQuaid*10.51%803804.15 811.56 825.56 849.47 888.7 892.62 904.62 989.62
              Sinn Féin Cathal Quinn9.86%753753.46 875.27 883.27 899.66 913.66 913.66 914.66 978.66
              SDLP Patrick McDonnell8.57%655656.15 660.31 671.44 684.7 701.16 702.85 703.85 828.11
              SDLP James Connolly5.58%426426 428.08 429.08 460.08 510.83 513.42 519.42 555.01
              Workers' Party Tommy Owens5.07%387387.23 389.18 417.18 433.31 448.54 452 459  
              DUP Walter McFarland3.85%294309.87 310 310 314.23 324.46    
              Alliance George Kerr2.83%216219.68 220.07 221.2 231.43     
              Labour Coalition Amanda McLaughlin1.85%141141.46 143.41 148.41      
              Workers' Party Tony Winters0.92%7070 70.26       
              Electorate: 10,521  Valid: 7,640 (72.62%)  Spoilt: 208  Quota: 956  Turnout: 7,848 (74.59%)  

                1993 Election

                1989: 2 x SDLP, 2 x UUP, 2 x Sinn Féin, 1 x DUP

                1993: 2 x SDLP, 2 x UUP, 2 x Sinn Féin, 1 x DUP

                1989-1993 Change: No change

                West Tyrone - 7 seats [10]
                PartyCandidateFPv%Count
                1234567
                DUP Thomas Buchanan 15.62%1,194      
                SDLP Liam McQuaid*15.60%1,192      
                Ulster Unionist Arthur McFarland*14.95%1,143      
                Ulster Unionist Allan Rainey*7.99%611779.59 780.64 933.44 973.44  
                Sinn Féin Gerry McMenamin*11.72%896896.46 903.81 903.81 907.81 910.81 957.81
                SDLP John Duffy7.72%590590.23 661.21 661.37 694.37 707.44 884.55
                Sinn Féin Patrick Watters9.17%701701.46 719.52 719.68 719.68 721.47 762.46
                SDLP James Connolly6.45%493493.69 597.43 597.91 619.65 638.57 698.26
                Workers' Party Tommy Owens4.81%368368.92 395.59 396.07 431.12 456.1  
                Ulster Unionist William Wilson3.65%279338.34 339.6 362.8 383.3   
                Alliance Eric Bullick2.30%176181.75 185.11 187.03    
                Electorate: 10,209  Valid: 7,643 (74.87%)  Spoilt: 200  Quota: 956  Turnout: 7,843 (76.82%)  

                  1989 Election

                  1985: 2 x UUP, 2 x SDLP, 2 x Sinn Féin, 1 x DUP

                  1989: 2 x UUP, 2 x SDLP, 2 x Sinn Féin, 1 x DUP

                  1985-1989 Change: No change

                  West Tyrone - 7 seats [11]
                  PartyCandidateFPv%Count
                  12345678910
                  Ulster Unionist Arthur McFarland*17.28%1,314         
                  SDLP Liam McQuaid*14.63%1,112         
                  Ulster Unionist Allan Rainey10.92%8301,135.1        
                  DUP Harry Cairns*10.94%832856.03 961.6       
                  Sinn Féin Gerry McMenamin*11.02%838838.27 838.27 841.42 841.42 841.42 923.42 927.57 927.74 979.19
                  Sinn Féin Cecilia Quinn*10.02%762762.27 762.44 777.74 777.74 778.01 860.31 865.76 866.76 890.08
                  SDLP Gregory McMullan*5.54%421421.27 421.61 512.51 512.51 512.51 517.66 560.11 567.32 748.7
                  SDLP James Connolly6.43%489489 489.17 520.07 520.08 521.25 540.4 574.64 587.63 636.42
                  Workers' Party Tommy Owens4.16%316316.81 317.83 328.33 328.33 329.03 333.03 398.72 417.27  
                  DUP Raymond Farrell1.79%136145.18 173.4 173.55 177.63 313.27 314.27 332.98   
                  Alliance Ann Gormley2.80%213215.97 225.32 228.17 228.22 231.49 235.64    
                  Sinn Féin William McLaughlin2.87%218218 218 218.9 218.9 218.9     
                  DUP Raymond Little1.59%121129.91 165.61 165.61 167.22      
                  Electorate: 9,836  Valid: 7,602 (77.29%)  Spoilt: 243  Quota: 951  Turnout: 7,845 (79.76%)  

                    1985 Election

                    1985: 2 x UUP, 2 x SDLP, 2 x Sinn Féin, 1 x DUP

                    West Tyrone - 7 seats [12]
                    PartyCandidateFPv%Count
                    12345678910111213
                    Ulster Unionist Arthur McFarland*14.98%1,186            
                    Sinn Féin Cathal Quinn14.03%1,111            
                    DUP Harry Cairns11.85%938952.24 952.24 952.24 1,029.24        
                    Ulster Unionist Robert Moses*7.96%630790.8 790.91 790.91 809.79 815.19 848.51 856.78 1,107.78    
                    SDLP Liam McQuaid*10.60%839839.32 861.65 870.98 871.3 871.3 896.3 934.4 935.1 940.1 1,161.1  
                    Sinn Féin Gerry McMenamin9.32%738738 799.16 799.16 800.16 800.16 803.16 830.93 831.93 831.93 840.26 842.96 980.41
                    SDLP Gregory McMullan4.98%394394.32 394.54 397.54 399.54 399.54 435.54 502.98 503.46 504.46 578.68 727.18 879.22
                    Sinn Féin James McElhinney5.38%426426 448.11 471.33 473.33 473.33 475.33 479.55 479.55 480.55 526.88 539.48 584.14
                    Irish Independence Patrick Donnelly*4.38%347347 349.97 420.3 420.41 420.41 429.41 473.52 473.52 474.52 488.74 495.94  
                    SDLP John Skelton*4.67%370370.16 372.58 395.85 395.85 395.85 402.85 417.85 418.39 421.39    
                    DUP George Thompson3.39%268273.76 273.76 273.76 322.52 356 362.32 364.48      
                    Workers' Party Tommy Owens2.58%204204.32 207.62 209.62 209.62 209.62 244.62       
                    Alliance Eric Bullick2.21%175175.8 175.8 175.8 175.8 175.8        
                    DUP Hazel McKenzie1.91%151156.6 156.71 157.71          
                    Irish Independence James Connolly1.77%140140.16 141.15           
                    Electorate: 9,690  Valid: 7,917 (81.70%)  Spoilt: 174  Quota: 990  Turnout: 8,091 (83.50%)  

                      Related Research Articles

                      <span class="mw-page-title-main">Omagh District Council</span> Human settlement in Northern Ireland

                      Omagh District Council was a local council in Northern Ireland. It merged with Fermanagh District Council in April 2015 under local government reorganisation to become Fermanagh and Omagh District Council.

                      <span class="mw-page-title-main">2014 Fermanagh and Omagh District Council election</span>

                      The first election to Fermanagh and Omagh District Council, part of the Northern Ireland local elections on 22 May 2014, returned 40 members to the newly-formed council via Single Transferable Vote.

                      <span class="mw-page-title-main">2011 Fermanagh District Council election</span> Local government election in Northern Ireland

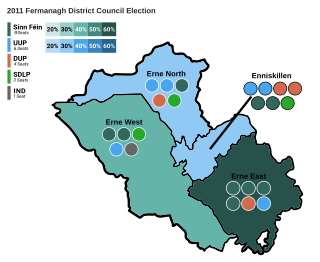
                      Elections to Fermanagh District Council were held on 5 May 2011 on the same day as the other Northern Irish local government elections. The election used four district electoral areas to elect a total of 23 councillors.

                      <span class="mw-page-title-main">2019 Fermanagh and Omagh District Council election</span>

                      Elections took place for Fermanagh and Omagh District Council on 2 May 2019, part of that year's local elections. 40 Councillors were elected via STV.

                      Elections to Banbridge District Council were held on 5 May 2011 on the same day as the other Northern Irish local government elections. The election used three district electoral areas to elect a total of 17 councillors.

                      Elections to Omagh District Council were held on 5 May 2011, on the same day as the other Northern Irish local government elections. The election used three district electoral areas to elect a total of 21 councillors.

                      Elections to Omagh District Council were held on 17 May 1989 on the same day as the other Northern Irish local government elections. The election used three district electoral areas to elect a total of 21 councillors.

                      Elections to Fermanagh District Council were held on 17 May 1989 on the same day as the other Northern Irish local government elections. The election used four district electoral areas to elect a total of 23 councillors.

                      Dromore was one of the three district electoral areas in Banbridge, Northern Ireland which existed from 1985 to 2014. The district elected five members to Banbridge District Council, and formed part of the Lagan Valley constituencies for the Northern Ireland Assembly and UK Parliament.

                      Clogher Valley is one of the seven district electoral areas (DEA) in Mid Ulster, Northern Ireland. The district elects six members to Mid Ulster District Council and contains the wards of Augher and Clogher, Aughnacloy, Ballygawley, Caledon, Castlecaulfield and Fivemiletown. Clogher Valley forms part of the Fermanagh and South Tyrone constituencies for the Northern Ireland Assembly and UK Parliament.

                      Dungannon is one of the seven district electoral areas (DEA) in Mid Ulster, Northern Ireland. The district elects six members to Mid Ulster District Council and contains the wards of Ballysaggart, Killyman, Killymeal, Moy, Moygashel and Mullaghmore. Dungannon forms part of the Fermanagh and South Tyrone constituencies for the Northern Ireland Assembly and UK Parliament.

                      Blackwater was one of the four district electoral areas in Dungannon, Northern Ireland which existed from 1985 to 2014. The district elected five members to Dungannon and South Tyrone Borough Council, and formed part of the Fermanagh and South Tyrone constituencies for the Northern Ireland Assembly and UK Parliament.

                      Omagh is one of the seven district electoral areas (DEA) in Fermanagh and Omagh, Northern Ireland. The district elects six members to Fermanagh and Omagh District Council and contains the wards of Camowen, Coolnagard, Dergmoney, Gortrush, Killyclogher and Strule. Omagh forms part of the West Tyrone constituencies for the Northern Ireland Assembly and UK Parliament.

                      Mid Tyrone is one of the seven district electoral areas (DEA) in Fermanagh and Omagh, Northern Ireland. The district elects six members to Fermanagh and Omagh District Council and contains the wards of Beragh, Drumnakilly, Gortin, Owenkillew, Sixmilecross and Termon. Omagh forms part of the West Tyrone constituencies for the Northern Ireland Assembly and UK Parliament.

                      Enniskillen is one of the seven district electoral areas (DEA) in Fermanagh and Omagh, Northern Ireland. The district elects six members to Fermanagh and Omagh District Council and contains the wards of Castlecoole, Erne, Lisbellaw, Lisnarrick, Portora and Rossory. Enniskillen forms part of the Fermanagh and South Tyrone constituencies for the Northern Ireland Assembly and UK Parliament.

                      Erne North is one of the seven district electoral areas (DEA) in Fermanagh and Omagh, Northern Ireland. The district elects five members to Fermanagh and Omagh District Council and contains the wards of Ballinamallard, Belleek and Boa, Ederney and Kesh, Irvinestown and Tempo. Erne North forms part of the Fermanagh and South Tyrone constituencies for the Northern Ireland Assembly and UK Parliament.

                      Erne East is one of the seven district electoral areas (DEA) in Fermanagh and Omagh, Northern Ireland. The district elects six members to Fermanagh and Omagh District Council and contains the wards of Brookeborough, Donagh, Lisnaskea, Maguiresbridge, Newtownbutler and Rosslea. Erne East forms part of the Fermanagh and South Tyrone constituencies for the Northern Ireland Assembly and UK Parliament.

                      Erne West is one of the seven district electoral areas (DEA) in Fermanagh and Omagh, Northern Ireland. The district elects five members to Fermanagh and Omagh District Council and contains the wards of Belcoo and Garrison, Boho, Cleenish and Letterbreen, Derrygonnelly, Derrylin and Florence Court and Kinawley. Erne West forms part of the Fermanagh and South Tyrone constituencies for the Northern Ireland Assembly and UK Parliament.

                      Glenelly was one of the three district electoral areas in Strabane, Northern Ireland which existed from 1985 to 2014. The district elected five members to Strabane District Council, and formed part of the West Tyrone constituencies for the Northern Ireland Assembly and UK Parliament.

                      Omagh Area A was one of the four district electoral areas in Omagh, Northern Ireland which existed from 1973 to 1985. The district elected five members to Omagh District Council, and formed part of the Mid Ulster constituencies for the Northern Ireland Assembly and UK Parliament.

                      References

                      1. Final Northern Ireland super council recommendations, BBC News, 13 December 2013, accessed 24 May 2014
                      2. "Fermanagh and Omagh District Council". www.ark.ac.uk. Retrieved 10 July 2023.
                      3. "Local Council Elections 2023 - Results". EONI. Retrieved 8 July 2023.
                      4. "Local Council Elections 2019 - Results by Stage". 2 May 2019. Retrieved 24 January 2022.
                      5. "Local Council Elections 2014 - Results by Stage" . Retrieved 25 January 2022.
                      6. "West Tyrone Result Sheet" (PDF). EONI. Retrieved 14 August 2021.
                      7. "Local Government Results 2005". EONI. Retrieved 9 August 2021.
                      8. "Local Government Results 2001". EONI. Retrieved 14 August 2021.
                      9. "Local Government Results 1997". EONI. Retrieved 15 August 2021.
                      10. "Local Government Results 1993". EONI. Retrieved 15 August 2021.
                      11. "Local Government Results 1989". EONI. Retrieved 15 August 2021.
                      12. "Local Government Results 1985". EONI. Retrieved 15 August 2021.