
The Christian Democratic Appeal is a Christian-democratic and socially conservative political party in the Netherlands. It was originally formed in 1977 from a confederation of the Catholic People's Party, the Anti-Revolutionary Party and the Christian Historical Union; it has participated in all but three cabinets since it became a unitary party.

General elections were held in the Netherlands on 15 May 2002. The elections were amongst the most dramatic in Dutch history, not just in terms of the electoral results, as they were completely overshadowed by the assassination of leader Pim Fortuyn only nine days before election day.

General elections were held in the Netherlands on 22 January 2003.

General elections were held in the Netherlands on 7 July 1948. The Catholic People's Party remained the largest party in the House of Representatives, winning 32 of the 100 seats.
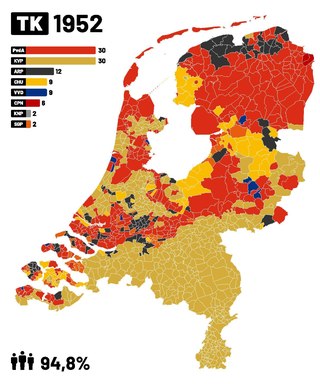
General elections were held in the Netherlands on 25 June 1952. The Catholic People's Party and the Labour Party both won 30 of the 100 seats in the House of Representatives. It was the first time since 1913 that the Catholic People's Party and its predecessors had not received a plurality of the vote.

General elections were held in the Netherlands on 13 June 1956. For the first time, the Labour Party (PvdA) emerged as the largest party, winning 50 of the 150 seats in the House of Representatives.
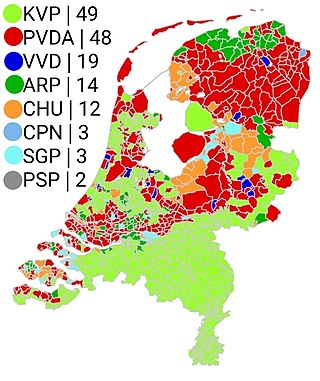
General elections were held in the Netherlands on 12 March 1959. The Catholic People's Party emerged as the largest party, winning 49 of the 150 seats in the House of Representatives.

General elections were held in the Netherlands on 15 May 1963. The Catholic People's Party (KVP) remained the largest party, winning 50 of the 150 seats in the House of Representatives.
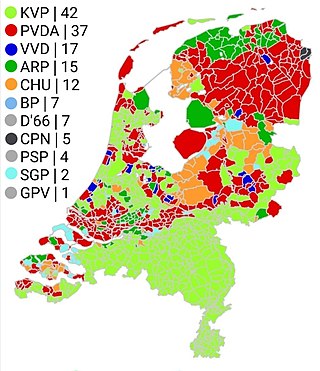
General elections were held in the Netherlands on 15 February 1967. The Catholic People's Party (KVP) remained the largest party, winning 42 of the 150 seats in the House of Representatives.

Early general elections were held in the Netherlands on 29 November 1972. The Labour Party (PvdA) remained the largest party, winning 43 of the 150 seats in the House of Representatives.
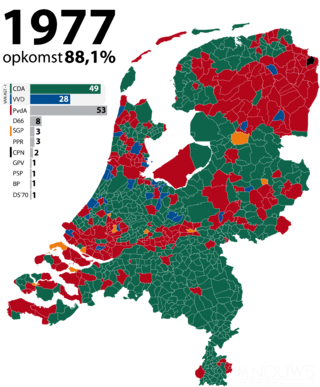
General elections were held in the Netherlands on 25 May 1977. The Labour Party remained the largest party, winning 53 of the 150 seats in the House of Representatives. Following the election, it took 208 days of negotiations to form a new government. This was a European record for longest government formation that stood until after the 2010 Belgian general election. The Christian Democratic Appeal was formed by the Anti-Revolutionary Party (ARP), Christian Historical Union (CHU) and the Catholic People's Party (KVP) in 1976. The first joint party leader was a member of the KVP, Dries van Agt.
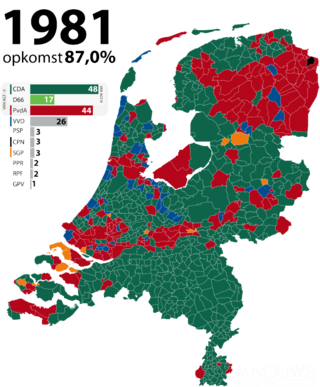
General elections were held in the Netherlands on 26 May 1981. The Christian Democratic Appeal (CDA) emerged as the largest party, winning 48 of the 150 seats in the House of Representatives.

Early general elections were held in the Netherlands on 8 September 1982. The Labour Party emerged as the largest party, winning 47 of the 150 seats in the House of Representatives; however, this would be the last time it did so until 1994.
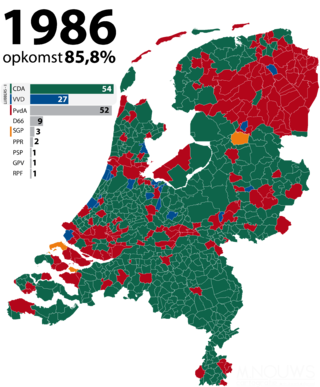
General elections were held in the Netherlands on 21 May 1986. The Christian Democratic Appeal (CDA) emerged as the largest party, winning 54 of the 150 seats in the House of Representatives.

General elections were held in the Netherlands on 3 May 1994. The Labour Party emerged as the largest party, winning 37 of the 150 seats in the House of Representatives. The election resulted in significant losses for both the Labour Party and the Christian Democratic Appeal. The two liberal parties, People's Party for Freedom and Democracy and Democrats 66 made large gains, whilst two pro-elderly parties and the Socialist Party all passed the electoral threshold to win seats.

General elections were held in the Netherlands on 6 May 1998.

The Hungarian Workers' Party is a communist party in Hungary led by Gyula Thürmer. Established after the fall of the communist Hungarian People's Republic, the party has yet to win a seat in the Hungarian parliament. Until May 2009, it was a member of the Party of the European Left. It was formed from, and considers itself the successor to, the former ruling Hungarian Socialist Workers' Party.
General elections were held in Luxembourg on 18 June 1989. The Christian Social People's Party remained the largest party, winning 22 of the 60 seats in the Chamber of Deputies. It continued the coalition government with the Luxembourg Socialist Workers' Party.
Elections to the eleventh Supreme Soviet were held in the Soviet Union on 4 March 1984. They were the last in the Soviet Union to be held before Mikhail Gorbachev's policies of perestroika and demokratizatsiya resulted in partially free elections in 1989. They were also the last direct elections to the Supreme Soviet, as in 1989 deputies were elected to the Congress of People's Deputies, who then elected the Supreme Soviet.
Parliamentary elections were held in Bulgaria on 24 December 1939, although voting continued in some areas into January 1940. The elections were officially held on a non-partisan basis with the Bulgarian Agrarian National Union and Bulgarian Communist Party banned, and in a process tightly controlled by Tsar Boris III, by then the real power in the country. However, candidates representing parties did contest the elections. Pro-government candidates won a majority of seats. Voter turnout was 67.2%.

