
Configuration management (CM) is a process for establishing and maintaining consistency of a product's performance, functional, and physical attributes with its requirements, design, and operational information throughout its life. The CM process is widely used by military engineering organizations to manage changes throughout the system lifecycle of complex systems, such as weapon systems, military vehicles, and information systems. Outside the military, the CM process is also used with IT service management as defined by ITIL, and with other domain models in the civil engineering and other industrial engineering segments such as roads, bridges, canals, dams, and buildings.
Quality control (QC) is a process by which entities review the quality of all factors involved in production. ISO 9000 defines quality control as "a part of quality management focused on fulfilling quality requirements".
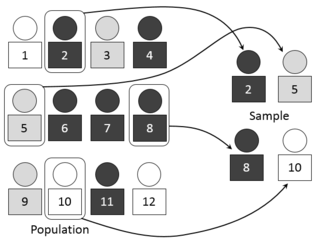
In statistics, quality assurance, and survey methodology, sampling is the selection of a subset of individuals from within a statistical population to estimate characteristics of the whole population. Statisticians attempt to collect samples that are representative of the population in question. Sampling has lower costs and faster data collection than measuring the entire population and can provide insights in cases where it is infeasible to measure an entire population.
Sample size determination is the act of choosing the number of observations or replicates to include in a statistical sample. The sample size is an important feature of any empirical study in which the goal is to make inferences about a population from a sample. In practice, the sample size used in a study is usually determined based on the cost, time, or convenience of collecting the data, and the need for it to offer sufficient statistical power. In complicated studies there may be several different sample sizes: for example, in a stratified survey there would be different sizes for each stratum. In a census, data is sought for an entire population, hence the intended sample size is equal to the population. In experimental design, where a study may be divided into different treatment groups, there may be different sample sizes for each group.

MIL-STD-105 was a United States defense standard that provided procedures and tables for sampling by attributes based on Walter A. Shewhart, Harry Romig, and Harold F. Dodge sampling inspection theories and mathematical formulas. Widely adopted outside of military procurement applications.

In statistical process control (SPC), the and R chart is a type of scheme, popularly known as control chart, used to monitor the mean and range of a normally distributed variables simultaneously, when samples are collected at regular intervals from a business or industrial process. It is often used to monitor the variables data but the performance of the and R chart may suffer when the normality assumption is not valid.
A United States defense standard, often called a military standard, "MIL-STD", "MIL-SPEC", or (informally) "MilSpecs", is used to help achieve standardization objectives by the U.S. Department of Defense.
Environmental stress screening (ESS) refers to the process of exposing a newly manufactured or repaired product or component to stresses such as thermal cycling and vibration in order to force latent defects to manifest themselves by permanent or catastrophic failure during the screening process. The surviving population, upon completion of screening, can be assumed to have a higher reliability than a similar unscreened population.

In statistical quality control, the p-chart is a type of control chart used to monitor the proportion of nonconforming units in a sample, where the sample proportion nonconforming is defined as the ratio of the number of nonconforming units to the sample size, n.
A measurement systems analysis (MSA) is a thorough assessment of a measurement process, and typically includes a specially designed experiment that seeks to identify the components of variation in that measurement process. Just as processes that produce a product may vary, the process of obtaining measurements and data may also have variation and produce incorrect results. A measurement systems analysis evaluates the test method, measuring instruments, and the entire process of obtaining measurements to ensure the integrity of data used for analysis and to understand the implications of measurement error for decisions made about a product or process. Proper measurement system analysis is critical for producing a consistent product in manufacturing and when left uncontrolled can result in a drift of key parameters and unusable final products. MSA is also an important element of Six Sigma methodology and of other quality management systems. MSA analyzes the collection of equipment, operations, procedures, software and personnel that affects the assignment of a number to a measurement characteristic.
Harold French Dodge was one of the principal architects of the science of statistical quality control. His father was the photographer William H. Dodge. Harold Dodge is universally known for his work in originating acceptance sampling plans for putting inspection operations on a scientific basis in terms of controllable risks. Dodge earned his B.S. in Electrical Engineering from M.I.T. in 1916 and his A.B. in Physics from Columbia University in 1917.
Discrimination testing is a technique employed in sensory analysis to determine whether there is a detectable difference among two or more products. The test uses a group of assessors (panellists) with a degree of training appropriate to the complexity of the test to discriminate from one product to another through one of a variety of experimental designs. Though useful, these tests typically do not quantify or describe any differences, requiring a more specifically trained panel under different study design to describe differences and assess significance of the difference.
In engineering, science, and statistics, replication is the repetition of an experimental condition so that the variability associated with the phenomenon can be estimated. ASTM, in standard E1847, defines replication as "... the repetition of the set of all the treatment combinations to be compared in an experiment. Each of the repetitions is called a replicate."
The combination of quality control and genetic algorithms led to novel solutions of complex quality control design and optimization problems. Quality is the degree to which a set of inherent characteristics of an entity fulfils a need or expectation that is stated, general implied or obligatory. ISO 9000 defines quality control as "A part of quality management focused on fulfilling quality requirements". Genetic algorithms are search algorithms, based on the mechanics of natural selection and natural genetics.
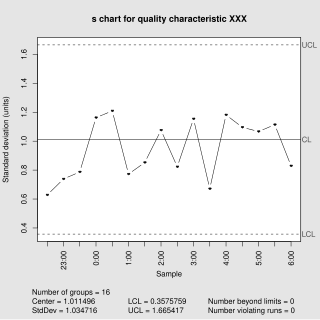
In statistical quality control, the and s chart is a type of control chart used to monitor variables data when samples are collected at regular intervals from a business or industrial process. This is connected to traditional statistical quality control (SQC) and statistical process control (SPC). However, Woodall noted that "I believe that the use of control charts and other monitoring methods should be referred to as “statistical process monitoring,” not “statistical process control (SPC).”"
The acceptable quality limit (AQL) is the worst tolerable process average (mean) in percentage or ratio that is still considered acceptable; that is, it is at an acceptable quality level. Closely related terms are the rejectable quality limit and rejectable quality level (RQL). In a quality control procedure, a process is said to be at an acceptable quality level if the appropriate statistic used to construct a control chart does not fall outside the bounds of the acceptable quality limits. Otherwise, the process is said to be at a rejectable control level.
MIL-STD-130, "Identification Marking of U.S. Military Property," is a specification that describes markings required on items sold to the Department of Defense (DoD), including the addition, in about 2005, of UII Data Matrix machine-readable information (MRI) requirements. MIL-STD-130 describes the materials allowed, minimum text size and fonts, format, syntax and rules for identifying marks on a part, where to locate this marking plus exceptions and unique situations, such as vehicle identification numbers, cell phone IDs, etc. Other non-identifying markings—such as "this end up"—are covered under MIL-STD-129.
The MIL-STD-883 standard establishes uniform methods, controls, and procedures for testing microelectronic devices suitable for use within military and aerospace electronic systems including basic environmental tests to determine resistance to deleterious effects of natural elements and conditions surrounding military and space operations; mechanical and electrical tests; workmanship and training procedures; and such other controls and constraints as have been deemed necessary to ensure a uniform level of quality and reliability suitable to the intended applications of those devices. For the purpose of this standard, the term "devices" includes such items as monolithic, multichip, film and hybrid microcircuits, microcircuit arrays, and the elements from which the circuits and arrays are formed. This standard is intended to apply only to microelectronic devices.
Lot quality assurance sampling (LQAS) is a random sampling methodology, originally developed in the 1920s as a method of quality control in industrial production. Compared to similar sampling techniques like stratified and cluster sampling, LQAS provides less information but often requires substantially smaller sample sizes.
In statistics, a variables sampling plan is an acceptance sampling technique. Plans for variables are intended for quality characteristics that are measured on a continuous scale. This plan requires the knowledge of the statistical model. The historical evolution of this technique dates back to the seminal work of W. Allen Wallis (1943). The purpose of a plan for variables is to assess whether the process is operating far enough from the specification limit. Plans for variables may produce a similar OC curve to attribute plans with significantly less sample size.


