
Population genetics is a subfield of genetics that deals with genetic differences within and between populations, and is a part of evolutionary biology. Studies in this branch of biology examine such phenomena as adaptation, speciation, and population structure.
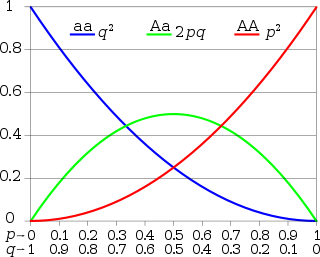
In population genetics, the Hardy–Weinberg principle, also known as the Hardy–Weinberg equilibrium, model, theorem, or law, states that allele and genotype frequencies in a population will remain constant from generation to generation in the absence of other evolutionary influences. These influences include genetic drift, mate choice, assortative mating, natural selection, sexual selection, mutation, gene flow, meiotic drive, genetic hitchhiking, population bottleneck, founder effect,inbreeding and outbreeding depression.
Allele frequency, or gene frequency, is the relative frequency of an allele at a particular locus in a population, expressed as a fraction or percentage. Specifically, it is the fraction of all chromosomes in the population that carry that allele over the total population or sample size. Microevolution is the change in allele frequencies that occurs over time within a population.
Genetic linkage is the tendency of DNA sequences that are close together on a chromosome to be inherited together during the meiosis phase of sexual reproduction. Two genetic markers that are physically near to each other are unlikely to be separated onto different chromatids during chromosomal crossover, and are therefore said to be more linked than markers that are far apart. In other words, the nearer two genes are on a chromosome, the lower the chance of recombination between them, and the more likely they are to be inherited together. Markers on different chromosomes are perfectly unlinked, although the penetrance of potentially deleterious alleles may be influenced by the presence of other alleles, and these other alleles may be located on other chromosomes than that on which a particular potentially deleterious allele is located.

The unified neutral theory of biodiversity and biogeography is a theory and the title of a monograph by ecologist Stephen P. Hubbell. It aims to explain the diversity and relative abundance of species in ecological communities. Like other neutral theories of ecology, Hubbell assumes that the differences between members of an ecological community of trophically similar species are "neutral", or irrelevant to their success. This implies that niche differences do not influence abundance and the abundance of each species follows a random walk. The theory has sparked controversy, and some authors consider it a more complex version of other null models that fit the data better.
In population genetics, linkage disequilibrium (LD) is the non-random association of alleles at different loci in a given population. Loci are said to be in linkage disequilibrium when the frequency of association of their different alleles is higher or lower than what would be expected if the loci were independent and associated randomly.
In population genetics, Ewens's sampling formula, describes the probabilities associated with counts of how many different alleles are observed a given number of times in the sample.
The effective population size (Ne) is a number that, in some simplified scenarios, corresponds to the number of breeding individuals in the population. More generally, Ne is the number of individuals that an idealised population would need to have in order for some specified quantity of interest to be the same as in the real population. Idealised populations are based on unrealistic but convenient simplifications such as random mating, simultaneous birth of each new generation, constant population size, and equal numbers of children per parent. For most quantities of interest and most real populations, the effective population size Ne is usually smaller than the census population size N of a real population. The same population may have multiple effective population sizes, for different properties of interest, including for different genetic loci.

Genetic distance is a measure of the genetic divergence between species or between populations within a species, whether the distance measures time from common ancestor or degree of differentiation. Populations with many similar alleles have small genetic distances. This indicates that they are closely related and have a recent common ancestor.
Coalescent theory is a model of how alleles sampled from a population may have originated from a common ancestor. In the simplest case, coalescent theory assumes no recombination, no natural selection, and no gene flow or population structure, meaning that each variant is equally likely to have been passed from one generation to the next. The model looks backward in time, merging alleles into a single ancestral copy according to a random process in coalescence events. Under this model, the expected time between successive coalescence events increases almost exponentially back in time. Variance in the model comes from both the random passing of alleles from one generation to the next, and the random occurrence of mutations in these alleles.
In population genetics, the Watterson estimator is a method for describing the genetic diversity in a population. It was developed by Margaret Wu and G. A. Watterson in the 1970s. It is estimated by counting the number of polymorphic sites. It is a measure of the "population mutation rate" from the observed nucleotide diversity of a population. , where is the effective population size and is the per-generation mutation rate of the population of interest. The assumptions made are that there is a sample of haploid individuals from the population of interest, that there are infinitely many sites capable of varying, and that . Because the number of segregating sites counted will increase with the number of sequences looked at, the correction factor is used.
In population genetics, fixation is the change in a gene pool from a situation where there exists at least two variants of a particular gene (allele) in a given population to a situation where only one of the alleles remains. In the absence of mutation or heterozygote advantage, any allele must eventually be lost completely from the population or fixed. Whether a gene will ultimately be lost or fixed is dependent on selection coefficients and chance fluctuations in allelic proportions. Fixation can refer to a gene in general or particular nucleotide position in the DNA chain (locus).
Tajima's D is a population genetic test statistic created by and named after the Japanese researcher Fumio Tajima. Tajima's D is computed as the difference between two measures of genetic diversity: the mean number of pairwise differences and the number of segregating sites, each scaled so that they are expected to be the same in a neutrally evolving population of constant size.
In probability and statistics, the Tweedie distributions are a family of probability distributions which include the purely continuous normal, gamma and inverse Gaussian distributions, the purely discrete scaled Poisson distribution, and the class of compound Poisson–gamma distributions which have positive mass at zero, but are otherwise continuous. Tweedie distributions are a special case of exponential dispersion models and are often used as distributions for generalized linear models.
SNV calling from NGS data is any of a range of methods for identifying the existence of single nucleotide variants (SNVs) from the results of next generation sequencing (NGS) experiments. These are computational techniques, and are in contrast to special experimental methods based on known population-wide single nucleotide polymorphisms. Due to the increasing abundance of NGS data, these techniques are becoming increasingly popular for performing SNP genotyping, with a wide variety of algorithms designed for specific experimental designs and applications. In addition to the usual application domain of SNP genotyping, these techniques have been successfully adapted to identify rare SNPs within a population, as well as detecting somatic SNVs within an individual using multiple tissue samples.
The stepwise mutation model (SMM) is a mathematical theory, developed by Motoo Kimura and Tomoko Ohta, that allows for investigation of the equilibrium distribution of allelic frequencies in a finite population where neutral alleles are produced in step-wise fashion.
The Infinite sites model (ISM) is a mathematical model of molecular evolution first proposed by Motoo Kimura in 1969. Like other mutation models, the ISM provides a basis for understanding how mutation develops new alleles in DNA sequences. Using allele frequencies, it allows for the calculation of heterozygosity, or genetic diversity, in a finite population and for the estimation of genetic distances between populations of interest.
Additive disequilibrium (D) is a statistic that estimates the difference between observed genotypic frequencies and the genotypic frequencies that would be expected under Hardy–Weinberg equilibrium. At a biallelic locus with alleles 1 and 2, the additive disequilibrium exists according to the equations
Multispecies Coalescent Process is a stochastic process model that describes the genealogical relationships for a sample of DNA sequences taken from several species. It represents the application of coalescent theory to the case of multiple species. The multispecies coalescent results in cases where the relationships among species for an individual gene can differ from the broader history of the species. It has important implications for the theory and practice of phylogenetics and for understanding genome evolution.
Allele age is the amount of time elapsed since an allele first appeared due to mutation. Estimating the time at which a certain allele appeared allows researchers to infer patterns of human migration, disease, and natural selection. Allele age can be estimated based on (1) the frequency of the allele in a population and (2) the genetic variation that occurs within different copies of the allele, also known as intra-allelic variation. While either of these methods can be used to estimate allele age, the use of both increases the accuracy of the estimation and can sometimes offer additional information regarding the presence of selection.


