In probability theory, the central limit theorem (CLT) states that, under appropriate conditions, the distribution of a normalized version of the sample mean converges to a standard normal distribution. This holds even if the original variables themselves are not normally distributed. There are several versions of the CLT, each applying in the context of different conditions.

In probability theory, a probability density function (PDF), density function, or density of an absolutely continuous random variable, is a function whose value at any given sample in the sample space can be interpreted as providing a relative likelihood that the value of the random variable would be equal to that sample. Probability density is the probability per unit length, in other words, while the absolute likelihood for a continuous random variable to take on any particular value is 0, the value of the PDF at two different samples can be used to infer, in any particular draw of the random variable, how much more likely it is that the random variable would be close to one sample compared to the other sample.
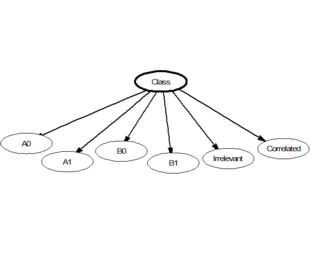
In statistics, naive Bayes classifiers are a family of linear "probabilistic classifiers" which assumes that the features are conditionally independent, given the target class. The strength (naivity) of this assumption is what gives the classifier its name. These classifiers are among the simplest Bayesian network models.
In statistics, maximum likelihood estimation (MLE) is a method of estimating the parameters of an assumed probability distribution, given some observed data. This is achieved by maximizing a likelihood function so that, under the assumed statistical model, the observed data is most probable. The point in the parameter space that maximizes the likelihood function is called the maximum likelihood estimate. The logic of maximum likelihood is both intuitive and flexible, and as such the method has become a dominant means of statistical inference.
In statistics, a statistic is sufficient with respect to a statistical model and its associated unknown parameter if "no other statistic that can be calculated from the same sample provides any additional information as to the value of the parameter". In particular, a statistic is sufficient for a family of probability distributions if the sample from which it is calculated gives no additional information than the statistic, as to which of those probability distributions is the sampling distribution.
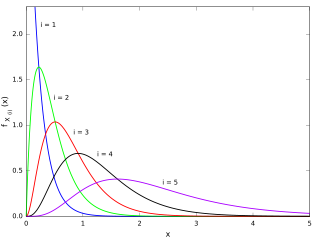
In statistics, the kth order statistic of a statistical sample is equal to its kth-smallest value. Together with rank statistics, order statistics are among the most fundamental tools in non-parametric statistics and inference.
In probability theory, the probability generating function of a discrete random variable is a power series representation (the generating function) of the probability mass function of the random variable. Probability generating functions are often employed for their succinct description of the sequence of probabilities Pr(X = i) in the probability mass function for a random variable X, and to make available the well-developed theory of power series with non-negative coefficients.

In probability theory, a martingale is a sequence of random variables for which, at a particular time, the conditional expectation of the next value in the sequence is equal to the present value, regardless of all prior values.
In statistics, the Rao–Blackwell theorem, sometimes referred to as the Rao–Blackwell–Kolmogorov theorem, is a result that characterizes the transformation of an arbitrarily crude estimator into an estimator that is optimal by the mean-squared-error criterion or any of a variety of similar criteria.
In statistical inference, specifically predictive inference, a prediction interval is an estimate of an interval in which a future observation will fall, with a certain probability, given what has already been observed. Prediction intervals are often used in regression analysis.

In mathematics, the inequality of arithmetic and geometric means, or more briefly the AM–GM inequality, states that the arithmetic mean of a list of non-negative real numbers is greater than or equal to the geometric mean of the same list; and further, that the two means are equal if and only if every number in the list is the same.

In probability theory, Buffon's needle problem is a question first posed in the 18th century by Georges-Louis Leclerc, Comte de Buffon:

In probability and statistics, the Dirichlet distribution (after Peter Gustav Lejeune Dirichlet), often denoted , is a family of continuous multivariate probability distributions parameterized by a vector of positive reals. It is a multivariate generalization of the beta distribution, hence its alternative name of multivariate beta distribution (MBD). Dirichlet distributions are commonly used as prior distributions in Bayesian statistics, and in fact, the Dirichlet distribution is the conjugate prior of the categorical distribution and multinomial distribution.
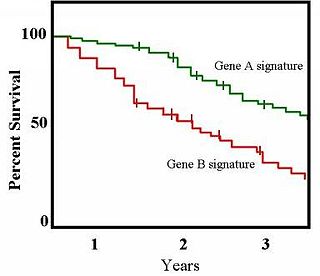
The Kaplan–Meier estimator, also known as the product limit estimator, is a non-parametric statistic used to estimate the survival function from lifetime data. In medical research, it is often used to measure the fraction of patients living for a certain amount of time after treatment. In other fields, Kaplan–Meier estimators may be used to measure the length of time people remain unemployed after a job loss, the time-to-failure of machine parts, or how long fleshy fruits remain on plants before they are removed by frugivores. The estimator is named after Edward L. Kaplan and Paul Meier, who each submitted similar manuscripts to the Journal of the American Statistical Association. The journal editor, John Tukey, convinced them to combine their work into one paper, which has been cited more than 61,800 times since its publication in 1958.
In statistics, multinomial logistic regression is a classification method that generalizes logistic regression to multiclass problems, i.e. with more than two possible discrete outcomes. That is, it is a model that is used to predict the probabilities of the different possible outcomes of a categorically distributed dependent variable, given a set of independent variables.
In statistics, an exchangeable sequence of random variables is a sequence X1, X2, X3, ... whose joint probability distribution does not change when the positions in the sequence in which finitely many of them appear are altered. In other words, the joint distribution is invariant to finite permutation. Thus, for example the sequences
Bootstrapping is any test or metric that uses random sampling with replacement, and falls under the broader class of resampling methods. Bootstrapping assigns measures of accuracy to sample estimates. This technique allows estimation of the sampling distribution of almost any statistic using random sampling methods.
In statistics, the bias of an estimator is the difference between this estimator's expected value and the true value of the parameter being estimated. An estimator or decision rule with zero bias is called unbiased. In statistics, "bias" is an objective property of an estimator. Bias is a distinct concept from consistency: consistent estimators converge in probability to the true value of the parameter, but may be biased or unbiased; see bias versus consistency for more.
In probability theory, comonotonicity mainly refers to the perfect positive dependence between the components of a random vector, essentially saying that they can be represented as increasing functions of a single random variable. In two dimensions it is also possible to consider perfect negative dependence, which is called countermonotonicity.
In computational statistics, the pseudo-marginal Metropolis–Hastings algorithm is a Monte Carlo method to sample from a probability distribution. It is an instance of the popular Metropolis–Hastings algorithm that extends its use to cases where the target density is not available analytically. It relies on the fact that the Metropolis–Hastings algorithm can still sample from the correct target distribution if the target density in the acceptance ratio is replaced by an estimate. It is especially popular in Bayesian statistics, where it is applied if the likelihood function is not tractable.


