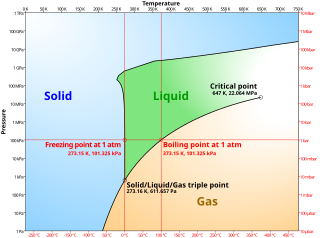
The boiling point of a substance is the temperature at which the vapor pressure of a liquid equals the pressure surrounding the liquid and the liquid changes into a vapor.

In thermodynamics, the thermodynamic free energy is one of the state functions of a thermodynamic system. The change in the free energy is the maximum amount of work that the system can perform in a process at constant temperature, and its sign indicates whether the process is thermodynamically favorable or forbidden. Since free energy usually contains potential energy, it is not absolute but depends on the choice of a zero point. Therefore, only relative free energy values, or changes in free energy, are physically meaningful.
A phase diagram in physical chemistry, engineering, mineralogy, and materials science is a type of chart used to show conditions at which thermodynamically distinct phases occur and coexist at equilibrium.
In chemical thermodynamics, activity is a measure of the "effective concentration" of a species in a mixture, in the sense that the species' chemical potential depends on the activity of a real solution in the same way that it would depend on concentration for an ideal solution. The term "activity" in this sense was coined by the American chemist Gilbert N. Lewis in 1907.
Physical or chemical properties of materials and systems can often be categorized as being either intensive or extensive, according to how the property changes when the size of the system changes. The terms "intensive and extensive quantities" were introduced into physics by German mathematician Georg Helm in 1898, and by American physicist and chemist Richard C. Tolman in 1917.
In thermodynamics, the Gibbs free energy is a thermodynamic potential that can be used to calculate the maximum amount of work, other than pressure-volume work, that may be performed by a thermodynamically closed system at constant temperature and pressure. It also provides a necessary condition for processes such as chemical reactions that may occur under these conditions. The Gibbs free energy is expressed as
In chemistry, the standard state of a material is a reference point used to calculate its properties under different conditions. A degree sign (°) or a superscript Plimsoll symbol (⦵) is used to designate a thermodynamic quantity in the standard state, such as change in enthalpy (ΔH°), change in entropy (ΔS°), or change in Gibbs free energy (ΔG°). The degree symbol has become widespread, although the Plimsoll is recommended in standards, see discussion about typesetting below.
Thermodynamic equilibrium is an axiomatic concept of thermodynamics. It is an internal state of a single thermodynamic system, or a relation between several thermodynamic systems connected by more or less permeable or impermeable walls. In thermodynamic equilibrium, there are no net macroscopic flows of matter nor of energy within a system or between systems. In a system that is in its own state of internal thermodynamic equilibrium, no macroscopic change occurs.
In thermodynamics, the phase rule is a general principle governing "pVT" systems, whose thermodynamic states are completely described by the variables pressure, volume and temperature, in thermodynamic equilibrium. If F is the number of degrees of freedom, C is the number of components and P is the number of phases, then

In thermodynamics, a critical point is the end point of a phase equilibrium curve. One example is the liquid–vapor critical point, the end point of the pressure–temperature curve that designates conditions under which a liquid and its vapor can coexist. At higher temperatures, the gas cannot be liquefied by pressure alone; at lower pressures, it cannot be liquefied by temperature alone. At the critical point, defined by a critical temperatureTc and a critical pressurepc, phase boundaries vanish. Other examples include the liquid–liquid critical points in mixtures, and the ferromagnet–paramagnet transition in the absence of an external magnetic field.
A solid solution, a term popularly used for metals, is a homogeneous mixture of two different kinds of atoms in solid state and having a single crystal structure. Many examples can be found in metallurgy, geology, and solid-state chemistry. The word "solution" is used to describe the intimate mixing of components at the atomic level and distinguishes these homogeneous materials from physical mixtures of components. Two terms are mainly associated with solid solutions – solvents and solutes, depending on the relative abundance of the atomic species.
In thermodynamics, a thermodynamic state of a system is its condition at a specific time; that is, fully identified by values of a suitable set of parameters known as state variables, state parameters or thermodynamic variables. Once such a set of values of thermodynamic variables has been specified for a system, the values of all thermodynamic properties of the system are uniquely determined. Usually, by default, a thermodynamic state is taken to be one of thermodynamic equilibrium. This means that the state is not merely the condition of the system at a specific time, but that the condition is the same, unchanging, over an indefinitely long duration of time.
In thermodynamics and chemical engineering, the vapor–liquid equilibrium (VLE) describes the distribution of a chemical species between the vapor phase and a liquid phase.
CALPHAD stands for CALculation of PHAse Diagrams, a methodology introduced in 1970 by Larry Kaufman. An equilibrium phase diagram is usually a diagram with axes for temperature and composition of a chemical system. It shows the regions where substances or solutions are stable and regions where two or more of them coexist. Phase diagrams are a very powerful tool for predicting the state of a system under different conditions and were initially a graphical method to rationalize experimental information on states of equilibrium. In complex systems, computational methods such as CALPHAD are employed to model thermodynamic properties for each phase and simulate multicomponent phase behavior. The CALPHAD approach is based on the fact that a phase diagram is a manifestation of the equilibrium thermodynamic properties of the system, which are the sum of the properties of the individual phases. It is thus possible to calculate a phase diagram by first assessing the thermodynamic properties of all the phases in a system.
In thermodynamics, the volume of a system is an important extensive parameter for describing its thermodynamic state. The specific volume, an intensive property, is the system's volume per unit mass. Volume is a function of state and is interdependent with other thermodynamic properties such as pressure and temperature. For example, volume is related to the pressure and temperature of an ideal gas by the ideal gas law. The physical region covered by a system may or may not coincide with a control volume used to analyze the system.

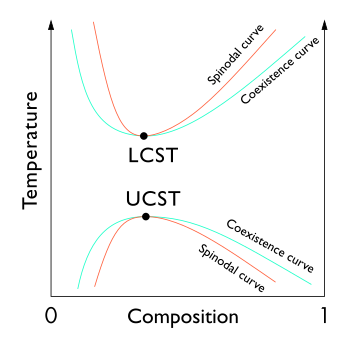
In thermodynamics, the limit of local stability against phase separation with respect to small fluctuations is clearly defined by the condition that the second derivative of Gibbs free energy is zero.

A residue curve describes the change in the composition of the liquid phase of a chemical mixture during continuous evaporation at the condition of vapor–liquid equilibrium. Multiple residue curves for a single system are called residue curves map.
In thermodynamics, explosive boiling or phase explosion is a method whereby a superheated metastable liquid undergoes an explosive liquid-vapor phase transition into a stable two-phase state because of a massive homogeneous nucleation of vapor bubbles. This concept was pioneered by M. M. Martynyuk in 1976 and then later advanced by Fucke and Seydel.
A miscibility gap is a region in a phase diagram for a mixture of components where the mixture exists as two or more phases – any region of composition of mixtures where the constituents are not completely miscible.

Phase separation is the creation of two distinct phases from a single homogeneous mixture. The most common type of phase separation is between two immiscible liquids, such as oil and water. This type of phase separation is known as liquid-liquid equilibrium. Colloids are formed by phase separation, though not all phase separations forms colloids - for example oil and water can form separated layers under gravity rather than remaining as microscopic droplets in suspension.