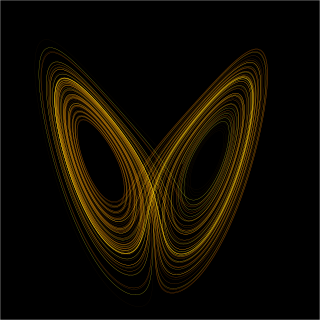
In chaos theory, the butterfly effect is the sensitive dependence on initial conditions in which a small change in one state of a deterministic nonlinear system can result in large differences in a later state.

Meteorology is a branch of the atmospheric sciences with a major focus on weather forecasting. The study of meteorology dates back millennia, though significant progress in meteorology did not begin until the 18th century. The 19th century saw modest progress in the field after weather observation networks were formed across broad regions. Prior attempts at prediction of weather depended on historical data. It was not until after the elucidation of the laws of physics, and more particularly in the latter half of the 20th century, the development of the computer that significant breakthroughs in weather forecasting were achieved. An important branch of weather forecasting is marine weather forecasting as it relates to maritime and coastal safety, in which weather effects also include atmospheric interactions with large bodies of water.

Weather forecasting is the application of science and technology to predict the conditions of the atmosphere for a given location and time. People have attempted to predict the weather informally for millennia and formally since the 19th century.
In mathematics and applied mathematics, perturbation theory comprises methods for finding an approximate solution to a problem, by starting from the exact solution of a related, simpler problem. A critical feature of the technique is a middle step that breaks the problem into "solvable" and "perturbative" parts. In perturbation theory, the solution is expressed as a power series in a small parameter . The first term is the known solution to the solvable problem. Successive terms in the series at higher powers of usually become smaller. An approximate 'perturbation solution' is obtained by truncating the series, usually by keeping only the first two terms, the solution to the known problem and the 'first order' perturbation correction.
Numerical weather prediction (NWP) uses mathematical models of the atmosphere and oceans to predict the weather based on current weather conditions. Though first attempted in the 1920s, it was not until the advent of computer simulation in the 1950s that numerical weather predictions produced realistic results. A number of global and regional forecast models are run in different countries worldwide, using current weather observations relayed from radiosondes, weather satellites and other observing systems as inputs.
The Rayleigh–Taylor instability, or RT instability, is an instability of an interface between two fluids of different densities which occurs when the lighter fluid is pushing the heavier fluid. Examples include the behavior of water suspended above oil in the gravity of Earth, mushroom clouds like those from volcanic eruptions and atmospheric nuclear explosions, supernova explosions in which expanding core gas is accelerated into denser shell gas, instabilities in plasma fusion reactors and inertial confinement fusion.
Ensemble forecasting is a method used in or within numerical weather prediction. Instead of making a single forecast of the most likely weather, a set of forecasts is produced. This set of forecasts aims to give an indication of the range of possible future states of the atmosphere. Ensemble forecasting is a form of Monte Carlo analysis. The multiple simulations are conducted to account for the two usual sources of uncertainty in forecast models: (1) the errors introduced by the use of imperfect initial conditions, amplified by the chaotic nature of the evolution equations of the atmosphere, which is often referred to as sensitive dependence on initial conditions; and (2) errors introduced because of imperfections in the model formulation, such as the approximate mathematical methods to solve the equations. Ideally, the verified future atmospheric state should fall within the predicted ensemble spread, and the amount of spread should be related to the uncertainty (error) of the forecast. In general, this approach can be used to make probabilistic forecasts of any dynamical system, and not just for weather prediction.
Data assimilation is a mathematical discipline that seeks to optimally combine theory with observations. There may be a number of different goals sought – for example, to determine the optimal state estimate of a system, to determine initial conditions for a numerical forecast model, to interpolate sparse observation data using knowledge of the system being observed, to set numerical parameters based on training a model from observed data. Depending on the goal, different solution methods may be used. Data assimilation is distinguished from other forms of machine learning, image analysis, and statistical methods in that it utilizes a dynamical model of the system being analyzed.
Probabilistic forecasting summarizes what is known about, or opinions about, future events. In contrast to single-valued forecasts, probabilistic forecasts assign a probability to each of a number of different outcomes, and the complete set of probabilities represents a probability forecast. Thus, probabilistic forecasting is a type of probabilistic classification.

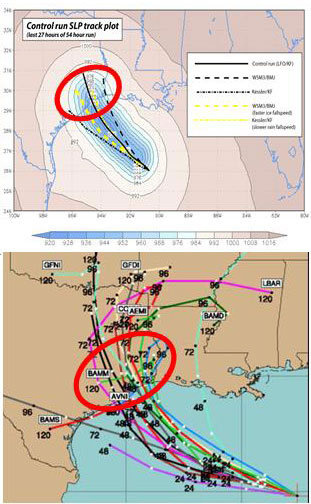
A tropical cyclone forecast model is a computer program that uses meteorological data to forecast aspects of the future state of tropical cyclones. There are three types of models: statistical, dynamical, or combined statistical-dynamic. Dynamical models utilize powerful supercomputers with sophisticated mathematical modeling software and meteorological data to calculate future weather conditions. Statistical models forecast the evolution of a tropical cyclone in a simpler manner, by extrapolating from historical datasets, and thus can be run quickly on platforms such as personal computers. Statistical-dynamical models use aspects of both types of forecasting. Four primary types of forecasts exist for tropical cyclones: track, intensity, storm surge, and rainfall. Dynamical models were not developed until the 1970s and the 1980s, with earlier efforts focused on the storm surge problem.

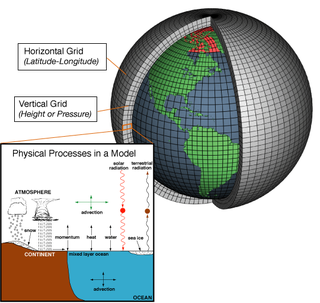
In atmospheric science, an atmospheric model is a mathematical model constructed around the full set of primitive, dynamical equations which govern atmospheric motions. It can supplement these equations with parameterizations for turbulent diffusion, radiation, moist processes, heat exchange, soil, vegetation, surface water, the kinematic effects of terrain, and convection. Most atmospheric models are numerical, i.e. they discretize equations of motion. They can predict microscale phenomena such as tornadoes and boundary layer eddies, sub-microscale turbulent flow over buildings, as well as synoptic and global flows. The horizontal domain of a model is either global, covering the entire Earth, or regional (limited-area), covering only part of the Earth. The different types of models run are thermotropic, barotropic, hydrostatic, and nonhydrostatic. Some of the model types make assumptions about the atmosphere which lengthens the time steps used and increases computational speed.
In the fields of nonlinear optics and fluid dynamics, modulational instability or sideband instability is a phenomenon whereby deviations from a periodic waveform are reinforced by nonlinearity, leading to the generation of spectral-sidebands and the eventual breakup of the waveform into a train of pulses.
An atmospheric reanalysis is a meteorological and climate data assimilation project which aims to assimilate historical atmospheric observational data spanning an extended period, using a single consistent assimilation scheme throughout.

Eugenia Enriqueta Kalnay is an Argentine meteorologist and a Distinguished University Professor of Atmospheric and Oceanic Science, which is part of the University of Maryland College of Computer, Mathematical, and Natural Sciences at the University of Maryland, College Park in the United States.
In applied mathematics and dynamical system theory, Lyapunov vectors, named after Aleksandr Lyapunov, describe characteristic expanding and contracting directions of a dynamical system. They have been used in predictability analysis and as initial perturbations for ensemble forecasting in numerical weather prediction. In modern practice they are often replaced by bred vectors for this purpose.

The history of numerical weather prediction considers how current weather conditions as input into mathematical models of the atmosphere and oceans to predict the weather and future sea state has changed over the years. Though first attempted manually in the 1920s, it was not until the advent of the computer and computer simulation that computation time was reduced to less than the forecast period itself. ENIAC was used to create the first forecasts via computer in 1950, and over the years more powerful computers have been used to increase the size of initial datasets and use more complicated versions of the equations of motion. The development of global forecasting models led to the first climate models. The development of limited area (regional) models facilitated advances in forecasting the tracks of tropical cyclone as well as air quality in the 1970s and 1980s.
A prognostic chart is a map displaying the likely weather forecast for a future time. Such charts generated by atmospheric models as output from numerical weather prediction and contain a variety of information such as temperature, wind, precipitation and weather fronts. They can also indicate derived atmospheric fields such as vorticity, stability indices, or frontogenesis. Forecast errors need to be taken into account and can be determined either via absolute error, or by considering persistence and absolute error combined.
The North American Ensemble Forecast System (NAEFS) is a joint project involving the Meteorological Service of Canada (MSC) in Canada, the National Weather Service (NWS) in the United States, and the National Meteorological Service of Mexico (NMSM) in Mexico providing numerical weather prediction ensemble guidance for the 1- to 16-day forecast period. The NAEFS combines the Canadian MSC and the US NWS global ensemble prediction systems, improving probabilistic operational guidance over what can be built from any individual country's ensemble. Model guidance from the NAEFS is incorporated into the forecasts of the respective national agencies.
The Jule G. Charney Award is the American Meteorological Society's award granted to "individuals in recognition of highly significant research or development achievement in the atmospheric or hydrologic sciences". The prize was originally known as the Second Half Century Award, and first awarded to mark to fiftieth anniversary of the society.
In solid mechanics, the linear stability analysis of an elastic solution is studied using the method of incremental deformations superposed on finite deformations. The method of incremental deformation can be used to solve static, quasi-static and time-dependent problems. The governing equations of the motion are ones of the classical mechanics, such as the conservation of mass and the balance of linear and angular momentum, which provide the equilibrium configuration of the material. The main corresponding mathematical framework is described in the main Raymond Ogden's book Non-linear elastic deformations and in Biot's book Mechanics of incremental deformations, which is a collection of his main papers.
