Checking whether a coin is fair

Last updated

In statistics, the question of checking whether a coin is fair is one whose importance lies, firstly, in providing a simple problem on which to illustrate basic ideas of statistical inference and, secondly, in providing a simple problem that can be used to compare various competing methods of statistical inference, including decision theory. The practical problem of checking whether a coin is fair might be considered as easily solved by performing a sufficiently large number of trials, but statistics and probability theory can provide guidance on two types of question; specifically those of how many trials to undertake and of the accuracy of an estimate of the probability of turning up heads, derived from a given sample of trials.

Contents

A fair coin is an idealized randomizing device with two states (usually named "heads" and "tails") which are equally likely to occur. It is based on the coin flip used widely in sports and other situations where it is required to give two parties the same chance of winning. Either a specially designed chip or more usually a simple currency coin is used, although the latter might be slightly "unfair" due to an asymmetrical weight distribution, which might cause one state to occur more frequently than the other, giving one party an unfair advantage. [1] So it might be necessary to test experimentally whether the coin is in fact "fair" that is, whether the probability of the coin's falling on either side when it is tossed is exactly 50%. It is of course impossible to rule out arbitrarily small deviations from fairness such as might be expected to affect only one flip in a lifetime of flipping; also it is always possible for an unfair (or "biased") coin to happen to turn up exactly 10 heads in 20 flips. Therefore, any fairness test must only establish a certain degree of confidence in a certain degree of fairness (a certain maximum bias). In more rigorous terminology, the problem is of determining the parameters of a Bernoulli process, given only a limited sample of Bernoulli trials.

Preamble

This article describes experimental procedures for determining whether a coin is fair or unfair. There are many statistical methods for analyzing such an experimental procedure. This article illustrates two of them.

Both methods prescribe an experiment (or trial) in which the coin is tossed many times and the result of each toss is recorded. The results can then be analysed statistically to decide whether the coin is "fair" or "probably not fair".

An important difference between these two approaches is that the first approach gives some weight to one's prior experience of tossing coins, while the second does not. The question of how much weight to give to prior experience, depending on the quality (credibility) of that experience, is discussed under credibility theory.

Posterior probability density function

One method is to calculate the posterior probability density function of Bayesian probability theory.

A test is performed by tossing the coin N times and noting the observed numbers of heads, h, and tails, t. The symbols H and T represent more generalised variables expressing the numbers of heads and tails respectively that might have been observed in the experiment. Thus N = H + T = h + t.

Next, let r be the actual probability of obtaining heads in a single toss of the coin. This is the property of the coin which is being investigated. Using Bayes' theorem, the posterior probability density of r conditional on h and t is expressed as follows:

where g(r) represents the prior probability density distribution of r, which lies in the range 0 to 1.

The prior probability density distribution summarizes what is known about the distribution of r in the absence of any observation. We will assume that the prior distribution of r is uniform over the interval [0, 1]. That is, g(r) = 1. (In practice, it would be more appropriate to assume a prior distribution which is much more heavily weighted in the region around 0.5, to reflect our experience with real coins.)

The probability of obtaining h heads in N tosses of a coin with a probability of heads equal to r is given by the binomial distribution:

Substituting this into the previous formula:

This is in fact a beta distribution (the conjugate prior for the binomial distribution), whose denominator can be expressed in terms of the beta function:

As a uniform prior distribution has been assumed, and because h and t are integers, this can also be written in terms of factorials:

Example

For example, let N = 10, h = 7, i.e. the coin is tossed 10 times and 7 heads are obtained:

The graph on the right shows the probability density function of r given that 7 heads were obtained in 10 tosses. (Note: r is the probability of obtaining heads when tossing the same coin once.)

Plot of the probability density f(r | H = 7, T = 3) = 1320 r (1 - r) with r ranging from 0 to 1 Plot of 1320p7q3at500by420.png
Plot of the probability density f(r | H = 7, T = 3) = 1320 r (1  r) with r ranging from 0 to 1

The probability for an unbiased coin (defined for this purpose as one whose probability of coming down heads is somewhere between 45% and 55%)

is small when compared with the alternative hypothesis (a biased coin). However, it is not small enough to cause us to believe that the coin has a significant bias. This probability is slightly higher than our presupposition of the probability that the coin was fair corresponding to the uniform prior distribution, which was 10%. Using a prior distribution that reflects our prior knowledge of what a coin is and how it acts, the posterior distribution would not favor the hypothesis of bias. However the number of trials in this example (10 tosses) is very small, and with more trials the choice of prior distribution would be somewhat less relevant.)

With the uniform prior, the posterior probability distribution f(r | H = 7,T = 3) achieves its peak at r = h / (h + t) = 0.7; this value is called the maximum a posteriori (MAP) estimate of r. Also with the uniform prior, the expected value of r under the posterior distribution is


Estimator of true probability

The best estimator for the actual value is the estimator .

This estimator has a margin of error (E) where at a particular confidence level.

Using this approach, to decide the number of times the coin should be tossed, two parameters are required:

  1. The confidence level which is denoted by confidence interval (Z)
  2. The maximum (acceptable) error (E)
Z valueConfidence levelComment
0.6745gives 50.000% level of confidenceHalf
1.0000gives 68.269% level of confidenceOne std dev
1.6449gives 90.000% level of confidence"One nine"
1.9599gives 95.000% level of confidence95 percent
2.0000gives 95.450% level of confidenceTwo std dev
2.5759gives 99.000% level of confidence"Two nines"
3.0000gives 99.730% level of confidenceThree std dev
3.2905gives 99.900% level of confidence"Three nines"
3.8906gives 99.990% level of confidence"Four nines"
4.0000gives 99.993% level of confidenceFour std dev
4.4172gives 99.999% level of confidence"Five nines"

where n is the number of trials (which was denoted by N in the previous section).

This standard error function of p has a maximum at . Further, in the case of a coin being tossed, it is likely that p will be not far from 0.5, so it is reasonable to take p=0.5 in the following:

And hence the value of maximum error (E) is given by

Solving for the required number of coin tosses, n,

Examples

1. If a maximum error of 0.01 is desired, how many times should the coin be tossed?

at 68.27% level of confidence (Z=1)
at 95.45% level of confidence (Z=2)
at 99.90% level of confidence (Z=3.3)

2. If the coin is tossed 10000 times, what is the maximum error of the estimator on the value of (the actual probability of obtaining heads in a coin toss)?

at 68.27% level of confidence (Z=1)
at 95.45% level of confidence (Z=2)
at 99.90% level of confidence (Z=3.3)

3. The coin is tossed 12000 times with a result of 5961 heads (and 6039 tails). What interval does the value of (the true probability of obtaining heads) lie within if a confidence level of 99.999% is desired?

Now find the value of Z corresponding to 99.999% level of confidence.

Now calculate E

The interval which contains r is thus:

Other approaches

Other approaches to the question of checking whether a coin is fair are available using decision theory, whose application would require the formulation of a loss function or utility function which describes the consequences of making a given decision. An approach that avoids requiring either a loss function or a prior probability (as in the Bayesian approach) is that of "acceptance sampling". [2]

Other applications

The above mathematical analysis for determining if a coin is fair can also be applied to other uses. For example:

See also

Related Research Articles

<span class="mw-page-title-main">Binomial distribution</span> Probability distribution

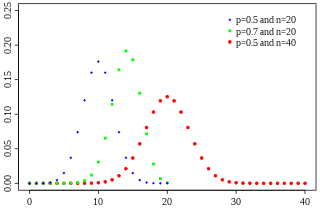
In probability theory and statistics, the binomial distribution with parameters n and p is the discrete probability distribution of the number of successes in a sequence of n independent experiments, each asking a yes–no question, and each with its own Boolean-valued outcome: success or failure. A single success/failure experiment is also called a Bernoulli trial or Bernoulli experiment, and a sequence of outcomes is called a Bernoulli process; for a single trial, i.e., n = 1, the binomial distribution is a Bernoulli distribution. The binomial distribution is the basis for the popular binomial test of statistical significance.

<span class="mw-page-title-main">Normal distribution</span> Probability distribution

In statistics, a normal distribution or Gaussian distribution is a type of continuous probability distribution for a real-valued random variable. The general form of its probability density function is

<span class="mw-page-title-main">Standard deviation</span> In statistics, a measure of variation

In statistics, the standard deviation is a measure of the amount of variation or dispersion of a set of values. A low standard deviation indicates that the values tend to be close to the mean of the set, while a high standard deviation indicates that the values are spread out over a wider range.

The likelihood function is the joint probability of observed data viewed as a function of the parameters of a statistical model.

<span class="mw-page-title-main">Exponential distribution</span> Probability distribution

In probability theory and statistics, the exponential distribution or negative exponential distribution is the probability distribution of the time between events in a Poisson point process, i.e., a process in which events occur continuously and independently at a constant average rate. It is a particular case of the gamma distribution. It is the continuous analogue of the geometric distribution, and it has the key property of being memoryless. In addition to being used for the analysis of Poisson point processes it is found in various other contexts.

Bayesian inference is a method of statistical inference in which Bayes' theorem is used to update the probability for a hypothesis as more evidence or information becomes available. Bayesian inference is an important technique in statistics, and especially in mathematical statistics. Bayesian updating is particularly important in the dynamic analysis of a sequence of data. Bayesian inference has found application in a wide range of activities, including science, engineering, philosophy, medicine, sport, and law. In the philosophy of decision theory, Bayesian inference is closely related to subjective probability, often called "Bayesian probability".

<span class="mw-page-title-main">Bernoulli process</span> Random process of binary (boolean) random variables

In probability and statistics, a Bernoulli process is a finite or infinite sequence of binary random variables, so it is a discrete-time stochastic process that takes only two values, canonically 0 and 1. The component Bernoulli variablesXi are identically distributed and independent. Prosaically, a Bernoulli process is a repeated coin flipping, possibly with an unfair coin. Every variable Xi in the sequence is associated with a Bernoulli trial or experiment. They all have the same Bernoulli distribution. Much of what can be said about the Bernoulli process can also be generalized to more than two outcomes ; this generalization is known as the Bernoulli scheme.

In statistics, maximum likelihood estimation (MLE) is a method of estimating the parameters of an assumed probability distribution, given some observed data. This is achieved by maximizing a likelihood function so that, under the assumed statistical model, the observed data is most probable. The point in the parameter space that maximizes the likelihood function is called the maximum likelihood estimate. The logic of maximum likelihood is both intuitive and flexible, and as such the method has become a dominant means of statistical inference.

<span class="mw-page-title-main">Beta distribution</span> Probability distribution

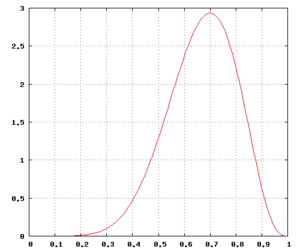
In probability theory and statistics, the beta distribution is a family of continuous probability distributions defined on the interval [0, 1] or in terms of two positive parameters, denoted by alpha (α) and beta (β), that appear as exponents of the variable and its complement to 1, respectively, and control the shape of the distribution.

<span class="mw-page-title-main">Rayleigh distribution</span> Probability distribution

In probability theory and statistics, the Rayleigh distribution is a continuous probability distribution for nonnegative-valued random variables. Up to rescaling, it coincides with the chi distribution with two degrees of freedom. The distribution is named after Lord Rayleigh.

A prior probability distribution of an uncertain quantity, often simply called the prior, is its assumed probability distribution before some evidence is taken into account. For example, the prior could be the probability distribution representing the relative proportions of voters who will vote for a particular politician in a future election. The unknown quantity may be a parameter of the model or a latent variable rather than an observable variable.

In null-hypothesis significance testing, the p-value is the probability of obtaining test results at least as extreme as the result actually observed, under the assumption that the null hypothesis is correct. A very small p-value means that such an extreme observed outcome would be very unlikely under the null hypothesis. Even though reporting p-values of statistical tests is common practice in academic publications of many quantitative fields, misinterpretation and misuse of p-values is widespread and has been a major topic in mathematics and metascience. In 2016, the American Statistical Association (ASA) made a formal statement that "p-values do not measure the probability that the studied hypothesis is true, or the probability that the data were produced by random chance alone" and that "a p-value, or statistical significance, does not measure the size of an effect or the importance of a result" or "evidence regarding a model or hypothesis." That said, a 2019 task force by ASA has issued a statement on statistical significance and replicability, concluding with: "p-values and significance tests, when properly applied and interpreted, increase the rigor of the conclusions drawn from data."

In Bayesian statistics, a maximum a posteriori probability (MAP) estimate is an estimate of an unknown quantity, that equals the mode of the posterior distribution. The MAP can be used to obtain a point estimate of an unobserved quantity on the basis of empirical data. It is closely related to the method of maximum likelihood (ML) estimation, but employs an augmented optimization objective which incorporates a prior distribution over the quantity one wants to estimate. MAP estimation can therefore be seen as a regularization of maximum likelihood estimation.

In statistics, a binomial proportion confidence interval is a confidence interval for the probability of success calculated from the outcome of a series of success–failure experiments. In other words, a binomial proportion confidence interval is an interval estimate of a success probability p when only the number of experiments n and the number of successes nS are known.

Bootstrapping is any test or metric that uses random sampling with replacement, and falls under the broader class of resampling methods. Bootstrapping assigns measures of accuracy to sample estimates. This technique allows estimation of the sampling distribution of almost any statistic using random sampling methods.

In estimation theory and decision theory, a Bayes estimator or a Bayes action is an estimator or decision rule that minimizes the posterior expected value of a loss function. Equivalently, it maximizes the posterior expectation of a utility function. An alternative way of formulating an estimator within Bayesian statistics is maximum a posteriori estimation.

<span class="mw-page-title-main">Fair coin</span>

In probability theory and statistics, a sequence of independent Bernoulli trials with probability 1/2 of success on each trial is metaphorically called a fair coin. One for which the probability is not 1/2 is called a biased or unfair coin. In theoretical studies, the assumption that a coin is fair is often made by referring to an ideal coin.

<span class="mw-page-title-main">Half-normal distribution</span> Probability distribution

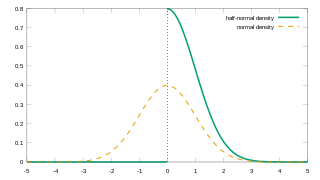
In probability theory and statistics, the half-normal distribution is a special case of the folded normal distribution.

In statistics, additive smoothing, also called Laplace smoothing or Lidstone smoothing, is a technique used to smooth categorical data. Given a set of observation counts from a -dimensional multinomial distribution with trials, a "smoothed" version of the counts gives the estimator:

In statistical inference, the concept of a confidence distribution (CD) has often been loosely referred to as a distribution function on the parameter space that can represent confidence intervals of all levels for a parameter of interest. Historically, it has typically been constructed by inverting the upper limits of lower sided confidence intervals of all levels, and it was also commonly associated with a fiducial interpretation, although it is a purely frequentist concept. A confidence distribution is NOT a probability distribution function of the parameter of interest, but may still be a function useful for making inferences.

References

  1. However, if the coin is caught rather than allowed to bounce or spin, it is difficult to bias a coin flip's outcome. See Gelman, Andrew; Deborah Nolan (2002). "Teacher's Corner: You Can Load a Die, But You Can't Bias a Coin". American Statistician. 56 (4): 308–311. doi:10.1198/000313002605. S2CID   123597087.
  2. Cox, D.R., Hinkley, D.V. (1974) Theoretical Statistics (Example 11.7), Chapman & Hall. ISBN   0-412-12420-3