Related Research Articles

Flow cytometry (FC) is a technique used to detect and measure physical and chemical characteristics of a population of cells or particles.

Fluorescence spectroscopy is a type of electromagnetic spectroscopy that analyzes fluorescence from a sample. It involves using a beam of light, usually ultraviolet light, that excites the electrons in molecules of certain compounds and causes them to emit light; typically, but not necessarily, visible light. A complementary technique is absorption spectroscopy. In the special case of single molecule fluorescence spectroscopy, intensity fluctuations from the emitted light are measured from either single fluorophores, or pairs of fluorophores.

Förster resonance energy transfer (FRET), fluorescence resonance energy transfer (FRET), resonance energy transfer (RET) or electronic energy transfer (EET) is a mechanism describing energy transfer between two light-sensitive molecules (chromophores). A donor chromophore, initially in its electronic excited state, may transfer energy to an acceptor chromophore through nonradiative dipole–dipole coupling. The efficiency of this energy transfer is inversely proportional to the sixth power of the distance between donor and acceptor, making FRET extremely sensitive to small changes in distance.
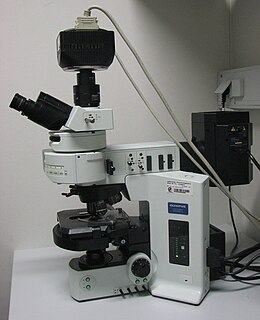
A fluorescence microscope is an optical microscope that uses fluorescence instead of, or in addition to, scattering, reflection, and attenuation or absorption, to study the properties of organic or inorganic substances. "Fluorescence microscope" refers to any microscope that uses fluorescence to generate an image, whether it is a more simple set up like an epifluorescence microscope or a more complicated design such as a confocal microscope, which uses optical sectioning to get better resolution of the fluorescence image.

Hoechst stains are part of a family of blue fluorescent dyes used to stain DNA. These Bis-benzimides were originally developed by Hoechst AG, which numbered all their compounds so that the dye Hoechst 33342 is the 33,342nd compound made by the company. There are three related Hoechst stains: Hoechst 33258, Hoechst 33342, and Hoechst 34580. The dyes Hoechst 33258 and Hoechst 33342 are the ones most commonly used and they have similar excitation–emission spectra.
Phycobilisomes are light harvesting antennae of photosystem II in cyanobacteria, red algae and glaucophytes.
Chemical imaging is the analytical capability to create a visual image of components distribution from simultaneous measurement of spectra and spatial, time information. Hyperspectral imaging measures contiguous spectral bands, as opposed to multispectral imaging which measures spaced spectral bands.
FlowJo is a software package for analyzing flow cytometry data. Files produced by modern flow cytometers are written in the Flow Cytometry Standard format with an .fcs file extension. FlowJo will import and analyze cytometry data regardless of which flow cytometer is used to collect the data.
Microfluorimetry is an adaption of fluorimetry for studying the biochemical and biophysical properties of cells by using microscopy to image cell components tagged with fluorescent molecules. It is a type of microphotometry that gives a quantitative measure of the qualitative nature of fluorescent measurement and therefore, allows for definitive results that would have been previously indiscernible to the naked eye.

Cytometry is the measurement of the characteristics of cells. Variables that can be measured by cytometric methods include cell size, cell count, cell morphology, cell cycle phase, DNA content, and the existence or absence of specific proteins on the cell surface or in the cytoplasm. Cytometry is used to characterize and count blood cells in common blood tests such as the complete blood count. In a similar fashion, cytometry is also used in cell biology research and in medical diagnostics to characterize cells in a wide range of applications associated with diseases such as cancer and AIDS.
Cell cycle analysis by DNA content measurement is a method that most frequently employs flow cytometry to distinguish cells in different phases of the cell cycle. Before analysis, the cells are usually permeabilised and treated with a fluorescent dye that stains DNA quantitatively, such as propidium iodide (PI) or 4,6-diamidino-2-phenylindole (DAPI). The fluorescence intensity of the stained cells correlates with the amount of DNA they contain. As the DNA content doubles during the S phase, the DNA content (and thereby intensity of fluorescence) of cells in the G0 phase and G1 phase (before S), in the S phase, and in the G2 phase and M phase (after S) identifies the cell cycle phase position in the major phases (G0/G1 versus S versus G2/M phase) of the cell cycle. The cellular DNA content of individual cells is often plotted as their frequency histogram to provide information about relative frequency (percentage) of cells in the major phases of the cell cycle.

Fluo-3 is a fluorescence indicator of intracellular calcium (Ca2+). It is used to measure Ca2+ inside living cells in flow cytometry and confocal laser scanning microscopy using visible light excitation (compatible with argon laser sources operating at 488 nm). Fluo-3 is an essentially nonfluorescent compound, but upon binding of Ca2+ its fluorescence increases sharply with an emission maximum at 525 nm suitable for conventionally used detectors designed for fluorescein isothiocyanate (FITC) measurements. This large change in fluorescence coupled with a good yield of photons provides very high contrast which allowed the detection of microscopic Ca2+ release events inside cells called "Calcium sparks". Whereas the salts of fluo-3 are unable to penetrate cells, loading can be achieved using its acetoxymethyl (AM) ester derivative. Once inside the cell, unspecific esterases cleave the ester effectively trapping fluo-3.
Mass cytometry is a mass spectrometry technique based on inductively coupled plasma mass spectrometry and time of flight mass spectrometry used for the determination of the properties of cells (cytometry). In this approach, antibodies are conjugated with isotopically pure elements, and these antibodies are used to label cellular proteins. Cells are nebulized and sent through an argon plasma, which ionizes the metal-conjugated antibodies. The metal signals are then analyzed by a time-of-flight mass spectrometer. The approach overcomes limitations of spectral overlap in flow cytometry by utilizing discrete isotopes as a reporter system instead of traditional fluorophores which have broad emission spectra.
Flow cytometry bioinformatics is the application of bioinformatics to flow cytometry data, which involves storing, retrieving, organizing and analyzing flow cytometry data using extensive computational resources and tools. Flow cytometry bioinformatics requires extensive use of and contributes to the development of techniques from computational statistics and machine learning. Flow cytometry and related methods allow the quantification of multiple independent biomarkers on large numbers of single cells. The rapid growth in the multidimensionality and throughput of flow cytometry data, particularly in the 2000s, has led to the creation of a variety of computational analysis methods, data standards, and public databases for the sharing of results.
EuroFlow consortium was founded in 2005 as 2U-FP6 funded project and launched in spring 2006. At first, EuroFlow was composed of 18 diagnostic research groups and two SMEs from eight different European countries with complementary knowledge and skills in the field of flow cytometry and immunophenotyping. During 2012 both SMEs left the project so it obtained full scientific independence. The goal of EuroFlow consortium is to innovate and standardize flow cytometry leading to global improvement and progress in diagnostics of haematological malignancies and individualisation of treatment.
An imaging cycler microscope (ICM) is a fully automated (epi)fluorescence microscope which overcomes the spectral resolution limit resulting in parameter- and dimension-unlimited fluorescence imaging. The principle and robotic device was described by Walter Schubert in 1997 and has been further developed with his co-workers within the human toponome project. The ICM runs robotically controlled repetitive incubation-imaging-bleaching cycles with dye-conjugated probe libraries recognizing target structures in situ. This results in the transmission of a randomly large number of distinct biological informations by re-using the same fluorescence channel after bleaching for the transmission of another biological information using the same dye which is conjugated to another specific probe, a.s.o. Thereby noise-reduced quasi-multichannel fluorescence images with reproducible physical, geometrical, and biophysical stabilities are generated. The resulting power of combinatorial molecular discrimination (PCMD) per data point is given by 65,536k, where 65,536 is the number of grey value levels, and k is the number of co-mapped biomolecules and/or subdomains per biomolecule(s). High PCMD has been shown for k = 100, and in principle can be expanded for much higher numbers of k. In contrast to traditional multichannel–few-parameter fluorescence microscopy high PCMDs in an ICM lead to high functional and spatial resolution. Systematic ICM analysis of biological systems reveals the supramolecular segregation law that describes the principle of order of large, hierarchically organized biomolecular networks in situ (toponome). The ICM is the core technology for the systematic mapping of the complete protein network code in tissues. The original ICM method includes any modification of the bleaching step. Corresponding modifications have been reported for antibody retrieval and chemical dye-quenching debated recently. The Toponome Imaging Systems (TIS) and multi-epitope-ligand cartographs (MELC) represent different stages of the ICM technological development. Imaging cycler microscopy received the American ISAC best paper award in 2008 for the three symbol code of organized proteomes.

Cytometry Part A is a peer-reviewed scientific journal covering all aspects of the study of cytometry that was established in 1980. It is the official journal of the International Society for Advancement of Cytometry.
Flow Cytometry Standard (FCS) is a data file standard for the reading and writing of data from flow cytometry experiments. The FCS specification has traditionally been developed and maintained by the International Society for Advancement of Cytometry (ISAC). FCS used to be the only widely adopted file format in flow cytometry. Recently, additional standard file formats have been developed by ISAC.
SYTOX is a high-affinity nucleic acid stain developed by biotechnology company Molecular Probes. Because the stain only penetrates cells with compromised plasma membranes, it can be used to investigate antibacterial mechanism of action and confirm loss of bacterial viability.
Bacterioplankton counting is the estimation of the abundance of bacterioplankton in a specific body of water, which is useful information to marine microbiologists. Various counting methodologies have been developed over the years to determine the number present in the water being observed. Methods used for counting bacterioplankton include epifluorescence microscopy, flow cytometry, measures of productivity through frequency of dividing cells (FDC), thymine incorporation, and leucine incorporation.
References
- ↑ Roederer, M. (2001-11-01). "Spectral compensation for flow cytometry: visualization artifacts, limitations, and caveats". Cytometry. 45 (3): 194–205. doi: 10.1002/1097-0320(20011101)45:3<194::aid-cyto1163>3.0.co;2-c . ISSN 0196-4763. PMID 11746088.
- ↑ Bagwell, C. B.; Adams, E. G. (1993-03-20). "Fluorescence spectral overlap compensation for any number of flow cytometry parameters". Annals of the New York Academy of Sciences. 677: 167–184. doi:10.1111/j.1749-6632.1993.tb38775.x. ISSN 0077-8923. PMID 8494206.
- ↑ Loken, M. R.; Parks, D. R.; Herzenberg, L. A. (July 1977). "Two-color immunofluorescence using a fluorescence-activated cell sorter". The Journal of Histochemistry and Cytochemistry. 25 (7): 899–907. doi: 10.1177/25.7.330738 . ISSN 0022-1554. PMID 330738.
- ↑ Roederer, M. (2001-11-01). "Spectral compensation for flow cytometry: visualization artifacts, limitations, and caveats". Cytometry. 45 (3): 194–205. doi: 10.1002/1097-0320(20011101)45:3<194::aid-cyto1163>3.0.co;2-c . ISSN 0196-4763. PMID 11746088.