Flow cytometry

Last updated
Flow cytometry
FACS-buisje.JPG
A flow cytometer with sample injection tube.
Classification Cytometry
AnalytesCells or particles
Other techniques
Related Coulter counter

Flow cytometry (FC) is a technique used to detect and measure the physical and chemical characteristics of a population of cells or particles. [1] [2] [3] [4]

Contents

In this process, a sample containing cells or particles is suspended in a fluid and injected into the flow cytometer instrument. The sample is focused to ideally flow one cell at a time through a laser beam, where the light scattered is characteristic to the cells and their components. Cells are often labeled with fluorescent markers so light is absorbed and then emitted in a band of wavelengths. Tens of thousands of cells can be quickly examined and the data gathered are processed by a computer. [5]

Flow cytometry is routinely used in basic research, clinical practice, and clinical trials. Uses for flow cytometry include:

A flow cytometry analyzer is an instrument that provides quantifiable data from a sample. Other instruments using flow cytometry include cell sorters which physically separate and thereby purify cells of interest based on their optical properties.

History

The first impedance-based flow cytometry device, using the Coulter principle, was disclosed in U.S. Patent 2,656,508, issued in 1953, to Wallace H. Coulter. Mack Fulwyler was the inventor of the forerunner to today's flow cytometers – particularly the cell sorter. [6] Fulwyler developed this in 1965 with his publication in Science . [7] The first fluorescence-based flow cytometry device (ICP 11) was developed in 1968 by Wolfgang Göhde from the University of Münster, filed for patent on 18 December 1968 [8] and first commercialized in 1968/69 by German developer and manufacturer Partec through Phywe AG in Göttingen. At that time, absorption methods were still widely favored by other scientists over fluorescence methods. [9] Soon after, flow cytometry instruments were developed, including the Cytofluorograph (1971) from Bio/Physics Systems Inc. (later: Ortho Diagnostics), the PAS 8000 (1973) from Partec, the first FACS (fluorescence-activated cell sorting) instrument from Becton Dickinson (1974), the ICP 22 (1975) from Partec/Phywe and the Epics from Coulter (1977/78). The first label-free high-frequency impedance flow cytometer based on a patented microfluidic "lab-on-chip", Ampha Z30, was introduced by Amphasys (2012).[ citation needed ]

Name of the technology

The original name of the fluorescence-based flow cytometry technology was "pulse cytophotometry" (German: Impulszytophotometrie), based on the first patent application on fluorescence-based flow cytometry. At the 5th American Engineering Foundation Conference on Automated Cytology in Pensacola (Florida) in 1976 – eight years after the introduction of the first fluorescence-based flow cytometer (1968) – it was agreed to commonly use the name "flow cytometry", a term that quickly became popular. [10]

Flow cytometers

Schematic diagram of a flow cytometer, from sheath focusing to data acquisition. Cytometer.svg
Schematic diagram of a flow cytometer, from sheath focusing to data acquisition.

Modern flow cytometers are able to analyze many thousands of particles per second, in "real time" and, if configured as cell sorters, can actively separate and isolate particles with specified optical properties at similar rates. A flow cytometer is similar to a microscope, except that, instead of producing an image of the cell, flow cytometry offers high-throughput, automated quantification of specified optical parameters on a cell-by-cell basis. To analyze solid tissues, a single-cell suspension must first be prepared.[ citation needed ]

A flow cytometer has five main components: a flow cell, a measuring system, a detector, an amplification system, and a computer for analysis of the signals. The flow cell has a liquid stream (sheath fluid), which carries and aligns the cells so that they pass single file through the light beam for sensing. The measuring system commonly uses measurement of impedance (or conductivity) and optical systems – lamps (mercury, xenon); high-power water-cooled lasers (argon, krypton, dye laser); low-power air-cooled lasers (argon (488 nm), red-HeNe (633 nm), green-HeNe, HeCd (UV)); diode lasers (blue, green, red, violet) resulting in light signals. The detector and analog-to-digital conversion (ADC) system converts analog measurements of forward-scattered light (FSC) and side-scattered light (SSC) as well as dye-specific fluorescence signals into digital signals that can be processed by a computer. The amplification system can be linear or logarithmic.[ citation needed ]

The process of collecting data from samples using the flow cytometer is termed "acquisition". Acquisition is mediated by a computer physically connected to the flow cytometer, and the software which handles the digital interface with the cytometer. The software is capable of adjusting parameters (e.g., voltage, compensation) for the sample being tested, and also assists in displaying initial sample information while acquiring sample data to ensure that parameters are set correctly. Early flow cytometers were, in general, experimental devices, but technological advances have enabled widespread applications for use in a variety of both clinical and research purposes. Due to these developments, a considerable market for instrumentation, analysis software, as well as the reagents used in acquisition such as fluorescently labeled antibodies have been developed.

Modern instruments usually have multiple lasers and fluorescence detectors. The current record for a commercial instrument is ten lasers [11] and 30 fluorescence detectors. [12] Increasing the number of lasers and detectors allows for multiple antibody labeling, and can more precisely identify a target population by their phenotypic markers. Certain instruments can even take digital images of individual cells, allowing for the analysis of fluorescent signal location within or on the surface of cells.[ citation needed ]

Hardware

Fluidics system of a flow cytometer

Cells must pass uniformly through the center of focused laser beams to accurately measure optical properties of cells in any flow cytometer. [13] [14] [15] The purpose of the fluidic system is to move the cells one by one through the lasers beam and throughout the instrument. Fluidics in a flow cytometer with cell sorting capabilities also use the stream to carry sorted cells into collection tubes or wells. [13]

Hydrodynamic focusing

For precise positioning of cells in a liquid jet, hydrodynamic focusing is used in most cytometers. [13] [14] The cells in suspension enter into the instrument enclosed by an outer sheath fluid. The sample core is maintained in the center of the sheath fluid. The sample input rate or how fast the cells flow through to the laser interrogation can be controlled by the pressure of the sheath fluid on the sample core. Under optimal conditions, the central fluid stream and sheath fluid do not mix.[ citation needed ]

Acoustic-assisted hydrodynamic focusing

Acoustic focusing technology is used in some flow cytometers to support hydrodynamic focusing. [13] [15] Acoustic waves (>2 MHz) pre-focus the sample before introduction to sheath fluid. The pre-focused sample is then injected into the hydrodynamic core and flowed through the instrument. This may help with increasing data accuracy under high sample input rates.

Optics and electronics

Optical filters

Light emitted from fluorophores are in a spectrum of wavelengths, so combining multiple fluorophores may cause overlap. To add specificity, optical filters and dichroic mirrors are used to filter and move light to the detectors such as photomultiplier tubes (PMTs) or avalanche photodiodes (APD). [13] Optical filters are designed as band pass (BP), long pass (LP), or short pass (SP) filters. Most flow cytometers uses dichroic mirrors and band pass filters to select specific bands of the optical spectrum.

Prisms, gratings, and spectral flow cytometry

Spectral flow cytometry uses prisms or diffraction gratings to disperse the emitted light of a marker across a detector array. [13] [16] This allows for the full spectra from each particle to be measured. The measured spectra from single cells are subsequently unmixed by using reference spectra of all used dyes and the autofluorescence spectrum. This may allow for a wider panel design and the application of new biological markers.[ citation needed ]

Imaging flow cytometry

Imaging flow cytometry (IFC) captures multichannel images of cells. [13] [17] Detectors used in imaging platforms can be equipped with charge-coupled device (CCD) or complementary metal–oxide–semiconductor (CMOS) to capture images of individual cells.

Data analysis

Compensation

Each fluorochrome has a broad fluorescence spectrum. When more than one fluorochrome is used, the overlap between fluorochromes can occur. This situation is called spectrum overlap. This situation needs to be overcome. For example, the emission spectrum for FITC and PE is that the light emitted by the fluorescein overlaps the same wavelength as it passes through the filter used for PE. This spectral overlap is corrected by removing a portion of the FITC signal from the PE signals or vice versa. This process is called color compensation, which calculates a fluorochrome as a percentage to measure itself. [18]

Compensation is the mathematical process by which spectral overlap of multiparameter flow cytometric data is corrected. Since fluorochromes can have wide-ranging spectrum, they can overlap, causing the undesirable result of confusion during the analysis of data. This overlap, known as spillover and quantified in the spillover coefficient, is usually caused by detectors for a certain fluorochrome measuring a significant peak in wavelength from a different fluorochrome. Linear algebra is most often used to make this correction. [18]

In general, when graphs of one or more parameters are displayed, it is to show that the other parameters do not contribute to the distribution shown. Especially when using the parameters which are more than double, this problem is more severe. Currently, no tools have been discovered to efficiently display multidimensional parameters. Compensation is very important to see the distinction between cells.

Analysis of a marine sample of photosynthetic picoplankton by flow cytometry showing three different populations (Prochlorococcus, Synechococcus, and picoeukaryotes) Picoplancton cytometrie.jpg
Analysis of a marine sample of photosynthetic picoplankton by flow cytometry showing three different populations ( Prochlorococcus , Synechococcus , and picoeukaryotes)

[ citation needed ]

Gating

Flow cytometry gating into main categories of blood cells by side scatter and CD45, in a case with normal distributions. Flow cytometric gating by side scatter and CD45.png
Flow cytometry gating into main categories of blood cells by side scatter and CD45, in a case with normal distributions.

The data generated by flow cytometers can be plotted in a single dimension, to produce a histogram, or in two-dimensional dot plots, or even in three dimensions. The regions on these plots can be sequentially separated, based on fluorescence intensity, by creating a series of subset extractions, termed "gates." Specific gating protocols exist for diagnostic and clinical purposes, especially in relation to hematology. Individual single cells are often distinguished from cell doublets or higher aggregates by their "time-of-flight" (denoted also as a "pulse-width") through the narrowly focused laser beam [19]

The plots are often made on logarithmic scales. Because different fluorescent dyes' emission spectra overlap, [20] [21] signals at the detectors have to be compensated electronically as well as computationally. Data accumulated using the flow cytometer can be analyzed using software. Once the data is collected, there is no need to stay connected to the flow cytometer and analysis is most often performed on a separate computer.[ citation needed ] This is especially necessary in core facilities where usage of these machines is in high demand.[ citation needed ]

Computational analysis

Recent progress on automated population identification using computational methods has offered an alternative to traditional gating strategies. Automated identification systems could potentially help findings of rare and hidden populations. Representative automated methods include FLOCK [22] in Immunology Database and Analysis Portal (ImmPort), [23] SamSPECTRAL [24] and flowClust [25] [26] [27] in Bioconductor, and FLAME [28] in GenePattern. T-Distributed Stochastic Neighbor Embedding (tSNE) is an algorithm designed to perform dimensionality reduction, to allow visualization of complex multi-dimensional data in a two-dimensional "map". [29] Collaborative efforts have resulted in an open project called FlowCAP (Flow Cytometry: Critical Assessment of Population Identification Methods, [30] ) to provide an objective way to compare and evaluate the flow cytometry data clustering methods, and also to establish guidance about appropriate use and application of these methods.

FMO controls

Fluorescence minus one (FMO) controls are important for data interpretation when building multi-color panels – in which a cell is stained with multiple fluorochromes simultaneously. FMO controls provide a measure of fluorescence spillover in a given channel and allow for compensation. To generate a FMO control, a sample is stained with all the fluorochromes except the one that is being tested – meaning if you are using 4 different fluorochromes your FMO control must contain only 3 of them (example: fluorochromes – A, B, C, D; FMOs – ABC_, AB_D, A_CD, _BCD).[ citation needed ]

Cell sorting by flow cytometry

Cell sorting is a method to purify cell populations based on the presence or absence of specific physical characteristics. [13] [15] [31] In flow cytometers with sorting capabilities, the instrument detects cells using parameters including cell size, morphology, and protein expression, and then droplet technology to sort cells and recover the subsets for post-experimental use. [13] [15]

The first prototype sorter was built at the Los Alamos National Laboratory (LANL) in 1965 by physicist Mack J. Fulwyler by joining a Coulter volume sensor with the newly invented ink jet printer. [32] Live cell cell sorter or fluorescence-activated cell sorter (FACS) [lower-alpha 1] was generated by Len Herzenberg, who subsequently won the Kyoto Prize in 2006 for his seminal work. [34]

Cell Sorting Using Flow Cytometry and Droplet Technology Fluorescence Assisted Cell Sorting (FACS) B.jpg
Cell Sorting Using Flow Cytometry and Droplet Technology

Flow cytometry cell sorters have a collection system unlike flow cytometry analyzers. The collection process starts when a sample is injected into a stream of sheath fluid that passes through the flow cell and laser intercepts. [35]  The stream then carries the cell through a vibrating nozzle which generates droplets with most containing either one cell or no cells. An electrical charging ring is placed just at the point where the stream breaks into droplets and a charge is placed on the ring based immediately prior to fluorescence intensity being measured; the opposite charge is trapped on the droplet as it breaks from the stream and the droplets are therefore charged. The charged droplets then fall through an electrostatic deflection system that diverts droplets into containers based on their charge. In some systems, the charge is applied directly to the stream, and the droplet breaking off retains charge of the same sign as the stream. The stream is then returned to neutral after the droplet breaks off. After collecting, these cells can be further cultured, manipulated, and studied.[ citation needed ]

Labels

Use of flow cytometry to measure copy number variation of a specific DNA sequence (Flow-FISH) Flow-FISH 1.JPG
Use of flow cytometry to measure copy number variation of a specific DNA sequence (Flow-FISH)

Flow cytometry uses the light properties scattered from cells or particles for identification or quantitative measurement of physical properties. Labels, dyes, and stains can be used for multi-parametric analysis (understand more properties about a cell). Immunophenotyping is the analysis of heterogeneous populations of cells using labeled antibodies [36] and other fluorophore containing reagents such as dyes and stains.

Fluorescent labels

A wide range of fluorophores can be used as labels in flow cytometry. [20] Fluorophores, or simply "fluors",[ citation needed ] are typically attached to an antibody that recognizes a target feature on or in the cell; they may also be attached to a chemical entity with affinity for the cell membrane or another cellular structure. Each fluorophore has a characteristic peak excitation and emission wavelength, and the emission spectra often overlap. Consequently, the combination of labels which can be used depends on the wavelength of the lamp(s) or laser(s) used to excite the fluorochromes and on the detectors available. [37] The maximum number of distinguishable fluorescent labels is thought to be 17 or 18, and this level of complexity necessitates laborious optimization to limit artifacts, as well as complex deconvolution algorithms to separate overlapping spectra. [38] Flow cytometry uses fluorescence as a quantitative tool; the utmost sensitivity of flow cytometry is unmatched by other fluorescent detection platforms such as confocal microscopy. Absolute fluorescence sensitivity is generally lower in confocal microscopy because out-of-focus signals are rejected by the confocal optical system and because the image is built up serially from individual measurements at every location across the cell, reducing the amount of time available to collect signal. [39]

Quantum dots

Quantum dots are sometimes used in place of traditional fluorophores because of their narrower emission peaks.[ citation needed ]

Isotope labeling

Mass cytometry overcomes the fluorescent labeling limit by utilizing lanthanide isotopes attached to antibodies. This method could theoretically allow the use of 40 to 60 distinguishable labels and has been demonstrated for 30 labels. [38] Mass cytometry is fundamentally different from flow cytometry: cells are introduced into a plasma, ionized, and associated isotopes are quantified via time-of-flight mass spectrometry. Although this method permits the use of a large number of labels, it currently has lower throughput capacity than flow cytometry. It also destroys the analysed cells, precluding their recovery by sorting. [38]

Cytometric bead array

In addition to the ability to label and identify individual cells via fluorescent antibodies, cellular products such as cytokines, proteins, and other factors may be measured as well. Similar to ELISA sandwich assays, cytometric bead array (CBA) assays use multiple bead populations typically differentiated by size and different levels of fluorescence intensity to distinguish multiple analytes in a single assay. The amount of the analyte captured is detected via a biotinylated antibody against a secondary epitope of the protein, followed by a streptavidin-R-phycoerythrin treatment. The fluorescent intensity of R-phycoerythrin on the beads is quantified on a flow cytometer equipped with a 488 nm excitation source. Concentrations of a protein of interest in the samples can be obtained by comparing the fluorescent signals to those of a standard curve generated from a serial dilution of a known concentration of the analyte. Commonly also referred to as cytokine bead array (CBA).

Impedance flow cytometry

Impedance-based single cell analysis systems are commonly known as Coulter counters. They represent a well-established method for counting and sizing virtually any kind of cells and particles. The label-free technology has recently been enhanced by a "lab-on-a-chip" based approach and by applying high frequency alternating current (AC) in the radio frequency range (from 100 kHz to 30 MHz) instead of a static direct current (DC) or low frequency AC field. [40] [41] This patented technology allows a highly accurate cell analysis and provides additional information like membrane capacitance and viability. The relatively small size and robustness allow battery powered on-site use in the field.

Measurable parameters

Measurable factors in cellular analysis and flow cytometry include a diverse set of traits and indicators that provide important insights into cell biology and function. Flow cytometry techniques can quantify and evaluate these factors, allowing researchers to investigate and analyze various aspects of cells. Here are some important quantifiable parameters that are frequently investigated:

Flow cytometry using 7-Aminoactinomycin D (7-AAD), wherein a lower signal indicates viable cells. Therefore, this case shows good viability. Flow cytometric viability by 7-AAD.png
Flow cytometry using 7-Aminoactinomycin D (7-AAD), wherein a lower signal indicates viable cells. Therefore, this case shows good viability.

Applications

The technology has applications in a number of fields, including molecular biology, pathology, immunology, virology, [44] plant biology and marine biology. [45] It has broad application in medicine especially in transplantation, hematology, tumor immunology and chemotherapy, prenatal diagnosis, genetics and sperm sorting for sex preselection. Flow cytometry is widely applied to detect sperm cells abnormality associated with DNA fragmentation [46] in male fertility assays. [47] Also, it is extensively used in research for the detection of DNA damage, [48] [49] caspase cleavage and apoptosis. [50] Photoacoustic flow cytometry is used in the study of multi-drug-resistant bacteria (most commonly MRSA) to detect, differentiate, and quantify bacteria in the blood marked with dyed bacteriophages. [51] In neuroscience, co-expression of cell surface and intracellular antigens can also be analyzed. [52] In microbiology, it can be used to screen and sort transposon mutant libraries constructed with a GFP-encoding transposon (TnMHA), [53] or to assess viability. [54] In protein engineering, flow cytometry is used in conjunction with yeast display and bacterial display to identify cell surface-displayed protein variants with desired properties. The main advantages of flow cytometry over histology and IHC is the possibility to precisely measure the quantities of antigens and the possibility to stain each cell with multiple antibodies-fluorophores, in current laboratories around 10 antibodies can be bound to each cell. This is much less than mass cytometer where up to 40 can be currently measured, but at a higher price and a slower pace.

Aquatic research

In aquatic systems, flow cytometry is used for the analysis of autofluorescing cells or cells that are fluorescently-labeled with added stains. This research started in 1981 when Clarice Yentsch used flow cytometry to measure the fluorescence in a red tide producing dinoflagellate. [55] The next year researchers published flow cytometric measurements of multiple algal species which could be distinguished based on their fluorescence characteristics. [56] By 1983, marine researchers were assembling their own flow cytometers [57] or using commercially available flow cytometers on seawater samples collected off Bermuda to demonstrate that phytoplankton cells could be distinguished from non-living material and that cyanobacteria could be sorted from a mixed community and subsequently cultured in the lab. [58] Flow cytometry also allowed marine researchers to distinguish between dimly-fluorescing Prochlorococcus and heterotrophic microorganisms, a distinction that is difficult with microscopy-based assessments. [59] Advances in technology now allow aquatic scientists to use flow cytometers continuously during research cruises [60] and flow cytometers are used to provide images of individual phytoplankton cells. [61] [62] Marine scientists use the sorting ability of flow cytometers to make discrete measurements of cellular activity and diversity, [63] [64] to conduct investigations into the mutualistic relationships between microorganisms that live in close proximity, [65] and to measure biogeochemical rates of multiple processes in the ocean. [66]

Cell proliferation assay

Cell proliferation is the major function in the immune system. Often it is required to analyse the proliferative nature of the cells in order to make some conclusions. One such assay to determine the cell proliferation is the tracking dye carboxyfluorescein diacetate succinimidyl ester (CFSE). It helps to monitor proliferative cells. This assay gives quantitative as well as qualitative data during time-series experiments. [67] This dye binds covalently with the long-lived molecules present inside the cell. When the cells divide, the molecules divide too and, the daughter cells possess half the dye than the parent population. This decrease in the intensity can be visualized by flow cytometry. [68] In literature, this powerful technique of flow cytometry and CFSE has been used to find the efficiency of T-cells in killing the target cells in cancer such as leukemia. In order to visualize the target cell death, both rapid and slow, scientists have used CFSE labelling with antibody staining of certain kinds of cells and fluorescently labelled microbeads. This also gave information regarding the proliferation of the target cells upon the treatment of certain cytokines. [69]

Measuring genome size

Flow cytometry has been used to measure genome sizes, or more precisely: the amount of DNA in a cell or nucleus. Although genomes can be analyzed with more precision by genome sequencing, this is often difficult due to a high fraction of micro-chromosomes or repetitive sequences which may be missed by sequencing (or which get filtered out during the analysis step when they cannot be assigned to chromosomes). However, flow cytometry is not perfect either. The resulting genome sizes may differ based on the dye used. An analysis of fish genomes resulted in significantly different genome sizes when propidium iodide (PI) and DAPI were used, respectively. For instance, the genome of Anguilla japonica was found to contain 1.09 pg of DNA with PI vs. 1.25 pg with DAPI. Similarly, the genome of Myxocyprinus asiaticus was found to contain 2.75 pg of DNA (PI) vs. 3.08 pg (DAPI). That is, the differences were on the order of 12–14%. [70]

See also

Notes

  1. The acronym FACS is trademarked and owned by BD Biosciences-Immunocytometry Systems, a division of Becton-Dickinson, which licensed Stanford's patents. [31] [33]

Related Research Articles

<span class="mw-page-title-main">Immunostaining</span> Biochemical technique

In biochemistry, immunostaining is any use of an antibody-based method to detect a specific protein in a sample. The term "immunostaining" was originally used to refer to the immunohistochemical staining of tissue sections, as first described by Albert Coons in 1941. However, immunostaining now encompasses a broad range of techniques used in histology, cell biology, and molecular biology that use antibody-based staining methods.

<span class="mw-page-title-main">Immunofluorescence</span> Technique used for light microscopy

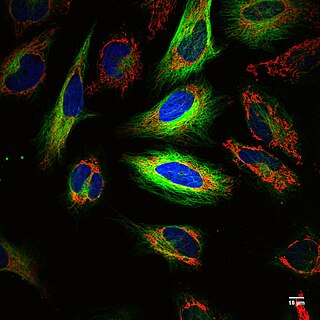
Immunofluorescence(IF) is a light microscopy-based technique that allows detection and localization of a wide variety of target biomolecules within a cell or tissue at a quantitative level. The technique utilizes the binding specificity of antibodies and antigens. The specific region an antibody recognizes on an antigen is called an epitope. Several antibodies can recognize the same epitope but differ in their binding affinity. The antibody with the higher affinity for a specific epitope will surpass antibodies with a lower affinity for the same epitope.

<span class="mw-page-title-main">Fluorescence microscope</span> Optical microscope that uses fluorescence and phosphorescence

A fluorescence microscope is an optical microscope that uses fluorescence instead of, or in addition to, scattering, reflection, and attenuation or absorption, to study the properties of organic or inorganic substances. "Fluorescence microscope" refers to any microscope that uses fluorescence to generate an image, whether it is a simple set up like an epifluorescence microscope or a more complicated design such as a confocal microscope, which uses optical sectioning to get better resolution of the fluorescence image.

<span class="mw-page-title-main">Hoechst stain</span> Fluorescent dye used to stain DNA

Hoechst stains are part of a family of blue fluorescent dyes used to stain DNA. These bis-benzimides were originally developed by Hoechst AG, which numbered all their compounds so that the dye Hoechst 33342 is the 33,342nd compound made by the company. There are three related Hoechst stains: Hoechst 33258, Hoechst 33342, and Hoechst 34580. The dyes Hoechst 33258 and Hoechst 33342 are the ones most commonly used and they have similar excitation–emission spectra.

Fluorescence <i>in situ</i> hybridization Genetic testing technique

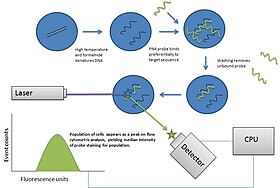
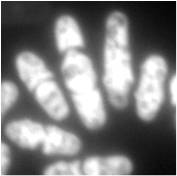
Fluorescence in situ hybridization (FISH) is a molecular cytogenetic technique that uses fluorescent probes that bind to only particular parts of a nucleic acid sequence with a high degree of sequence complementarity. It was developed by biomedical researchers in the early 1980s to detect and localize the presence or absence of specific DNA sequences on chromosomes. Fluorescence microscopy can be used to find out where the fluorescent probe is bound to the chromosomes. FISH is often used for finding specific features in DNA for use in genetic counseling, medicine, and species identification. FISH can also be used to detect and localize specific RNA targets in cells, circulating tumor cells, and tissue samples. In this context, it can help define the spatial-temporal patterns of gene expression within cells and tissues.

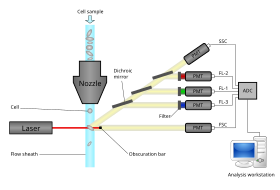
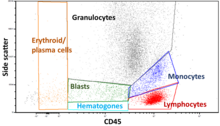
Immunophenotyping is a technique used to study the protein expressed by cells. This technique is commonly used in basic science research and laboratory diagnostic purpose. This can be done on tissue section, cell suspension, etc. An example is the detection of tumor markers, such as in the diagnosis of leukemia. It involves the labelling of white blood cells with antibodies directed against surface proteins on their membrane. By choosing appropriate antibodies, the differentiation of leukemic cells can be accurately determined. The labelled cells are processed in a flow cytometer, a laser-based instrument capable of analyzing thousands of cells per second. The whole procedure can be performed on cells from the blood, bone marrow or spinal fluid in a matter of a few hours.

<span class="mw-page-title-main">TUNEL assay</span> Molecular biology method used to detect DNA fragmentation

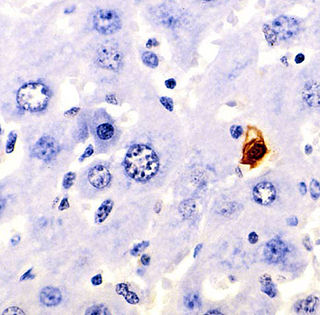
Terminal deoxynucleotidyl transferase dUTP nick end labeling (TUNEL) is a method for detecting DNA fragmentation by labeling the 3′- hydroxyl termini in the double-strand DNA breaks generated during apoptosis.

<span class="mw-page-title-main">Acridine orange</span> Organic dye used in biochemistry

Acridine orange is an organic compound that serves as a nucleic acid-selective fluorescent dye with cationic properties useful for cell cycle determination. Acridine orange is cell-permeable, which allows the dye to interact with DNA by intercalation, or RNA via electrostatic attractions. When bound to DNA, acridine orange is very similar spectrally to an organic compound known as fluorescein. Acridine orange and fluorescein have a maximum excitation at 502nm and 525 nm (green). When acridine orange associates with RNA, the fluorescent dye experiences a maximum excitation shift from 525 nm (green) to 460 nm (blue). The shift in maximum excitation also produces a maximum emission of 650 nm (red). Acridine orange is able to withstand low pH environments, allowing the fluorescent dye to penetrate acidic organelles such as lysosomes and phagolysosomes that are membrane-bound organelles essential for acid hydrolysis or for producing products of phagocytosis of apoptotic cells. Acridine orange is used in epifluorescence microscopy and flow cytometry. The ability to penetrate the cell membranes of acidic organelles and cationic properties of acridine orange allows the dye to differentiate between various types of cells. The shift in maximum excitation and emission wavelengths provides a foundation to predict the wavelength at which the cells will stain.

<span class="mw-page-title-main">7-Aminoactinomycin D</span> Chemical compound

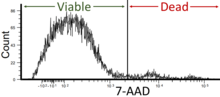
7-Aminoactinomycin D (7-AAD) is a fluorescent chemical compound with a strong affinity for DNA. It is used as a fluorescent marker for DNA in fluorescence microscopy and flow cytometry. It intercalates in double-stranded DNA, with a high affinity for GC-rich regions, making it useful for chromosome banding studies.

Flow-FISH is a cytogenetic technique to quantify the copy number of RNA or specific repetitive elements in genomic DNA of whole cell populations via the combination of flow cytometry with cytogenetic fluorescent in situ hybridization staining protocols.

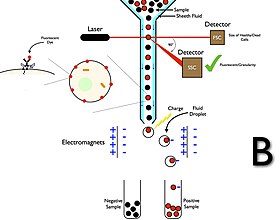
Cell sorting is the process through which a particular cell type is separated from others contained in a sample on the basis of its physical or biological properties, such as size, morphological parameters, viability and both extracellular and intracellular protein expression. The homogeneous cell population obtained after sorting can be used for a variety of applications including research, diagnosis, and therapy.

<span class="mw-page-title-main">Fluorescence in the life sciences</span> Scientific investigative technique

Fluorescence is used in the life sciences generally as a non-destructive way of tracking or analysing biological molecules. Some proteins or small molecules in cells are naturally fluorescent, which is called intrinsic fluorescence or autofluorescence. Alternatively, specific or general proteins, nucleic acids, lipids or small molecules can be "labelled" with an extrinsic fluorophore, a fluorescent dye which can be a small molecule, protein or quantum dot. Several techniques exist to exploit additional properties of fluorophores, such as fluorescence resonance energy transfer, where the energy is passed non-radiatively to a particular neighbouring dye, allowing proximity or protein activation to be detected; another is the change in properties, such as intensity, of certain dyes depending on their environment allowing their use in structural studies.

<span class="mw-page-title-main">Microfluorimetry</span>

Microfluorimetry is an adaption of fluorimetry for studying the biochemical and biophysical properties of cells by using microscopy to image cell components tagged with fluorescent molecules. It is a type of microphotometry that gives a quantitative measure of the qualitative nature of fluorescent measurement and therefore, allows for definitive results that would have been previously indiscernible to the naked eye.

<span class="mw-page-title-main">Cytometry</span> Measurement of number and characteristics of cells

Cytometry is the measurement of number and characteristics of cells. Variables that can be measured by cytometric methods include cell size, cell count, cell morphology, cell cycle phase, DNA content, and the existence or absence of specific proteins on the cell surface or in the cytoplasm. Cytometry is used to characterize and count blood cells in common blood tests such as the complete blood count. In a similar fashion, cytometry is also used in cell biology research and in medical diagnostics to characterize cells in a wide range of applications associated with diseases such as cancer and AIDS.

Cell cycle analysis by DNA content measurement is a method that most frequently employs flow cytometry to distinguish cells in different phases of the cell cycle. Before analysis, the cells are usually permeabilised and treated with a fluorescent dye that stains DNA quantitatively, such as propidium iodide (PI) or 4,6-diamidino-2-phenylindole (DAPI). The fluorescence intensity of the stained cells correlates with the amount of DNA they contain. As the DNA content doubles during the S phase, the DNA content (and thereby intensity of fluorescence) of cells in the G0 phase and G1 phase (before S), in the S phase, and in the G2 phase and M phase (after S) identifies the cell cycle phase position in the major phases (G0/G1 versus S versus G2/M phase) of the cell cycle. The cellular DNA content of individual cells is often plotted as their frequency histogram to provide information about relative frequency (percentage) of cells in the major phases of the cell cycle.

<span class="mw-page-title-main">CyTOF</span>

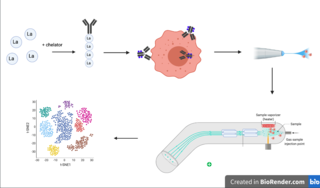
Cytometry by time of flight, or CyTOF, is an application of mass cytometry used to quantify labeled targets on the surface and interior of single cells. CyTOF allows the quantification of multiple cellular components simultaneously using an ICP-MS detector.

<span class="mw-page-title-main">Single-cell analysis</span> Testbg biochemical processes and reactions in an individual cell

In the field of cellular biology, single-cell analysis and subcellular analysis is the study of genomics, transcriptomics, proteomics, metabolomics and cell–cell interactions at the single cell level. The concept of single-cell analysis originated in the 1970s. Before the discovery of heterogeneity, single-cell analysis mainly referred to the analysis or manipulation of an individual cell in a bulk population of cells at a particular condition using optical or electronic microscope. To date, due to the heterogeneity seen in both eukaryotic and prokaryotic cell populations, analyzing a single cell makes it possible to discover mechanisms not seen when studying a bulk population of cells. Technologies such as fluorescence-activated cell sorting (FACS) allow the precise isolation of selected single cells from complex samples, while high throughput single cell partitioning technologies, enable the simultaneous molecular analysis of hundreds or thousands of single unsorted cells; this is particularly useful for the analysis of transcriptome variation in genotypically identical cells, allowing the definition of otherwise undetectable cell subtypes. The development of new technologies is increasing our ability to analyze the genome and transcriptome of single cells, as well as to quantify their proteome and metabolome. Mass spectrometry techniques have become important analytical tools for proteomic and metabolomic analysis of single cells. Recent advances have enabled quantifying thousands of protein across hundreds of single cells, and thus make possible new types of analysis. In situ sequencing and fluorescence in situ hybridization (FISH) do not require that cells be isolated and are increasingly being used for analysis of tissues.

Flow cytometry bioinformatics is the application of bioinformatics to flow cytometry data, which involves storing, retrieving, organizing and analyzing flow cytometry data using extensive computational resources and tools. Flow cytometry bioinformatics requires extensive use of and contributes to the development of techniques from computational statistics and machine learning. Flow cytometry and related methods allow the quantification of multiple independent biomarkers on large numbers of single cells. The rapid growth in the multidimensionality and throughput of flow cytometry data, particularly in the 2000s, has led to the creation of a variety of computational analysis methods, data standards, and public databases for the sharing of results.

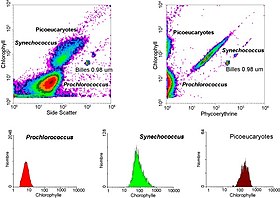
Bacterioplankton counting is the estimation of the abundance of bacterioplankton in a specific body of water, which is useful information to marine microbiologists. Various counting methodologies have been developed over the years to determine the number present in the water being observed. Methods used for counting bacterioplankton include epifluorescence microscopy, flow cytometry, measures of productivity through frequency of dividing cells (FDC), thymidine incorporation, and leucine incorporation.

<span class="mw-page-title-main">Fluorescence imaging</span> Type of non-invasive imaging technique

Fluorescence imaging is a type of non-invasive imaging technique that can help visualize biological processes taking place in a living organism. Images can be produced from a variety of methods including: microscopy, imaging probes, and spectroscopy.

References

  1. Picot J, Guerin CL, Le Van Kim C, Boulanger CM (March 2012). "Flow cytometry: retrospective, fundamentals and recent instrumentation". Cytotechnology. 64 (2): 109–30. doi:10.1007/s10616-011-9415-0. PMC   3279584 . PMID   22271369.
  2. "flow cytometry". TheFreeDictionary.com. Retrieved 2018-09-18.
  3. Shapiro HM (2003). Practical flow cytometry (4th ed.). New York: Wiley-Liss. ISBN   978-0-471-41125-3.
  4. Givan AL (2011). "Flow Cytometry: An Introduction". In Hawley T, Hawley R (eds.). Flow Cytometry Protocols. Methods in Molecular Biology. Vol. 699. Humana Press. pp. 1–29. doi:10.1007/978-1-61737-950-5_1. ISBN   978-1-61737-949-9. PMID   21116976.
  5. O'Neill K, Aghaeepour N, Spidlen J, Brinkman R (December 2013). "Flow cytometry bioinformatics". PLOS Comput Biol. 9 (12): e1003365. Bibcode:2013PLSCB...9E3365O. doi: 10.1371/journal.pcbi.1003365 . PMC   3867282 . PMID   24363631.
  6. US 3380584,Mack Fulwyler,"Particle Separator",issued 1965-06-01
  7. Fulwyler MJ (November 1965). "Electronic separation of biological cells by volume". Science. 150 (3698): 910–1. Bibcode:1965Sci...150..910F. doi:10.1126/science.150.3698.910. PMID   5891056. S2CID   459342.
  8. DE 1815352,Dittrich W, Göhde W,"Flow-through Chamber for Photometers to Measure and Count Particles in a Dispersion Medium",published 1977-12-21
  9. Osborn RA (1970). "Cytology Automation". In Evans DM (ed.). Proceedings of Second Tenovus Symposium. 24–25 October 1968. Edinburgh and London: E. & S. Livingstone (published 1971). doi:10.1016/S0031-3025(16)39506-X. S2CID   58286041.
    Kamentsky LA (1973). "Cytology automation". Advances in Biological and Medical Physics. 14: 93–161. doi:10.1016/B978-0-12-005214-1.50007-8. ISBN   9780120052141. PMID   4579761.
  10. Sack U, Tárnok A, Rothe G (2006). Zelluläre Diagnostik[Cellular Diagnostics] (in German). Karger Publishers. ISBN   978-3-318-01217-0.
  11. "Resources & Equipment". Centenary Institute.
  12. "BD Biosciences – Special Order Products".
  13. 1 2 3 4 5 6 7 8 9 Cossarizza A, Chang HD, Radbruch A, Akdis M, Andrä I, Annunziato F, et al. (October 2017). "Guidelines for the use of flow cytometry and cell sorting in immunological studies". European Journal of Immunology. 47 (10): 1584–1797. doi: 10.1002/eji.201646632 . PMC   9165548 . PMID   29023707. S2CID   25591889.
  14. 1 2 "Fluidics System - Flow Cytometry Guide". Bio-Rad. Retrieved 2018-09-18.
  15. 1 2 3 4 "How a Flow Cytometer Works". Thermo Fisher Scientific. Retrieved 2018-09-18.
  16. Nolan JP, Condello D (January 2013). "Spectral flow cytometry". Current Protocols in Cytometry. Chapter 1 (1): 1.27.1–1.27.13. doi:10.1002/0471142956.cy0127s63. ISBN   978-0471142959. PMC   3556726 . PMID   23292705.
  17. Han Y, Gu Y, Zhang AC, Lo YH (November 2016). "Review: imaging technologies for flow cytometry". Lab on a Chip. 16 (24): 4639–4647. doi:10.1039/c6lc01063f. PMC   5311077 . PMID   27830849.
  18. 1 2 Roederer M (November 2001). "Spectral compensation for flow cytometry: visualization artifacts, limitations, and caveats". Cytometry. 45 (3): 194–205. doi: 10.1002/1097-0320(20011101)45:3<194::aid-cyto1163>3.0.co;2-c . PMID   11746088.
  19. Sharpless T, Traganos F, Darzynkiewicz Z, Melamed MR (1975). "Flow cytofluorimetry: discrimination between single cells and cell aggregates by direct size measurements". Acta Cytologica. 19 (6): 577–81. PMID   1108568.
  20. 1 2 "Fluorochrome Table (Tools)". Flow Cytometry Network.
  21. "Table of Fluorochromes". Archived from the original on October 20, 2014.
  22. Qian Y, Wei C, Eun-Hyung Lee F, Campbell J, Halliley J, Lee JA, et al. (2010). "Elucidation of seventeen human peripheral blood B-cell subsets and quantification of the tetanus response using a density-based method for the automated identification of cell populations in multidimensional flow cytometry data". Cytometry Part B. 78 (Suppl 1): S69-82. doi:10.1002/cyto.b.20554. PMC   3084630 . PMID   20839340.
  23. "Immunology Database and Analysis Portal". Archived from the original on July 26, 2011. Retrieved 2009-09-03.
  24. Zare H, Shooshtari P, Gupta A, Brinkman RR (July 2010). "Data reduction for spectral clustering to analyze high throughput flow cytometry data". BMC Bioinformatics. 11: 403. doi: 10.1186/1471-2105-11-403 . PMC   2923634 . PMID   20667133.
  25. "flowClust" . Retrieved 2009-09-03.
  26. Lo K, Brinkman RR, Gottardo R (April 2008). "Automated gating of flow cytometry data via robust model-based clustering". Cytometry Part A. 73 (4): 321–32. doi: 10.1002/cyto.a.20531 . PMID   18307272.
  27. Lo K, Hahne F, Brinkman RR, Gottardo R (May 2009). "flowClust: a Bioconductor package for automated gating of flow cytometry data". BMC Bioinformatics. 10: 145. doi: 10.1186/1471-2105-10-145 . PMC   2701419 . PMID   19442304.
  28. "FLow analysis with Automated Multivariate Estimation (FLAME)". Archived from the original on August 21, 2009. Retrieved 2009-09-03.
  29. Wattenberg M, Viégas F, Johnson I (Oct 13, 2016). "How to Use t-SNE Effectively". Distill. 1 (10). doi: 10.23915/distill.00002 .
  30. "FlowCAP – Flow Cytometry: Critical Assessment of Population Identification Methods" . Retrieved 2009-09-03.
  31. 1 2 Perkel J (July 19, 2004). "Fluorescence-Activated Cell Sorter". The Scientist. Retrieved 2018-09-18.
  32. "Record Unit 9554, The History of the Cell Sorter Interviews". Smithsonian Institution Archives. Fulwyler, Mack Jett. interviewee, Herzenberg, Leonard A. interviewee, Bach, Bruce Allen. interviewee, Krasnow, Mark A. interviewee, Mhatre, Nagesh S. interviewee. 1991. Retrieved 2018-09-18.{{cite web}}: CS1 maint: others (link)
  33. Bushnell T (2016-05-04). "12 Flow Cytometry Terms And Definitions Most Scientists Get Wrong". Expert Cytometry. Retrieved 2018-09-18.
  34. Julius MH, Masuda T, Herzenberg LA (July 1972). "Demonstration that antigen-binding cells are precursors of antibody-producing cells after purification with a fluorescence-activated cell sorter". Proceedings of the National Academy of Sciences of the United States of America. 69 (7): 1934–8. Bibcode:1972PNAS...69.1934J. doi: 10.1073/pnas.69.7.1934 . PMC   426835 . PMID   4114858.
  35. "Cell Sorting – Faculty of Medicine Flow Cytometry Facility". flowcytometry.utoronto.ca. Retrieved 2018-09-18.
  36. "Conjugation of monoclonal antibodies". www.drmr.com. Retrieved 2018-09-18.
  37. Loken MR (1990). Immunofluorescence Techniques in Flow Cytometry and Sorting (2nd ed.). Wiley. pp. 341–53.
  38. 1 2 3 Ornatsky O, Bandura D, Baranov V, Nitz M, Winnik MA, Tanner S (September 2010). "Highly multiparametric analysis by mass cytometry". Journal of Immunological Methods. 361 (1–2): 1–20. doi:10.1016/j.jim.2010.07.002. PMID   20655312.
  39. Basiji DA, Ortyn WE, Liang L, Venkatachalam V, Morrissey P (September 2007). "Cellular image analysis and imaging by flow cytometry". Clinics in Laboratory Medicine. 27 (3): 653–70, viii. doi:10.1016/j.cll.2007.05.008. PMC   2034394 . PMID   17658411.
  40. Sun T, Morgan H (April 2010). "Single-cell microfluidic impedance cytometry: a review". Microfluidics and Nanofluidics. 8 (4): 423–443. doi:10.1007/s10404-010-0580-9. S2CID   95631023.
  41. Cheung KC, Di Berardino M, Schade-Kampmann G, Hebeisen M, Pierzchalski A, Bocsi J, et al. (July 2010). "Microfluidic impedance-based flow cytometry". Cytometry Part A. 77 (7): 648–66. doi: 10.1002/cyto.a.20910 . PMID   20583276.
  42. "Flow cytometry (FACS) staining protocol (Cell surface staining)". Yale School of Medicine – Yale Flow Cytometry. Retrieved 2023-10-17.
  43. "Flow Cytometry – Types, Purpose, Reagents, Examples, Application". microbiologynote.com. 2022-10-18. Retrieved 2023-06-27.
  44. Zamora JL, Aguilar HC (February 2018). "Flow virometry as a tool to study viruses". Methods. 134–135: 87–97. doi:10.1016/j.ymeth.2017.12.011. PMC   5815898 . PMID   29258922.
  45. Murphy RW, Lowcock LA, Smith C, Darevsky IS, Orlov N, MacCulloch RD, Upton DE (1997). "Flow cytometry in biodiversity surveys: methods, utility and constraints". Amphibia-Reptilia. 18: 1–13. doi:10.1163/156853897x00260.
  46. Gorczyca W, Traganos F, Jesionowska H, Darzynkiewicz Z (July 1993). "Presence of DNA strand breaks and increased sensitivity of DNA in situ to denaturation in abnormal human sperm cells: analogy to apoptosis of somatic cells". Experimental Cell Research. 207 (1): 202–5. doi:10.1006/excr.1993.1182. PMID   8391465.
  47. Evenson DP (September 2017). "Evaluation of sperm chromatin structure and DNA strand breaks is an important part of clinical male fertility assessment". Translational Andrology and Urology. 6 (Suppl 4): S495–S500. doi: 10.21037/tau.2017.07.20 . PMC   5643675 . PMID   29082168.
  48. Tanaka T, Halicka HD, Huang X, Traganos F, Darzynkiewicz Z (September 2006). "Constitutive histone H2AX phosphorylation and ATM activation, the reporters of DNA damage by endogenous oxidants". Cell Cycle. 5 (17): 1940–5. doi:10.4161/cc.5.17.3191. PMC   3488278 . PMID   16940754.
  49. MacPhail SH, Banáth JP, Yu Y, Chu E, Olive PL (June 2003). "Cell cycle-dependent expression of phosphorylated histone H2AX: reduced expression in unirradiated but not X-irradiated G1-phase cells". Radiation Research. 159 (6): 759–67. Bibcode:2003RadR..159..759M. doi:10.1667/rr3003. PMID   12751958. S2CID   26093456.
  50. Darzynkiewicz Z, Juan G, Li X, Gorczyca W, Murakami T, Traganos F (January 1997). "Cytometry in cell necrobiology: analysis of apoptosis and accidental cell death (necrosis)". Cytometry. 27 (1): 1–20. doi: 10.1002/(SICI)1097-0320(19970101)27:1<1::AID-CYTO2>3.0.CO;2-L . PMID   9000580.
  51. Edgar RH, Noel C, Minard A, Fernandez R, Fitzpatrick M, Sajewski A, et al. (2019-02-27). "Identification of MRSA infection in blood using photoacoustic flow cytometry". In Wang L, Oraevsky AA (eds.). Photons Plus Ultrasound: Imaging and Sensing 2019. Vol. 10878. International Society for Optics and Photonics. p. 1087860. Bibcode:2019SPIE10878E..60E. doi:10.1117/12.2510210. ISBN   9781510623989. S2CID   86428267.
  52. Menon V, Thomas R, Ghale AR, Reinhard C, Pruszak J (December 2014). "Flow cytometry protocols for surface and intracellular antigen analyses of neural cell types". Journal of Visualized Experiments (94): e52241. doi:10.3791/52241. PMC   4396953 . PMID   25549236.
  53. Antypas H, Veses-Garcia M, Weibull E, Andersson-Svahn H, Richter-Dahlfors A (June 2018). "A universal platform for selection and high-resolution phenotypic screening of bacterial mutants using the nanowell slide". Lab on a Chip. 18 (12): 1767–1777. doi:10.1039/c8lc00190a. PMC   5996734 . PMID   29781496.
  54. Davey HM (August 2011). "Life, death, and in-between: meanings and methods in microbiology". Applied and Environmental Microbiology. 77 (16): 5571–6. Bibcode:2011ApEnM..77.5571D. doi:10.1128/AEM.00744-11. PMC   3165249 . PMID   21705550.
  55. Yentsch CM (1981). "Flow cytometric analysis of cellular saxitoxin in the dinoflagellate Gonyaulax tamarensis var. excavata". Toxicon. 19 (5): 611–21. doi:10.1016/0041-0101(81)90099-4. PMID   7197816.
  56. Trask, B. J.; Engh, G. J. van den; Elgershuizen, J. H. B. W. (1982). "Analysis of phytoplankton by flow cytometry". Cytometry. 2 (4): 258–264. doi: 10.1002/cyto.990020410 . ISSN   1097-0320. PMID   6799265.
  57. Olson, Robert J.; Frankel, Sheila L.; Chisholm, Sallie W.; Shapiro, Howard M. (1983-04-08). "An inexpensive flow cytometer for the analysis of fluorescence signals in phytoplankton: Chlorophyll and DNA distributions". Journal of Experimental Marine Biology and Ecology. 68 (2): 129–144. doi:10.1016/0022-0981(83)90155-7. ISSN   0022-0981.
  58. Yentsch CM, Horan PK, Muirhead K, Dortch Q, Haugen E, Legendre L, et al. (1983). "Flow cytometry and cell sorting: A technique for analysis and sorting of aquatic particles1". Limnology and Oceanography. 28 (6): 1275–1280. Bibcode:1983LimOc..28.1275Y. doi: 10.4319/lo.1983.28.6.1275 . ISSN   1939-5590.
  59. Chisholm SW, Olson RJ, Zettler ER, Goericke R, Waterbury JB, Welschmeyer NA (July 1988). "A novel free-living prochlorophyte abundant in the oceanic euphotic zone". Nature. 334 (6180): 340–343. Bibcode:1988Natur.334..340C. doi:10.1038/334340a0. S2CID   4373102.
  60. Swalwell JE, Ribalet F, Armbrust EV (2011). "SeaFlow: A novel underway flow-cytometer for continuous observations of phytoplankton in the ocean". Limnology and Oceanography: Methods. 9 (10): 466–477. Bibcode:2011LimOM...9..466S. doi: 10.4319/lom.2011.9.466 . ISSN   1541-5856.
  61. Olson RJ, Sosik HM (2007). "A submersible imaging-in-flow instrument to analyze nano-and microplankton: Imaging FlowCytobot". Limnology and Oceanography: Methods. 5 (6): 195–203. Bibcode:2007LimOM...5..195O. doi: 10.4319/lom.2007.5.195 .
  62. Jakobsen HH, Carstensen J (2011). "FlowCAM: Sizing cells and understanding the impact of size distributions on biovolume of planktonic community structure". Aquatic Microbial Ecology. 65 (1): 75–87. doi: 10.3354/ame01539 . ISSN   0948-3055.
  63. Longnecker K, Sherr BF, Sherr EB (December 2005). "Activity and phylogenetic diversity of bacterial cells with high and low nucleic acid content and electron transport system activity in an upwelling ecosystem". Applied and Environmental Microbiology. 71 (12): 7737–49. Bibcode:2005ApEnM..71.7737L. doi:10.1128/AEM.71.12.7737-7749.2005. PMC   1317353 . PMID   16332746.
  64. Stepanauskas R, Sieracki ME (May 2007). "Matching phylogeny and metabolism in the uncultured marine bacteria, one cell at a time". Proceedings of the National Academy of Sciences of the United States of America. 104 (21): 9052–7. Bibcode:2007PNAS..104.9052S. doi: 10.1073/pnas.0700496104 . PMC   1885626 . PMID   17502618.
  65. Thompson AW, Foster RA, Krupke A, Carter BJ, Musat N, Vaulot D, et al. (September 2012). "Unicellular cyanobacterium symbiotic with a single-celled eukaryotic alga". Science. 337 (6101): 1546–50. Bibcode:2012Sci...337.1546T. doi:10.1126/science.1222700. PMID   22997339. S2CID   7071725.
  66. Lomas, Michael W.; Bronk, Deborah A.; van den Engh, Ger (2011-01-15). "Use of Flow Cytometry to Measure Biogeochemical Rates and Processes in the Ocean". Annual Review of Marine Science. 3 (1): 537–566. Bibcode:2011ARMS....3..537L. doi:10.1146/annurev-marine-120709-142834. ISSN   1941-1405. PMID   21329216.
  67. Hawkins ED, Hommel M, Turner ML, Battye FL, Markham JF, Hodgkin PD (2007). "Measuring lymphocyte proliferation, survival and differentiation using CFSE time-series data". Nature Protocols. 2 (9): 2057–67. doi:10.1038/nprot.2007.297. PMID   17853861. S2CID   13550456.
  68. Quah BJ, Parish CR (October 2010). "The use of carboxyfluorescein diacetate succinimidyl ester (CFSE) to monitor lymphocyte proliferation". Journal of Visualized Experiments (44). doi:10.3791/2259. PMC   3185625 . PMID   20972413.
  69. Jedema I, van der Werff NM, Barge RM, Willemze R, Falkenburg JH (April 2004). "New CFSE-based assay to determine susceptibility to lysis by cytotoxic T cells of leukemic precursor cells within a heterogeneous target cell population". Blood. 103 (7): 2677–82. doi: 10.1182/blood-2003-06-2070 . PMID   14630824. S2CID   1984056.
  70. Zhu, Dongmei; Song, Wen; Yang, Kun; Cao, Xiaojuan; Gul, Yasmeen; Wang, Weiming (2012). "Flow cytometric determination of genome size for eight commercially important fish species in China". In Vitro Cellular & Developmental Biology. Animal. 48 (8): 507–517. doi:10.1007/s11626-012-9543-7. ISSN   1071-2690. JSTOR   23279365. PMID   22956044. S2CID   255351169.

Further reading