Cell biology is a branch of biology that studies the structure, function, and behavior of cells. All living organisms are made of cells. A cell is the basic unit of life that is responsible for the living and functioning of organisms. Cell biology is the study of the structural and functional units of cells. Cell biology encompasses both prokaryotic and eukaryotic cells and has many subtopics which may include the study of cell metabolism, cell communication, cell cycle, biochemistry, and cell composition. The study of cells is performed using several microscopy techniques, cell culture, and cell fractionation. These have allowed for and are currently being used for discoveries and research pertaining to how cells function, ultimately giving insight into understanding larger organisms. Knowing the components of cells and how cells work is fundamental to all biological sciences while also being essential for research in biomedical fields such as cancer, and other diseases. Research in cell biology is interconnected to other fields such as genetics, molecular genetics, molecular biology, medical microbiology, immunology, and cytochemistry.

The cell cycle, or cell-division cycle, is the series of events that take place in a cell that causes it to divide into two daughter cells. These events include the duplication of its DNA and some of its organelles, and subsequently the partitioning of its cytoplasm, chromosomes and other components into two daughter cells in a process called cell division.
Interphase is the portion of the cell cycle that is not accompanied by visible changes under the microscope, and includes the G1, S and G2 phases. During interphase, the cell grows (G1), replicates its DNA (S) and prepares for mitosis (G2). A cell in interphase is not simply quiescent. The term quiescent would be misleading since a cell in interphase is very busy synthesizing proteins, copying DNA into RNA, engulfing extracellular material, processing signals, to name just a few activities. The cell is quiescent only in the sense of cell division. Interphase is the phase of the cell cycle in which a typical cell spends most of its life. Interphase is the 'daily living' or metabolic phase of the cell, in which the cell obtains nutrients and metabolizes them, grows, replicates its DNA in preparation for mitosis, and conducts other "normal" cell functions.
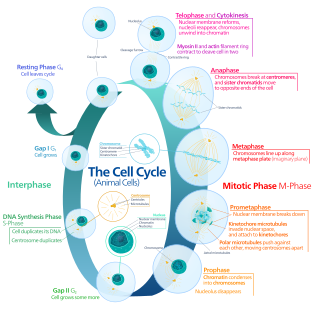
The G1 phase, gap 1 phase, or growth 1 phase, is the first of four phases of the cell cycle that takes place in eukaryotic cell division. In this part of interphase, the cell synthesizes mRNA and proteins in preparation for subsequent steps leading to mitosis. G1 phase ends when the cell moves into the S phase of interphase. Around 30 to 40 percent of cell cycle time is spent in the G1 phase.

Flow cytometry (FC) is a technique used to detect and measure physical and chemical characteristics of a population of cells or particles.
The G0 phase describes a cellular state outside of the replicative cell cycle. Classically, cells were thought to enter G0 primarily due to environmental factors, like nutrient deprivation, that limited the resources necessary for proliferation. Thus it was thought of as a resting phase. G0 is now known to take different forms and occur for multiple reasons. For example, most adult neuronal cells, among the most metabolically active cells in the body, are fully differentiated and reside in a terminal G0 phase. Neurons reside in this state, not because of stochastic or limited nutrient supply, but as a part of their developmental program.
Cyclin is a family of proteins that controls the progression of a cell through the cell cycle by activating cyclin-dependent kinase (CDK) enzymes or group of enzymes required for synthesis of cell cycle.

Hoechst stains are part of a family of blue fluorescent dyes used to stain DNA. These bis-benzimides were originally developed by Hoechst AG, which numbered all their compounds so that the dye Hoechst 33342 is the 33,342nd compound made by the company. There are three related Hoechst stains: Hoechst 33258, Hoechst 33342, and Hoechst 34580. The dyes Hoechst 33258 and Hoechst 33342 are the ones most commonly used and they have similar excitation–emission spectra.

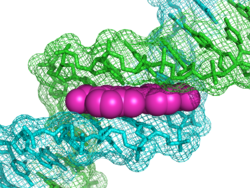
Propidium iodide is a fluorescent intercalating agent that can be used to stain cells and nucleic acids. PI binds to DNA by intercalating between the bases with little or no sequence preference. When in an aqueous solution, PI has a fluorescent excitation maximum of 493 nm (blue-green), and an emission maximum of 636 nm (red). After binding DNA, the quantum yield of PI is enhanced 20-30 fold, and the excitation/emission maximum of PI is shifted to 535 nm (green) / 617 nm (orange-red). Propidium iodide is used as a DNA stain in flow cytometry to evaluate cell viability or DNA content in cell cycle analysis, or in microscopy to visualize the nucleus and other DNA-containing organelles. Propidium Iodide is not membrane-permeable, making it useful to differentiate necrotic, apoptotic and healthy cells based on membrane integrity. PI also binds to RNA, necessitating treatment with nucleases to distinguish between RNA and DNA staining. PI is widely used in fluorescence staining and visualization of the plant cell wall.
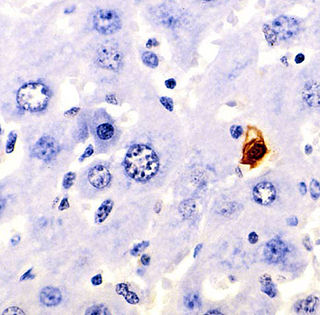
Terminal deoxynucleotidyl transferase dUTP nick end labeling (TUNEL) is a method for detecting DNA fragmentation by labeling the 3′- hydroxyl termini in the double-strand DNA breaks generated during apoptosis.
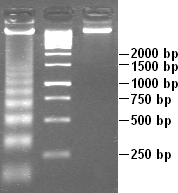
DNA laddering is a feature that can be observed when DNA fragments, resulting from Apoptosis DNA fragmentation are visualized after separation by gel electrophoresis the first described in 1980 by Andrew Wyllie at the University Edinburgh medical school DNA fragments can also be delected in cells that underwent necrosis, when theses DNA fragments after separation are subjected to gel electrophoresis which in the results in a characteristic ladder pattern,

Acridine orange is an organic compound that serves as a nucleic acid-selective fluorescent dye with cationic properties useful for cell cycle determination. Acridine orange is cell-permeable, which allows the dye to interact with DNA by intercalation, or RNA via electrostatic attractions. When bound to DNA, acridine orange is very similar spectrally to an organic compound known as fluorescein. Acridine orange and fluorescein have a maximum excitation at 502nm and 525 nm (green). When acridine orange associates with RNA, the fluorescent dye experiences a maximum excitation shift from 525 nm (green) to 460 nm (blue). The shift in maximum excitation also produces a maximum emission of 650 nm (red). Acridine orange is able to withstand low pH environments, allowing the fluorescent dye to penetrate acidic organelles such as lysosomes and phagolysosomes that are membrane-bound organelles essential for acid hydrolysis or for producing products of phagocytosis of apoptotic cells. Acridine orange is used in epifluorescence microscopy and flow cytometry. The ability to penetrate the cell membranes of acidic organelles and cationic properties of acridine orange allows the dye to differentiate between various types of cells. The shift in maximum excitation and emission wavelengths provides a foundation to predict the wavelength at which the cells will stain.
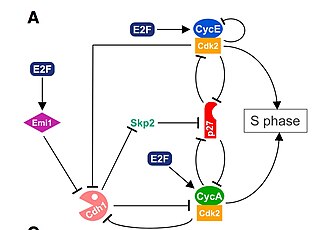
The G1/S transition is a stage in the cell cycle at the boundary between the G1 phase, in which the cell grows, and the S phase, during which DNA is replicated. It is governed by cell cycle checkpoints to ensure cell cycle integrity and the subsequent S phase can pause in response to improperly or partially replicated DNA. During this transition the cell makes decisions to become quiescent, differentiate, make DNA repairs, or proliferate based on environmental cues and molecular signaling inputs. The G1/S transition occurs late in G1 and the absence or improper application of this highly regulated checkpoint can lead to cellular transformation and disease states such as cancer.

Antigen Kiel 67, also known as Ki-67 or MKI67, is a protein that in humans is encoded by the MKI67 gene.
Cell synchronization is a process by which cells in a culture at different stages of the cell cycle are brought to the same phase. Cell synchrony is a vital process in the study of cells progressing through the cell cycle as it allows population-wide data to be collected rather than relying solely on single-cell experiments. The types of synchronization are broadly categorized into two groups; physical fractionization and chemical blockade.
Apoptotic DNA fragmentation is a key feature of apoptosis, a type of programmed cell death. Apoptosis is characterized by the activation of endogenous endonucleases, particularly the caspase-3 activated DNase (CAD), with subsequent cleavage of nuclear DNA into internucleosomal fragments of roughly 180 base pairs (bp) and multiples thereof (360, 540 etc.). The apoptotic DNA fragmentation is being used as a marker of apoptosis and for identification of apoptotic cells either via the DNA laddering assay, the TUNEL assay, or the by detection of cells with fractional DNA content ("sub G1 cells") on DNA content frequency histograms e.g. as in the Nicoletti assay.

A viability assay is an assay that is created to determine the ability of organs, cells or tissues to maintain or recover a state of survival. Viability can be distinguished from the all-or-nothing states of life and death by the use of a quantifiable index that ranges between the integers of 0 and 1 or, if more easily understood, the range of 0% and 100%. Viability can be observed through the physical properties of cells, tissues, and organs. Some of these include mechanical activity, motility, such as with spermatozoa and granulocytes, the contraction of muscle tissue or cells, mitotic activity in cellular functions, and more. Viability assays provide a more precise basis for measurement of an organism's level of vitality.
Alzheimer's disease (AD) is a neurodegenerative condition characterized by two hallmarks: senile plaques and the neurofibrillary tangle. Senile plaques are extracellular aggregations of amyloid-b (Aβ) protein. Neurofibrillary tangles are collections of hyperphosphorylated tau protein associated with microtubules found within neurons. Senile plaques and neurofibrillary tangles are widespread throughout brain tissue and mirror other pathological changes associated with AD.

Zbigniew (Zbyszek) Darzynkiewicz was a Polish-American cell biologist active in cancer research and in developing new methods in histochemistry for flow cytometry.
Induced cell cycle arrest is the use of a chemical or genetic manipulation to artificially halt progression through the cell cycle. Cellular processes like genome duplication and cell division stop. It can be temporary or permanent. It is an artificial activation of naturally occurring cell cycle checkpoints, induced by exogenous stimuli controlled by an experimenter.
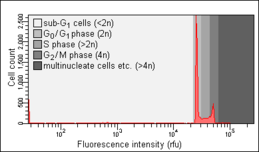 Healthy cells. Note the absence of a sub-G0/G1 peak.
 Apoptotic cells one day after apoptosis induction. Note the presence of a sub-G0/G1 peak.
 Apoptotic cells several days after apoptosis induction. Note the relative increase of the sub-G0/G1 peak.