Related Research Articles
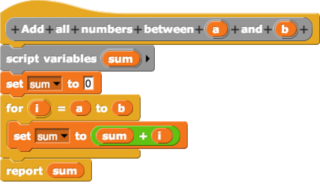
In computing, a visual programming language or block coding is a programming language that lets users create programs by manipulating program elements graphically rather than by specifying them textually. A VPL allows programming with visual expressions, spatial arrangements of text and graphic symbols, used either as elements of syntax or secondary notation. For example, many VPLs are based on the idea of "boxes and arrows", where boxes or other screen objects are treated as entities, connected by arrows, lines or arcs which represent relations.
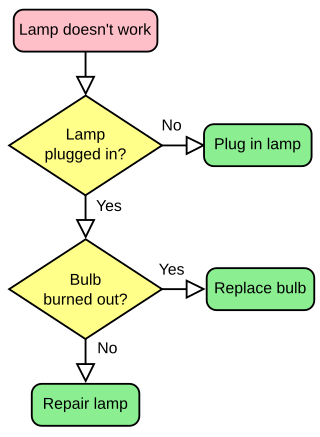
A flowchart is a type of diagram that represents a workflow or process. A flowchart can also be defined as a diagrammatic representation of an algorithm, a step-by-step approach to solving a task.

Microsoft Visio is a diagramming and vector graphics application and is part of the Microsoft 365 family. The product was first introduced in 1992 by former American software company Visio Corporation, and its latest version is Visio 2021. Microsoft acquired the assets of Visio Corporation in 2000 and thus also inherited the licensing agreements for the Visio application. A lightweight version of Visio is now included with all commercial SKU of Microsoft 365 and is known as Visio in Microsoft 365. It has two other subscription based SKUs. Visio Plan 1 includes the Visio web app whereas Visio Plan 2 provides access to both the web app as well as the Desktop application.
OmniGraffle is a diagramming and digital illustration application for macOS and iOS created by The Omni Group.

Infographics are graphic visual representations of information, data, or knowledge intended to present information quickly and clearly. They can improve cognition by using graphics to enhance the human visual system's ability to see patterns and trends. Similar pursuits are information visualization, data visualization, statistical graphics, information design, or information architecture. Infographics have evolved in recent years to be for mass communication, and thus are designed with fewer assumptions about the readers' knowledge base than other types of visualizations. Isotypes are an early example of infographics conveying information quickly and easily to the masses.
diagrams.net is a cross-platform graph drawing software developed in HTML5 and JavaScript. Its interface can be used to create diagrams such as flowcharts, wireframes, UML diagrams, organizational charts, and network diagrams. Parts of its source code are provided under the Apache 2 open-source license.

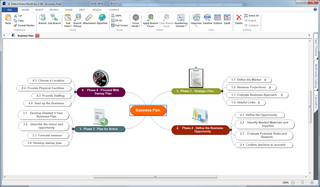
MindManager is a commercial mind mapping software application developed by Mindjet. The software provides ways for users to visualize information in mind maps and flowcharts. MindManager can be used to manage projects, organize information, and for brainstorming.

DRAKON is a free and open source algorithmic visual programming and modeling language developed as part of the defunct Soviet Union Buran space program in 1986 following the need in increase of software development productivity. The visual language provides a uniform way to represent processes in flowcharts.

Xmind is a mind mapping and brainstorming software, It is developed by Shenzhen Aisi Software Technology Co.Ltd, a company registered in People's Republic of China, and first released in 2007. The application can be used to visualize ideas, clarify thoughts, manage complex information, and promote team collaboration. People use Xmind to improve their productivity and creativity while working or learning. As of April 2013, Xmind was selected as the most popular mind mapping software on Lifehacker.

Mindomo is a versatile freemium collaborative mind mapping, concept mapping and outlining tool developed by Expert Software Applications. It can be used to develop ideas and interactively brainstorm, with features including sharing, collaboration, task management, presentation and interactive web publication.
Lucidchart is a web-based diagramming application that allows users to visually collaborate on drawing, revising and sharing charts and diagrams, and improve processes, systems, and organizational structures. It is produced by Lucid Software Inc., based in Utah, United States and co-founded by Ben Dilts and Karl Sun. Lucidchart is used by companies such as Google, GE, NBC Universal, and Amazon.
MindMeister is an online mind mapping application that allows its users to visualize, share and present their thoughts via the cloud. MindMeister was launched in 2007 by MeisterLabs GmbH, a software company founded by Michael Hollauf and Till Vollmer. After 10 years in the market, MindMeister has more than 7 million users who created more than a billion ideas to date.
SmartDraw is a web-based diagramming tool used by teams to collaborate on and make flowcharts, organization charts, mind maps, project charts, and other business visuals.

yEd is a general-purpose diagramming program with a multi-document interface.
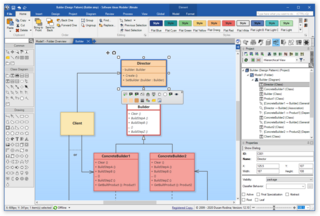
Software Ideas Modeler is a CASE and an UML tool. The modeler supports all 14 diagram types specified in UML 2.5. It also supports among others the following diagrams and standards:
Edraw Max is a 2D business technical diagramming software which helps create flowcharts, organizational charts, mind map, network diagrams, floor plans, workflow diagrams, business charts, and engineering diagrams. The current version, Edraw Max 12.6.1 was released in October 2023 for Microsoft Windows, macOS, Linux, Android and iOS. Edraw Max is a Visio-like diagramming tool.
Piktochart is a web-based graphic design tool and infographic maker.

ConceptDraw DIAGRAM is proprietary diagramming software used to create business graphics, including: diagrams, flowcharts, Infographics, data visualization for business process models, data presentation and project management documentation. It can also be used for creating professional and technical diagrams, such as: UML diagrams, DFD, ERD, computer networks topology, engineering schemes, floor plans, and other technical graphic formats. The program was developed by CS Odessa in 1999. Since 2008, it has formed a part of ConceptDraw OFFICE. A set of solution add-ons that include collections of task-oriented templates and vector stencils libraries, have been released for ConceptDraw DIAGRAM, relating to certain industry-specific graphical tasks. The software also contains a set of tools for vector graphics drawing, along with a built-in presentation mode.
Google Drawings is a diagramming software included as part of the free, web-based Google Docs Editors suite offered by Google. The service also includes Google Docs, Google Sheets, Google Slides, Google Forms, Google Sites, and Google Keep. Google Drawings is available as a web application and as a desktop application on Google's ChromeOS. The app allows users to create and edit flowcharts, organisational charts, website wireframes, mind maps, concept maps, and other types of diagrams online while collaborating with other users in real-time.
MindView is a mind mapping and project management software owned by the company MatchWare. MindView is used for mind mapping, concept mapping, work breakdown structures, timelines, Gantt charts, organizational charts, and other visuals.
References
- 1 2 August 2020, Chyelle Dvorak 17. "Creately diagramming software review". TechRadar. Retrieved 2020-12-05.
{{cite web}}: CS1 maint: numeric names: authors list (link) - ↑ "Lucidchart". PCMag India. 2020-02-21. Retrieved 2020-12-05.
- ↑ West, Angela; business, PCWorld | About | Smart tech advice for your small (2012-04-03). "How to Get Started With Infographics". PCWorld. Retrieved 2020-12-05.
{{cite web}}:|last2=has generic name (help) - ↑ Wertz, Jia. "3 Ways Digital Commerce And Tech Booms, As Quarantine Looms". Forbes. Retrieved 2020-12-05.
- ↑ "14 Tools for Infographics, to Enhance Digital Marketing". Practical Ecommerce. 2016-03-28. Retrieved 2020-12-05.
- ↑ "LucidChart and Creately Plug Flowchart Tools into Google Apps". Lifehacker. Retrieved 2020-12-10.
- ↑ "Mind maps: A brainstorm of success". MSU Extension. Retrieved 2020-12-05.
- ↑ "Online mind mapping and diagram making - Details". www.mind-mapping.org. Retrieved 2020-12-05.
- ↑ "How Your Organization Can Thrive Using Visual Communication". Business 2 Community. Retrieved 2020-12-05.
- ↑ Rampton, John. "A Small Business Owner's Guide to Building an Internet Presence". Forbes. Retrieved 2020-12-05.
- ↑ Colestock, Stephanie. "The 7 Best Flowchart Software of 2020". Investopedia. Retrieved 2020-12-05.
- ↑ "Creately Combines Chart Smarts with Collaboration (200 Invites)". ReadWrite. 2009-05-11. Retrieved 2020-12-05.
- ↑ Wijeratne, Yudhanjaya (2015-03-18). "Borella versus Microsoft: the story of Cinergix". README. Retrieved 2020-12-05.
- ↑ Perera, Sachith. "Chronicling YouthHack Sri Lanka's Startup Challenge". README. Retrieved 2020-12-05.
- ↑ "Word BPM Magazine Nº 1". Issuu. Retrieved 2020-12-05.
- ↑ "AWS Partner Solutions Finder". partners.amazonaws.com. Retrieved 2020-12-05.
- ↑ Kaufman, Lori (2018-09-17). "8 Online Tools to Draw Diagrams and Flowcharts". groovyPost. Retrieved 2020-12-05.
- ↑ Mishra, Rajesh (2019-09-04). "12 Best LucidChart Alternatives You Should Use in 2020". Beebom. Retrieved 2020-12-05.
- ↑ "What is Concept Map and How to Create One?". Geekflare. 2020-08-27. Retrieved 2020-12-05.
- ↑ "Creately Review". PCMAG. Retrieved 2020-12-10.
- ↑ "Creately Integrations". creately.com. Retrieved 2020-12-07.
- ↑ benaston (2020-01-01). "10 Best Online Flowchart Software of 2020". The Digital Project Manager. Retrieved 2020-12-05.
- ↑ "Top 8 Free Alternatives to Microsoft Visio". Guiding Tech. Retrieved 2020-12-05.