CrimeStat

Last updated
1st-order and 2nd-order San Antonio robbery hot spots produced by CrimeStat Nnh routine. CrimeStat Nnh.png
1st-order and 2nd-order San Antonio robbery hot spots produced by CrimeStat Nnh routine.

CrimeStat is a crime mapping software program. CrimeStat is Windows-based program that conducts spatial and statistical analysis and is designed to interface with a geographic information system (GIS). The program is developed by Ned Levine & Associates under the direction of Ned Levine, with funding by the National Institute of Justice (NIJ), an agency of the United States Department of Justice. The program and manual are distributed for free by NIJ.

Contents

CrimeStat performs spatial analysis on objects located in a GIS. The objects can be points (e.g., events, locations), zones (e.g., blocks, traffic analysis zones, cities) or lines (e.g., street segments). The program can analyze the distribution of the objects, identify hot spots, indicate spatial autocorrelation, monitor the interaction of events in space and time, and model travel behavior.

There is a regression module for non-linear spatial modeling. Some of its tools are specific to crime analysis. Others can by applied in many fields. There are 55 statistical routines in the program.

Development

'Head Bang' smoothing of Houston burglary rate produced by CrimeStat Head Bang interpolation routine. CrimeStat Head Bang.png
'Head Bang' smoothing of Houston burglary rate produced by CrimeStat Head Bang interpolation routine.

CrimeStat has been developed since the mid-1990s under the direction of Ned Levine. The first prototype was a Unix-based C++ program called Pointstat that was developed to analyze motor vehicle crashes in Honolulu. [1] [2] In 1996, the National Institute of Justice funded the first version of CrimeStat and the early Pointstat routines were folded into the program.

The first version (1.0) was released in August 1999: the latest version is 3.3 (July 2010).

Functionality

Data setup

CrimeStat can input data both attribute and GIS files but requires that all datasets have geographical coordinates assigned for the objects. The basic file format is dBase (dbf) but shape (shp), and Ascii text files can also be read. The program requires a Primary File but many routines also use a Secondary File. CrimeStat uses three coordinate systems: spherical (longitude, latitude), projected and directional (angles).

Distance can be measured as direct, indirect (Manhattan) or on a network (which also allows travel time or speed to be used). Distance units are decimal degrees for spherical coordinates and feet, meters, miles, kilometers, or nautical miles for projected coordinates. The program can create reference grids. Several routines also use the area of the geographical region for their calculations.

Statistical routines

The spatial description routines include:

Monte Carlo simulations can be run on many routines to estimate credible intervals.

The spatial modeling routines include:

Auto theft risk in Baltimore County produced by CrimeStat dual kernel density routine. CrimeStat Dual Kernel.png
Auto theft risk in Baltimore County produced by CrimeStat dual kernel density routine.
  1. Single kernel density interpolation for examining variation over a region of a single variable
  2. Dual kernel density interpolation of two variables (e.g., a set of events in relation to a population ‘at risk’)
  3. Head Bang routine for smoothing zonal data [3] [4]
  4. ”Interpolated Head Bang surface that interpolates the Head Bang estimates to a grid
  5. ”Knox and Mantel indexes that identify the interaction between space and time in events
  6. Correlated Walk Analysis, based on random walk theory, for modeling the sequential behavior of a serial offender in space and time and makes a prediction about the next event
  7. Journey-to-crime analysis for modeling the likely origin of a serial offender based on the location of prior events committed by the offender (geographic profiling)
  8. Bayesian Journey-to-crime which is an empirical Bayes method that integrates the Journey-to-crime estimate with information on the residence location of other serial offenders who committed crimes in the same places to produce an updated estimate. The diagnostic routine compares this estimate with its components in predicting the residence location for multiple serial offenders [5] [6]
  9. Bayesian Journey-to-crime estimation which applies the Bayesian Journey-to-crime method to estimate the location of one serial offender
  10. Spatial regression. The models include ordinary least squares, Poisson regression and various other generalized linear models for count data. In addition there are Markov chain Monte Carlo routines for fitting Poisson-Gamma and Poisson-Lognormal models, including where these have a conditional spatial autoregression (CAR or SAR) adjustment.

The Crime Travel Demand module models crime travel over a metropolitan area. It is an application of travel demand modeling to crime or other rare events. [7] [8] The purpose is to calibrate the travel behavior of a large number of offenders in committing crimes as a basis for modeling alternative interventions by law enforcement [9] [10]

Crime trips in Baltimore County produced by CrimeStat Crime Travel Demand module. CrimeStat Trip Distribution.png
Crime trips in Baltimore County produced by CrimeStat Crime Travel Demand module.

Output

CrimeStat has three different types of output:

Shortcomings

Unlike some other spatial statistics programs, CrimeStat has no mapping capabilities and must be used with GIS software. Some users have found that the GUI interface is difficult to understand and inconsistent between routines.[ citation needed ]

Because CrimeStat analyzes points in most routines, its results are not always consistent with those of software that analyzes areas (e.g. GeoDa). Finally, the size of the manual may be daunting to new users of spatial statistics.

Ancillary CrimeStat development

In addition to the development of the CrimeStat program, all the routines through[ clarification needed ] version 2.0 plus the spatial autocorrelation routines have been converted into .NET libraries for use in third-party applications. Version 1.0 of the CrimeStat Libraries was released in August 2010 and is available on the CrimeStat web page.

Reviews and examples

Reviews and examples of CrimeStat in its application to crime analysis have been published. [11] [12] [13] Examples of the use of CrimeStat outside of crime analysis have also appeared. [14] [15] [16] [17] [18]

Use of CrimeStat by Baltimore County Police analysts

Baltimore County Police analysts use CrimeStat to perform various spatial analytics.[ citation needed ] The primary responsibility of police analysts in Baltimore County is to identify and address existing or anticipated crime problems. Police analysts use “hot spot analysis” in CrimeStat to identify areas within the county having high concentrations of crime. Another example demonstrating the use of CrimeStat involves the department's Data Driven Approaches to Crime and Traffic Safety (DDACTS).

Police analysts used Nearest Neighbor Hierarchical Spatial clustering to identify areas having high concentrations of crime and traffic accidents. Analysts found that the two cluster groups, crime and accidents, did tend to overlap in many areas of the county. The County's DDACTS program was initiated to increase police presence in the target areas. Preliminary results have been encouraging, with most targeted crimes and traffic accidents dropping in DDACTS areas.

The Department's DDACTS program has since become a model nationwide with the support of the National Highway Traffic Safety Administration. Finally, police analysts have used CrimeStat's Journey to Crime and Bayesian Journey to Crime Estimation models to successfully identify a serial offender's activity space. Once an offender's activity space has been identified, police analysts will examine information captured from other police sources such as traffic stops, Field Interview Reports, and License Plate Readers to determine if a contact was made with a potential offender.

Police have also used CrimeStat's Crime Travel Demand model to identify road networks used by drivers under the influence (DUI). Roadways identified by the Crime Travel Demand model were targeted for interdiction programs by the department's DUI Enforcement Team. Similar weighted road networks have been used in conjunction with Journey to Crime models to improve identification of an offender's activity space.

See also

Related Research Articles

Geographic information system System to capture, manage and present geographic data

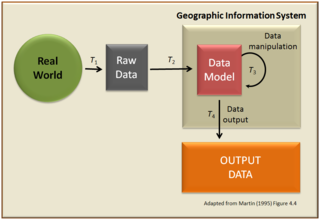
A geographic information system (GIS) is a conceptualized framework that provides the ability to capture and analyze spatial and geographic data. GIS applications are computer-based tools that allow the user to create interactive queries, store and edit spatial and non-spatial data, analyze spatial information output, and visually share the results of these operations by presenting them as maps.

Geographic profiling is a criminal investigative methodology that analyzes the locations of a connected series of crimes to determine the most probable area of offender residence. By incorporating both qualitative and quantitative methods, it assists in understanding spatial behaviour of an offender and focusing the investigation to a smaller area of the community. Typically used in cases of serial murder or rape, the technique helps police detectives prioritize information in large-scale major crime investigations that often involve hundreds or thousands of suspects and tips.

Crime mapping

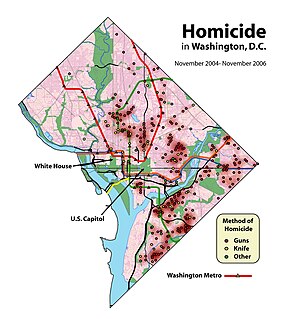
Crime mapping is used by analysts in law enforcement agencies to map, visualize, and analyze crime incident patterns. It is a key component of crime analysis and the CompStat policing strategy. Mapping crime, using Geographic Information Systems (GIS), allows crime analysts to identify crime hot spots, along with other trends and patterns.

Geoinformatics is the science and the technology which develops and uses information science infrastructure to address the problems of geography, cartography, geosciences and related branches of science and engineering.

Spatial ecology studies the ultimate distributional or spatial unit occupied by a species. In a particular habitat shared by several species, each of the species is usually confined to its own microhabitat or spatial niche because two species in the same general territory cannot usually occupy the same ecological niche for any significant length of time.

ArcGIS Geographic information system maintained by Esri

ArcGIS is a geographic information system (GIS) for working with maps and geographic information maintained by the Environmental Systems Research Institute (Esri). It is used for creating and using maps, compiling geographic data, analyzing mapped information, sharing and discovering geographic information, using maps and geographic information in a range of applications, and managing geographic information in a database.

Spatial analysis Formal techniques which study entities using their topological, geometric, or geographic properties

Spatial analysis or spatial statistics includes any of the formal techniques which studies entities using their topological, geometric, or geographic properties. Spatial analysis includes a variety of techniques, many still in their early development, using different analytic approaches and applied in fields as diverse as astronomy, with its studies of the placement of galaxies in the cosmos, to chip fabrication engineering, with its use of "place and route" algorithms to build complex wiring structures. In a more restricted sense, spatial analysis is the technique applied to structures at the human scale, most notably in the analysis of geographic data.

Crime analysis

Crime analysis is a law enforcement function that involves systematic analysis for identifying and analyzing patterns and trends in crime and disorder. Information on patterns can help law enforcement agencies deploy resources in a more effective manner, and assist detectives in identifying and apprehending suspects. Crime analysis also plays a role in devising solutions to crime problems, and formulating crime prevention strategies. Quantitative social science data analysis methods are part of the crime analysis process, though qualitative methods such as examining police report narratives also play a role.

Modifiable areal unit problem

The modifiable areal unit problem (MAUP) is a source of statistical bias that can significantly impact the results of statistical hypothesis tests. MAUP affects results when point-based measures of spatial phenomena are aggregated into districts, for example, population density or illness rates. The resulting summary values are influenced by both the shape and scale of the aggregation unit.

Spatial epidemiology is a subfield of epidemiology focused on the study of the spatial distribution of health outcomes; it is closely related to health geography.

Correlogram

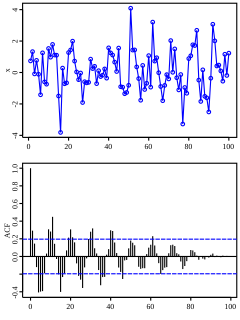
In the analysis of data, a correlogram is a chart of correlation statistics. For example, in time series analysis, a plot of the sample autocorrelations versus is an autocorrelogram. If cross-correlation is plotted, the result is called a cross-correlogram.

In the context of spatial analysis, geographic information systems, and geographic information science, a field is a property that fills space, and varies over space, such as temperature or density. This use of the term has been adopted from physics and mathematics, due to their similarity to physical fields such as the electromagnetic field or gravitational field. Synonymous terms include spatially dependent variable (geostatistics), statistical surface, and intensive property (Chemistry) and crossbreeding between these disciplines is common. The simplest formal model for a field is the function, which yields a single value given a point in space

GeoDa

GeoDa is a free software package that conducts spatial data analysis, geovisualization, spatial autocorrelation and spatial modeling.

CrimeView is a crime analysis, mapping and reporting software extension to ArcGIS. It is designed for the detailed study of patterns of crime as they relate to geography and time.

CrimeAnalyst is an extension for ArcGIS Desktop, a suite of geographic information system (GIS) software products. It provides added functionality for crime analysis and crime mapping. CrimeAnalyst is produced by ESRI (UK).

A boundary problem in analysis is a phenomenon in which geographical patterns are differentiated by the shape and arrangement of boundaries that are drawn for administrative or measurement purposes. The boundary problem occurs because of the loss of neighbors in analyses that depend on the values of the neighbors. While geographic phenomena are measured and analyzed within a specific unit, identical spatial data can appear either dispersed or clustered depending on the boundary placed around the data. In analysis with point data, dispersion is evaluated as dependent of the boundary. In analysis with areal data, statistics should be interpreted based upon the boundary.

Geographic information systems (GIS) play a constantly evolving role in geospatial intelligence (GEOINT) and United States national security. These technologies allow a user to efficiently manage, analyze, and produce geospatial data, to combine GEOINT with other forms of intelligence collection, and to perform highly developed analysis and visual production of geospatial data. Therefore, GIS produces up-to-date and more reliable GEOINT to reduce uncertainty for a decisionmaker. Since GIS programs are Web-enabled, a user can constantly work with a decision maker to solve their GEOINT and national security related problems from anywhere in the world. There are many types of GIS software used in GEOINT and national security, such as Google Earth, ERDAS IMAGINE, GeoNetwork opensource, and Esri ArcGIS.

Crime hotspots are areas that have high crime intensity. These are usually visualized using a map. They are developed for researchers and analysts to examine geographic areas in relation to crime. Researchers and theorists examine the occurrence of hotspots in certain areas and why they happen, and analysts examine the techniques used to perform the research. Developing maps that contain hotspots are becoming a critical and influential tool for policing; they help develop knowledge and understanding of different areas in a city and possibly why crime occurs there.

A Crime concentration is a spatial area to which high levels of crime incidents are attributed. A crime concentration can be the result of homogeneous or heterogeneous crime incidents. Hotspots are the result of various crimes occurring in relative proximity to each other within predefined human geopolitical or social boundaries. Crime concentrations are smaller units or set of crime targets within a hotspot. A single or a conjunction of crime concentrations within a study area can make up a crime hotspot.

Environmental Criminology Research Inc. (ECRI) is a crime analysis software company based in Vancouver, British Columbia, Canada. The company develops tools for police, military and security use. ECRI pioneered the use of geographic profiling software for serial crime analysis.

References

  1. Levine, N. "Spatial statistics and GIS: software tools to quantify spatial patterns", Journal of the American Planning Association. 1996. 62 (3), 381-392.
  2. Levine, N., Kim, K. E., & Nitz, L. H. (1995). "Spatial analysis of Honolulu motor vehicle crashes: I. Spatial patterns". Accident Analysis & Prevention, 27 (5), 663-674.
  3. Mungiole, M., Pickle, L. W., & Simonson, K. H. (2002). Application of a weighted Head-Banging algorithm to Mortality data maps, Statistics in Medicine, 18, 3201-3209.
  4. Mungiole, M. & Pickle, L. W. (1999). Determining the optimal degree of smoothing using the weighted head banging algorithm on mapped mortality data, In ASC '99 Leading Survey & Statistical Computing into the New Millennium, Proceedings of the ASC International Conference, September. Archived 2010-05-27 at the Wayback Machine
  5. Levine, N. & Block, R. (2011). “Bayesian Journey to crime estimation: an improvement in geographic profiling methodology”. The Professional Geographer, 63(2), 1–17.
  6. JIP-OP (2009). Articles by Levine, N., Canter, D., Block, R., Bernasco, W., Leitner, M., Kent, J., Lee, P., and O’Leary, M., Special issue on Bayesian Journey-to-crime modeling. Journal of Investigative Psychology and Offender Profiling, 6 (3).
  7. Hensher, D. A. & Button, K. J. (2002). Handbook of Transport Modeling. Elsevier Science: Cambridge, UK.
  8. Ortuzar, Juan de Dios and Luis G. Willumsen (2001). Modeling Transport (3rd edition). J. Wiley & Sons: New York.
  9. Levine, N. and Canter, P. (2011) "Linking origins with destinations for DWI Motor Vehicle Crashes: An application of crime travel demand modeling". Crime Mapping. In press.
  10. Levine, N. (2007), “Crime travel demand and bank robberies: Using CrimeStat III to model bank robbery trips”. Social Science Computer Review, 25(2), 239-258.
  11. Brodsky, H. (2002). “CrimeStat II on the geostatistical scene”. Geospatial Solutions, November. 49-53
  12. Paulsen, D. & Robinson, M. (2008).Spatial Aspects of Crime: Theory and Practice (2nd edition). Allyn & Bacon.
  13. Chainey, S. & Ratcliffe, J. (2005). GIS and Crime Mapping. John Wiley & Sons, Ltd.
  14. Lai PC, Low CT, Wong M, Wong WC, & Chan MH. (2009). “Spatial analysis of falls in an urban community of Hong Kong”, International Journal of Health Geography, 17:8-14
  15. de Smith, M. J., Goodchild, M. F., & Longley, P. A. (2007). Geospatial Analysis (second edition). The Winchelsea Press: Leicester, U.K.
  16. Anne van der Veen, A. (2005). “Economic hotspots: Visualizing Vulnerability to Flooding”, Natural Hazards, 36(1-2), 65-80.
  17. Anselin, L. (2003). “An Introduction to Point Pattern Analysis using CrimeStat”, GeoDa Center, Arizona State University: Tempe. http://geodacenter.asu.edu/system/files/points.pdf
  18. Clevenger, A. P., Chruszcz, B. & Gunson, K. E. (2001). “Highway mitigation fencing reduces wildlife-vehicle collisions”, Wildlife Society Bulletin, 29(2),646-653.

Further reading