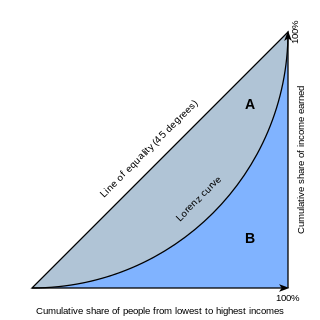
In economics, the Lorenz curve is a graphical representation of the distribution of income or of wealth. It was developed by Max O. Lorenz in 1905 for representing inequality of the wealth distribution.

In probability theory and statistics, a probability distribution is the mathematical function that gives the probabilities of occurrence of different possible outcomes for an experiment. It is a mathematical description of a random phenomenon in terms of its sample space and the probabilities of events.
Accuracy and precision are two measures of observational error. Accuracy is how close a given set of measurements are to their true value, while precision is how close the measurements are to each other.

Cross-validation, sometimes called rotation estimation or out-of-sample testing, is any of various similar model validation techniques for assessing how the results of a statistical analysis will generalize to an independent data set. Cross-validation includes resampling and sample splitting methods that use different portions of the data to test and train a model on different iterations. It is often used in settings where the goal is prediction, and one wants to estimate how accurately a predictive model will perform in practice. It can also be used to assess the quality of a fitted model and the stability of its parameters.
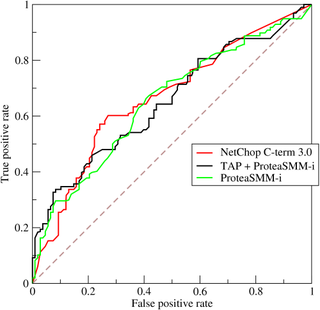
A receiver operating characteristic curve, or ROC curve, is a graphical plot that illustrates the performance of a binary classifier model at varying threshold values.

The positive and negative predictive values are the proportions of positive and negative results in statistics and diagnostic tests that are true positive and true negative results, respectively. The PPV and NPV describe the performance of a diagnostic test or other statistical measure. A high result can be interpreted as indicating the accuracy of such a statistic. The PPV and NPV are not intrinsic to the test ; they depend also on the prevalence. Both PPV and NPV can be derived using Bayes' theorem.

In statistical analysis of binary classification and information retrieval systems, the F-score or F-measure is a measure of predictive performance. It is calculated from the precision and recall of the test, where the precision is the number of true positive results divided by the number of all samples predicted to be positive, including those not identified correctly, and the recall is the number of true positive results divided by the number of all samples that should have been identified as positive. Precision is also known as positive predictive value, and recall is also known as sensitivity in diagnostic binary classification.
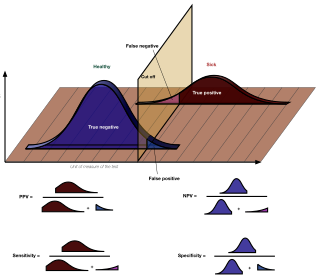
In medicine and statistics, sensitivity and specificity mathematically describe the accuracy of a test that reports the presence or absence of a medical condition. If individuals who have the condition are considered "positive" and those who do not are considered "negative", then sensitivity is a measure of how well a test can identify true positives and specificity is a measure of how well a test can identify true negatives:
Youden's J statistic is a single statistic that captures the performance of a dichotomous diagnostic test. (Bookmaker) Informedness is its generalization to the multiclass case and estimates the probability of an informed decision.
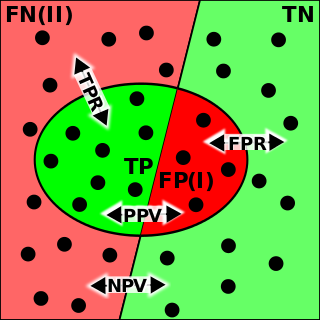
In pattern recognition, information retrieval, object detection and classification, precision and recall are performance metrics that apply to data retrieved from a collection, corpus or sample space.
In statistics, the phi coefficient is a measure of association for two binary variables.

In medical testing with binary classification, the diagnostic odds ratio (DOR) is a measure of the effectiveness of a diagnostic test. It is defined as the ratio of the odds of the test being positive if the subject has a disease relative to the odds of the test being positive if the subject does not have the disease.
Receiver Operating Characteristic Curve Explorer and Tester (ROCCET) is an open-access web server for performing biomarker analysis using ROC curve analyses on metabolomic data sets. ROCCET is designed specifically for performing and assessing a standard binary classification test. ROCCET accepts metabolite data tables, with or without clinical/observational variables, as input and performs extensive biomarker analysis and biomarker identification using these input data. It operates through a menu-based navigation system that allows users to identify or assess those clinical variables and/or metabolites that contain the maximal diagnostic or class-predictive information. ROCCET supports both manual and semi-automated feature selection and is able to automatically generate a variety of mathematical models that maximize the sensitivity and specificity of the biomarker(s) while minimizing the number of biomarkers used in the biomarker model. ROCCET also supports the rigorous assessment of the quality and robustness of newly discovered biomarkers using permutation testing, hold-out testing and cross-validation.
The evaluation of binary classifiers compares two methods of assigning a binary attribute, one of which is usually a standard method and the other is being investigated. There are many metrics that can be used to measure the performance of a classifier or predictor; different fields have different preferences for specific metrics due to different goals. For example, in medicine sensitivity and specificity are often used, while in computer science precision and recall are preferred. An important distinction is between metrics that are independent on the prevalence, and metrics that depend on the prevalence – both types are useful, but they have very different properties.
The total operating characteristic (TOC) is a statistical method to compare a Boolean variable versus a rank variable. TOC can measure the ability of an index variable to diagnose either presence or absence of a characteristic. The diagnosis of presence or absence depends on whether the value of the index is above a threshold. TOC considers multiple possible thresholds. Each threshold generates a two-by-two contingency table, which contains four entries: hits, misses, false alarms, and correct rejections.
In machine learning, hyperparameter optimization or tuning is the problem of choosing a set of optimal hyperparameters for a learning algorithm. A hyperparameter is a parameter whose value is used to control the learning process.
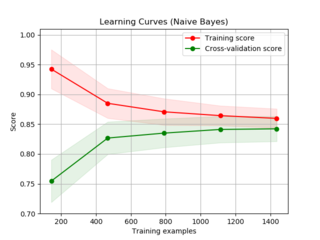
In machine learning, a learning curve plots the optimal value of a model's loss function for a training set against this loss function evaluated on a validation data set with same parameters as produced the optimal function. Synonyms include error curve, experience curve, improvement curve and generalization curve.
Fairness in machine learning refers to the various attempts at correcting algorithmic bias in automated decision processes based on machine learning models. Decisions made by computers after a machine-learning process may be considered unfair if they were based on variables considered sensitive. For example gender, ethnicity, sexual orientation or disability. As it is the case with many ethical concepts, definitions of fairness and bias are always controversial. In general, fairness and bias are considered relevant when the decision process impacts people's lives. In machine learning, the problem of algorithmic bias is well known and well studied. Outcomes may be skewed by a range of factors and thus might be considered unfair with respect to certain groups or individuals. An example would be the way social media sites deliver personalized news to consumers.
Decision curve analysis evaluates a predictor for an event as a probability threshold is varied, typically by showing a graphical plot of net benefit against threshold probability. By convention, the default strategies of assuming that all or no observations are positive are also plotted.
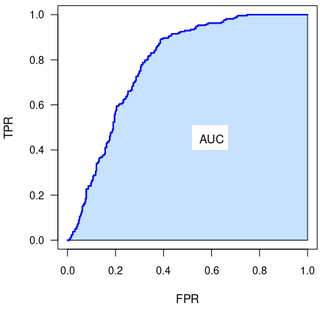
The Partial Area Under the ROC Curve (pAUC) is a metric for the performance of binary classifier.