DBFS

Last updated
Clipping of a digital waveform. The red lines indicate full scale, and the waveform is shown before and after hard clipping (grey and black outlines respectively). Clipping.svg
Clipping of a digital waveform. The red lines indicate full scale, and the waveform is shown before and after hard clipping (grey and black outlines respectively).

Decibels relative to full scale (dBFS or dB FS) is a unit of measurement for amplitude levels in digital systems, such as pulse-code modulation (PCM), which have a defined maximum peak level. The unit is similar to the units dBov and decibels relative to overload (dBO). [1]

Contents

The level of 0dBFS is assigned to the maximum possible digital level. [2] For example, a signal that reaches 50% of the maximum level has a level of −6dBFS, which is 6dB below full scale. Conventions differ for root mean square (RMS) measurements, but all peak measurements smaller than the maximum are negative levels.

A digital signal that does not contain any samples at 0dBFS can still clip when converted to analog form due to the signal reconstruction process interpolating between samples. [3] This can be prevented by careful digital-to-analog converter circuit design. [4] Measurements of the true inter-sample peak levels are notated as dBTP or dB TP ("decibels true peak"). [5] [6]

RMS levels

Since a peak measurement is not useful for qualifying the noise performance of a system, [7] or measuring the loudness of an audio recording, for instance, RMS measurements are often used instead.

A potential for ambiguity exists when assigning a level on the dBFS scale to a waveform rather than to a specific amplitude, because some engineers follow the mathematical definition of RMS, which for sinusoidal signals is −3dB below the peak value, while others choose the reference level so that RMS and peak measurements of a sine wave produce the same result. [8] [9] [10] [11] [12]

The unit dB FS or dBFS is defined in AES Standard AES17-1998, [13] IEC 61606, [14] and ITU-T Recs. P.381 [15] and P.382, [16] such that the RMS value of a full-scale sine wave is designated 0dB FS. This means a full-scale square wave would have an RMS value of +3dB FS. [17] [18] This convention is used in Wolfson [19] and Cirrus Logic [20] digital microphone specs, etc.

The unit dBov is defined in the ITU-T G.100.1 telephony standard such that the RMS value of a full-scale square wave is designated 0dBov. [21] [22] All possible dBov measurements are negative numbers, and a sine wave cannot exist at a larger RMS value than −3 dBov without clipping. [21] This unit can be applied to both analog and digital systems. [21] This convention is the basis for the ITU's LUFS loudness unit, [23] and is also used in Sound Forge [10] and Euphonix meters, [24] and Analog Devices digital microphone specs [25] (though referred to as "dBFS").

Dynamic range

The measured dynamic range (DR) of a digital system is the ratio of the full scale signal level to the RMS noise floor. The theoretical minimum noise floor is caused by quantization noise. This is usually modeled as a uniform random fluctuation between −12 LSB and +12 LSB. (Only certain signals produce uniform random fluctuations, so this model is typically, but not always, accurate.) [26]

As the dynamic range is measured relative to the RMS level of a full scale sine wave, the dynamic range and the level of this quantization noise in dBFS can both be estimated with the same formula (though with reversed sign):

The value of n equals the resolution of the system in bits or the resolution of the system minus 1 bit (the measure error). For example, a 16-bit system has a theoretical minimum noise floor of −98.09dBFS relative to a full-scale sine wave:

In any real converter, dither is added to the signal before sampling. This removes the effects of non-uniform quantization error, but increases the minimum noise floor.

History

The phrase "dB below full scale" has appeared in print since the 1950s, [27] [28] [29] and the term "dBFS" has been used since 1977. [30]

Although the decibel (dB) is permitted for use alongside units of the International System of Units (SI), the dBFS is not. [31]

Analog levels

dBFS is not defined for analog levels, according to standard AES-6id-2006. No single standard converts between digital and analog levels, mostly due to the differing capabilities of different equipment. The amount of oversampling also affects the conversion with values that are too low having significant error. The conversion level is chosen as the best compromise for the typical headroom and signal-to-noise levels of the equipment in question. Examples: [32] [33] [34]

See also

Related Research Articles

The decibel is a relative unit of measurement equal to one tenth of a bel (B). It expresses the ratio of two values of a power or root-power quantity on a logarithmic scale. Two signals whose levels differ by one decibel have a power ratio of 101/10 or root-power ratio of 10120.

The amplitude of a periodic variable is a measure of its change in a single period. The amplitude of a non-periodic signal is its magnitude compared with a reference value. There are various definitions of amplitude, which are all functions of the magnitude of the differences between the variable's extreme values. In older texts, the phase of a periodic function is sometimes called the amplitude.

<span class="mw-page-title-main">Weighting filter</span>

A weighting filter is used to emphasize or suppress some aspects of a phenomenon compared to others, for measurement or other purposes.

Dynamic range is the ratio between the largest and smallest values that a certain quantity can assume. It is often used in the context of signals, like sound and light. It is measured either as a ratio or as a base-10 (decibel) or base-2 logarithmic value of the difference between the smallest and largest signal values.

Signal-to-noise ratio is a measure used in science and engineering that compares the level of a desired signal to the level of background noise. SNR is defined as the ratio of signal power to noise power, often expressed in decibels. A ratio higher than 1:1 indicates more signal than noise.

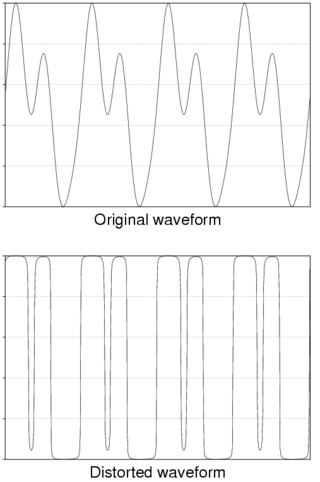
The total harmonic distortion is a measurement of the harmonic distortion present in a signal and is defined as the ratio of the sum of the powers of all harmonic components to the power of the fundamental frequency. Distortion factor, a closely related term, is sometimes used as a synonym.

<span class="mw-page-title-main">Audio system measurements</span> Means of quantifying system performance

Audio system measurements are a means of quantifying system performance. These measurements are made for several purposes. Designers take measurements so that they can specify the performance of a piece of equipment. Maintenance engineers make them to ensure equipment is still working to specification, or to ensure that the cumulative defects of an audio path are within limits considered acceptable. Audio system measurements often accommodate psychoacoustic principles to measure the system in a way that relates to human hearing.

Line level is the specified strength of an audio signal used to transmit analog audio between components such as CD and DVD players, television sets, audio amplifiers, and mixing consoles.

<span class="mw-page-title-main">VU meter</span> Audio signal level measurement device

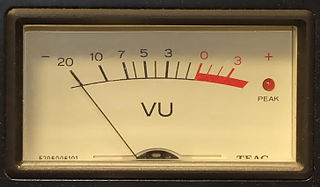
A volume unit (VU) meter or standard volume indicator (SVI) is a device displaying a representation of the signal level in audio equipment.

In electronics and signal processing, full scale represents the maximum amplitude a system can represent.

Crest factor is a parameter of a waveform, such as alternating current or sound, showing the ratio of peak values to the effective value. In other words, crest factor indicates how extreme the peaks are in a waveform. Crest factor 1 indicates no peaks, such as direct current or a square wave. Higher crest factors indicate peaks, for example sound waves tend to have high crest factors.

Audio normalization is the application of a constant amount of gain to an audio recording to bring the amplitude to a target level. Because the same amount of gain is applied across the entire recording, the signal-to-noise ratio and relative dynamics are unchanged. Normalization is one of the functions commonly provided by a digital audio workstation.

In digital and analog audio, headroom refers to the amount by which the signal-handling capabilities of an audio system can exceed a designated nominal level. Headroom can be thought of as a safety zone allowing transient audio peaks to exceed the nominal level without damaging the system or the audio signal, e.g., via clipping. Standards bodies differ in their recommendations for nominal level and headroom.

<span class="mw-page-title-main">Peak programme meter</span> A quasi-peak audio level meter originally developed in the 1930s

A peak programme meter (PPM) is an instrument used in professional audio that indicates the level of an audio signal.

<span class="mw-page-title-main">True RMS converter</span>

For the measurement of an alternating current the signal is often converted into a direct current of equivalent value, the root mean square (RMS). Simple instrumentation and signal converters carry out this conversion by filtering the signal into an average rectified value and applying a correction factor. The value of the correction factor applied is only correct if the input signal is sinusoidal.

dBm0 is an abbreviation for the power in dBm measured at a zero transmission level point (ZLP).

Audio noise measurement is a process carried out to assess the quality of audio equipment, such as the kind used in recording studios, broadcast engineering, and in-home high fidelity.

The alignment level in an audio signal chain or on an audio recording is a defined anchor point that represents a reasonable or typical level.

Spurious-free dynamic range (SFDR) is the strength ratio of the fundamental signal to the strongest spurious signal in the output. It is also defined as a measure used to specify analog-to-digital and digital-to-analog converters and radio receivers.

<span class="mw-page-title-main">Audio analyzer</span> Test and measurement instrument

An audio analyzer is a test and measurement instrument used to objectively quantify the audio performance of electronic and electro-acoustical devices. Audio quality metrics cover a wide variety of parameters, including level, gain, noise, harmonic and intermodulation distortion, frequency response, relative phase of signals, interchannel crosstalk, and more. In addition, many manufacturers have requirements for behavior and connectivity of audio devices that require specific tests and confirmations.

References

  1. M. Thurston, A; H. Pearce, T; D. Higman, M; Hawksford, Malcolm (1993-01-01), Bandpass Sigma Delta A-D Conversion, Springer, pp. 259–281, ISBN   9781441951311 , retrieved 2018-07-27, In all cases the reference power level used for measurements will be the overload point of the converter in question, and figures will be quoted in dBO.
  2. Price, Jim. "Understanding dB". Professional Audio. Retrieved 2007-03-13.
  3. Nielsen, Søren H.; Lund, Thomas. "0dBFS+ Levels in Digital Mastering" (PDF). TC Electronic A/S. Denmark. Archived from the original (PDF) on 2019-05-02. Retrieved 2018-07-27. inter-sample peaks may be considerably higher than 0dBFS.
  4. Aldrich, Nika (July 2003). "Digital Distortion in CD's and DVD's: The Consequences of Traditional Digital Peak Meters" (PDF). Trillium Lane Labs. Archived from the original (PDF) on 2010-08-16. Retrieved 20 November 2010.
  5. "BS.1770-4 (10/2015): Algorithms to measure audio programme loudness and true-peak audio level". International Telecommunication Union. Retrieved 2018-07-27. Meters that ... use an oversampled sampling rate of at least 192 kHz, should indicate the result in the units of dB TP [which] signifies decibels relative to 100% full scale, true-peak measurement.
  6. "Terminology for Loudness and Level dBTP, LU and all that - BBC R&D". BBC. January 2011. Retrieved 2018-07-27. As can be seen from the figure, if the peak sample values are 0 dBFS, the true peak will be higher than 0 dBTP.
  7. Davidson, J. (1961). "Average vs RMS meters for measuring noise". IRE Transactions on Audio. AU-9 (4): 108–111. doi:10.1109/tau.1961.1166333. ISSN   0096-1981. the conclusion is reached that the meaningful quantities are found by rms measurements. ... At this point it may be objected that other measurements, peak, or peak-to-peak voltage measurements in particular, are also significant. This is true, but not from the standpoint adopted here. Such measurements are applicable only to the field of nonlinear response, such as dielectric breakdown, etc.
  8. "RMS Settings" (PDF). Adobe Audition – User Guide for Windows. Adobe. 2003. Archived from the original (PDF) on 2007-01-27. Retrieved 2007-03-16. - Allows "0dB = FS Sine Wave" or "0dB = FS Square Wave"
  9. "0 Db Reference". Active Voice / Noise Level Monitor User's Guide. GL Communications, Inc. Retrieved 2007-03-16. - "0 Db" reference can be either "FS Sine Wave" or "FS Square1 1Wave"
  10. 1 2 Katz, Robert (2000-10-28). "Zero dBFS Defined". Digital Domain. Retrieved 2017-06-11. This method yields a result of -3dB for a full scale sine wave and 0dB for a full scale square wave. Sound Forge uses this method.
  11. "A/85 – Techniques for Establishing and Maintaining Audio Loudness for Digital Television — ATSC". ATSC. Retrieved 2018-07-27. many software programs indicate level on virtual meters by means of a conventional RMS calculation, leading to a full scale sine wave reading -3.01 dB FS, which is incorrect in the context of this document.
  12. "LUFS, dBFS, RMS... WTF ?!? How to read the new loudness meters - Production Advice". Production Advice. 2013-01-08. Retrieved 2018-07-27.
  13. "AES Standard » AES17-2015: AES standard method for digital audio engineering - Measurement of digital audio equipment". www.aes.org. Retrieved 2016-04-29. Because the definition of full scale is based on a sine wave, it will be possible with square-wave test signals to read as much as + 3,01 dB FS.
  14. "IEC 61606-3:2008 Audio and audiovisual equipment - Digital audio parts - Basic measurement methods of audio characteristics - Part 3: Professional use". International Electrotechnical Commission. 2008. Retrieved 2018-07-27. the r.m.s. amplitude of a ... 997 Hz sinusoid whose peak positive sample just reaches positive digital full-scale ... is defined as 0 dB FS
  15. "P.381 (03/17): Technical requirements and test methods for the universal wired headset or headphone interface of digital mobile terminals". International Telecommunication Union. 2017. Retrieved 2018-07-27. 0 dBFS represents the root mean square (RMS) level of a full-scale sinusoidal
  16. "P.382 (07/16): Technical requirements and test methods for multi-microphone wired headset or headphone interfaces of digital wireless terminals". International Telecommunication Union. Retrieved 2018-07-27. 0 dBFS represents the root mean square (RMS) level of a full-scale sinusoidal signal
  17. Digital and Analog Measurement Units for Digital CMOS Microphone Preamplifier ASICs (Analog Devices) - "The definition of 0 dBFS as a full-scale sine wave is used by several audio analyzers, and the rms and peak values in the digital domain for a sine wave are equal for these analyzers. … Thus, a square wave whose top and bottom are at the maximum digital codes has an rms value of 1.414 FFS or 3.01 dBFS"
  18. "10 Audio Recording". Tonmeister. 23 October 2011. Retrieved 30 January 2016.
  19. "WM7216E datasheet" (PDF). May 2016. Note that, because the definition of FSR is based on a sine wave, it is possible to support a square wave test signal output whose level is +3dBFS.[ permanent dead link ]
  20. "CS7250B datasheet" (PDF). Note that, because the definition of FSR is based on a sine wave, it is possible to support a square wave test signal output whose level is +3 dBFS.
  21. 1 2 3 "G.100.1 (06/15): The use of the decibel and of relative levels in speechband telecommunications". International Telecommunication Union. Retrieved 2018-07-27. The level of a tone with a digital amplitude (peak value) of xover is therefore L= –3.01 dBov.
  22. Zopf, Robert (2002). "Real-time Transport Protocol (RTP) Payload for Comfort Noise (CN)". tools.ietf.org. doi:10.17487/RFC3389 . Retrieved 2016-04-30. For example, in the case of a u-law system, the reference would be a square wave ... and this ... represents 0dBov
  23. "BS.1770-4 (10/2015): Algorithms to measure audio programme loudness and true-peak audio level". International Telecommunication Union. 2015. Retrieved 2018-07-27. If a 0 dB FS, 1 kHz ... sine wave is applied to the ... input, the indicated loudness will equal −3.01 LKFS.
  24. "Application Note 1: System 5 Metering: Peak vs. Average" (PDF). January 2002. On a logarithmic dB scale, the difference between a sine wave's peak and RMS average level is 3 dB. Euphonix bases its metering on the Audio Precision measurement system, which adheres to the RMS average technique.
  25. "Understanding Microphone Sensitivity". Analog. Retrieved 30 January 2016. so a digital microphone's output must be scaled from peak to rms by lowering the dBFS value. For a sinusoidal input, the rms level is 3 dB (the logarithmic measure of (FS√2) below the peak level ... A 94 dB SPL sinusoidal input signal will give a –26 dBFS peak output level, or a –29 dBFS rms level.
  26. Watkinson, John (2001). The Art of Digital Audio 3rd Edition. Focal Press. ISBN   978-0-240-51587-8.
  27. Automatic Control. Reinhold Publishing Corporation. 1957-01-01.
  28. Hewlett-Packard Journal. Hewlett-Packard Company. 1962-01-01.
  29. The General Radio Experimenter. General Radio Company. 1969-01-01.
  30. Robert, Talambiras (1977-05-01). "Some Considerations in the Design of Wide-Dynamic-Range Audio Digitizing Systems". It is convenient when working with A/D converters to define a 0 dB reference for a full-scale-to-full-scale sine wave. ... The quantizing noise in the Nyquist bandwidth for a 16 bit converter would be -98.08dbFS{{cite journal}}: Cite journal requires |journal= (help)
  31. Taylor 1995, Guide for the Use of the International System of Units (SI), NIST Special Publication SP811
  32. http://wiki.ibs.org.uk/faq/index.php?title=dBFS#dBFS%5B%5D
  33. Eberhard Sengpiel. "Decibel (dB) level conversion to volt". Sengpiel Audio. Retrieved 30 January 2016.
  34. http://www.broadcastpapers.com/whitepapers/paper_loader.cfm?pid=393%5B%5D