
In computing, a data warehouse, also known as an enterprise data warehouse (EDW), is a system used for reporting and data analysis and is considered a core component of business intelligence. Data warehouses are central repositories of integrated data from one or more disparate sources. They store current and historical data in one single place that are used for creating analytical reports for workers throughout the enterprise. This is beneficial for companies as it enables them to interrogate and draw insights from their data and make decisions.
Business intelligence comprises the strategies and technologies used by enterprises for the data analysis and management of business information. Common functions of business intelligence technologies include reporting, online analytical processing, analytics, dashboard development, data mining, process mining, complex event processing, business performance management, benchmarking, text mining, predictive analytics, and prescriptive analytics.
Online analytical processing, or OLAP, is an approach to answer multi-dimensional analytical (MDA) queries swiftly in computing. OLAP is part of the broader category of business intelligence, which also encompasses relational databases, report writing and data mining. Typical applications of OLAP include business reporting for sales, marketing, management reporting, business process management (BPM), budgeting and forecasting, financial reporting and similar areas, with new applications emerging, such as agriculture.

In computing, extract, transform, load (ETL) is a three-phase process where data is extracted, transformed and loaded into an output data container. The data can be collated from one or more sources and it can also be output to one or more destinations. ETL processing is typically executed using software applications but it can also be done manually by system operators. ETL software typically automates the entire process and can be run manually or on reccurring schedules either as single jobs or aggregated into a batch of jobs.

An OLAP cube is a multi-dimensional array of data. Online analytical processing (OLAP) is a computer-based technique of analyzing data to look for insights. The term cube here refers to a multi-dimensional dataset, which is also sometimes called a hypercube if the number of dimensions is greater than three.
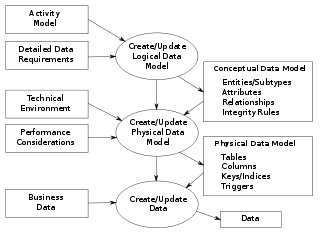
Data modeling in software engineering is the process of creating a data model for an information system by applying certain formal techniques. It may be applied as part of broader Model-driven engineering (MDD) concept.

In computing, the star schema or star model is the simplest style of data mart schema and is the approach most widely used to develop data warehouses and dimensional data marts. The star schema consists of one or more fact tables referencing any number of dimension tables. The star schema is an important special case of the snowflake schema, and is more effective for handling simpler queries.
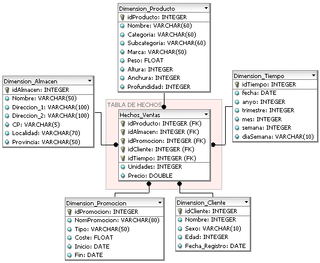
In data warehousing, a fact table consists of the measurements, metrics or facts of a business process. It is located at the center of a star schema or a snowflake schema surrounded by dimension tables. Where multiple fact tables are used, these are arranged as a fact constellation schema. A fact table typically has two types of columns: those that contain facts and those that are a foreign key to dimension tables. The primary key of a fact table is usually a composite key that is made up of all of its foreign keys. Fact tables contain the content of the data warehouse and store different types of measures like additive, non-additive, and semi-additive measures.

In computing, a snowflake schema or snowflake model is a logical arrangement of tables in a multidimensional database such that the entity relationship diagram resembles a snowflake shape. The snowflake schema is represented by centralized fact tables which are connected to multiple dimensions. "Snowflaking" is a method of normalizing the dimension tables in a star schema. When it is completely normalized along all the dimension tables, the resultant structure resembles a snowflake with the fact table in the middle. The principle behind snowflaking is normalization of the dimension tables by removing low cardinality attributes and forming separate tables.
Essbase is a multidimensional database management system (MDBMS) that provides a platform upon which to build analytic applications. Essbase began as a product from Arbor Software, which merged with Hyperion Software in 1998. Oracle Corporation acquired Hyperion Solutions Corporation in 2007. Until late 2005 IBM also marketed an OEM version of Essbase as DB2 OLAP Server.
Ralph Kimball is an author on the subject of data warehousing and business intelligence. He is one of the original architects of data warehousing and is known for long-term convictions that data warehouses must be designed to be understandable and fast. His bottom-up methodology, also known as dimensional modeling or the Kimball methodology, is one of the two main data warehousing methodologies alongside Bill Inmon.
Data integration involves combining data residing in different sources and providing users with a unified view of them. This process becomes significant in a variety of situations, which include both commercial and scientific domains. Data integration appears with increasing frequency as the volume, complexity and the need to share existing data explodes. It has become the focus of extensive theoretical work, and numerous open problems remain unsolved. Data integration encourages collaboration between internal as well as external users. The data being integrated must be received from a heterogeneous database system and transformed to a single coherent data store that provides synchronous data across a network of files for clients. A common use of data integration is in data mining when analyzing and extracting information from existing databases that can be useful for Business information.
Dimensional modeling (DM) is part of the Business Dimensional Lifecycle methodology developed by Ralph Kimball which includes a set of methods, techniques and concepts for use in data warehouse design. The approach focuses on identifying the key business processes within a business and modelling and implementing these first before adding additional business processes, as a bottom-up approach. An alternative approach from Inmon advocates a top down design of the model of all the enterprise data using tools such as entity-relationship modeling (ER).

Datavault or data vault modeling is a database modeling method that is designed to provide long-term historical storage of data coming in from multiple operational systems. It is also a method of looking at historical data that deals with issues such as auditing, tracing of data, loading speed and resilience to change as well as emphasizing the need to trace where all the data in the database came from. This means that every row in a data vault must be accompanied by record source and load date attributes, enabling an auditor to trace values back to the source. The concept was published in 2000 by Dan Linstedt.
The dimensional fact model (DFM) is an ad hoc and graphical formalism specifically devised to support the conceptual modeling phase in a data warehouse project. DFM is extremely intuitive and can be used by analysts and non-technical users as well. A short-term working is sufficient to realize a clear and exhaustive representation of multidimensional concepts. It can be used from the initial data warehouse life-cycle steps, to rapidly devise a conceptual model to share with customers.
The Kimball lifecycle is a methodology for developing data warehouses, and has been developed by Ralph Kimball and a variety of colleagues. The methodology "covers a sequence of high level tasks for the effective design, development and deployment" of a data warehouse or business intelligence system. It is considered a "bottom-up" approach to data warehousing as pioneered by Ralph Kimball, in contrast to the older "top-down" approach pioneered by Bill Inmon.

An aggregate is a type of summary used in dimensional models of data warehouses to shorten the time it takes to provide answers to typical queries on large sets of data. The reason why aggregates can make such a dramatic increase in the performance of a data warehouse is the reduction of the number of rows to be accessed when responding to a query.
The enterprise bus matrix is a data warehouse planning tool and model created by Ralph Kimball, and is part of the data warehouse bus architecture. The matrix is the logical definition of one of the core concepts of Kimball’s approach to dimensional modeling conformed dimension.
The term is used for two different things:
- In computer science, in-memory processing (PIM) is a computer architecture in which data operations are available directly on the data memory, rather than having to be transferred to CPU registers first. This may improve the power usage and performance of moving data between the processor and the main memory.
- In software engineering, in-memory processing is a software architecture where a database is kept entirely in random-access memory (RAM) or flash memory so that usual accesses, in particular read or query operations, do not require access to disk storage. This may allow faster data operations such as "joins", and faster reporting and decision-making in business.
The following is provided as an overview of and topical guide to databases:
