Data warehouse

Last updated
Data Warehouse and Data mart overview, with Data Marts shown in the top right. Data Warehouse & Data-Marts overview.svg
Data Warehouse and Data mart overview, with Data Marts shown in the top right.

In computing, a data warehouse (DW or DWH), also known as an enterprise data warehouse (EDW), is a system used for reporting and data analysis and is considered a core component of business intelligence. [1] Data warehouses are central repositories of integrated data from one or more disparate sources. They store current and historical data in one single place that are used for creating reports. This is beneficial for companies as it enables them to interrogate and draw insights from their data and make decisions. [2]

Contents

The basic architecture of a data warehouse Data warehouse architecture.jpg
The basic architecture of a data warehouse

The data stored in the warehouse is uploaded from the operational systems (such as marketing or sales). The data may pass through an operational data store and may require data cleansing for additional operations to ensure data quality before it is used in the data warehouse for reporting.

Extract, transform, load (ETL) and extract, load, transform (ELT) are the two main approaches used to build a data warehouse system.

Variants

ETL-based data warehousing

The typical extract, transform, load (ETL)-based data warehouse uses staging, data integration, and access layers to house its key functions. The staging layer or staging database stores raw data extracted from each of the disparate source data systems. The integration layer integrates disparate data sets by transforming the data from the staging layer, often storing this transformed data in an operational data store (ODS) database. The integrated data are then moved to yet another database, often called the data warehouse database, where the data is arranged into hierarchical groups, often called dimensions, and into facts and aggregate facts. The combination of facts and dimensions is sometimes called a star schema. The access layer helps users retrieve data. [3]

The main source of the data is cleansed, transformed, catalogued, and made available for use by managers and other business professionals for data mining, online analytical processing, market research and decision support. [4] However, the means to retrieve and analyze data, to extract, transform, and load data, and to manage the data dictionary are also considered essential components of a data warehousing system. Many references to data warehousing use this broader context. Thus, an expanded definition of data warehousing includes business intelligence tools, tools to extract, transform, and load data into the repository, and tools to manage and retrieve metadata.

ELT-based data warehousing

ELT-based data warehouse architecture ELT Diagram.png
ELT-based data warehouse architecture

ELT-based data warehousing gets rid of a separate ETL tool for data transformation. Instead, it maintains a staging area inside the data warehouse itself. In this approach, data gets extracted from heterogeneous source systems and are then directly loaded into the data warehouse, before any transformation occurs. All necessary transformations are then handled inside the data warehouse itself. Finally, the manipulated data gets loaded into target tables in the same data warehouse.

Benefits

A data warehouse maintains a copy of information from the source transaction systems. This architectural complexity provides the opportunity to:

Generic

The environment for data warehouses and marts includes the following:

In regards to source systems listed above, R. Kelly Rainer states, "A common source for the data in data warehouses is the company's operational databases, which can be relational databases". [5]

Regarding data integration, Rainer states, "It is necessary to extract data from source systems, transform them, and load them into a data mart or warehouse". [5]

Rainer discusses storing data in an organization's data warehouse or data marts. [5]

Metadata is data about data. "IT personnel need information about data sources; database, table, and column names; refresh schedules; and data usage measures". [5]

Today, the most successful companies are those that can respond quickly and flexibly to market changes and opportunities. A key to this response is the effective and efficient use of data and information by analysts and managers. [5] A "data warehouse" is a repository of historical data that is organized by the subject to support decision-makers in the organization. [5] Once data is stored in a data mart or warehouse, it can be accessed.

A data mart is a simple form of a data warehouse that is focused on a single subject (or functional area), hence they draw data from a limited number of sources such as sales, finance or marketing. Data marts are often built and controlled by a single department within an organization. The sources could be internal operational systems, a central data warehouse, or external data. [6] Denormalization is the norm for data modeling techniques in this system. Given that data marts generally cover only a subset of the data contained in a data warehouse, they are often easier and faster to implement.

Difference between data warehouse and data mart
AttributeData warehouseData mart
Scope of the dataenterprise-widedepartment-wide
Number of subject areasmultiplesingle
How difficult to builddifficulteasy
How much time takes to buildmoreless
Amount of memorylargerlimited

Types of data marts include dependent, independent, and hybrid data marts.[ clarification needed ]

Online analytical processing (OLAP) is characterized by a relatively low volume of transactions. Queries are often very complex and involve aggregations. For OLAP systems, response time is an effective measure. OLAP applications are widely used by Data Mining techniques. OLAP databases store aggregated, historical data in multi-dimensional schemas (usually star schemas). OLAP systems typically have a data latency of a few hours, as opposed to data marts, where latency is expected to be closer to one day. The OLAP approach is used to analyze multidimensional data from multiple sources and perspectives. The three basic operations in OLAP are Roll-up (Consolidation), Drill-down, and Slicing & Dicing.

Online transaction processing (OLTP) is characterized by a large number of short on-line transactions (INSERT, UPDATE, DELETE). OLTP systems emphasize very fast query processing and maintaining data integrity in multi-access environments. For OLTP systems, effectiveness is measured by the number of transactions per second. OLTP databases contain detailed and current data. The schema used to store transactional databases is the entity model (usually 3NF). [7] Normalization is the norm for data modeling techniques in this system.

Predictive analytics is about finding and quantifying hidden patterns in the data using complex mathematical models that can be used to predict future outcomes. Predictive analysis is different from OLAP in that OLAP focuses on historical data analysis and is reactive in nature, while predictive analysis focuses on the future. These systems are also used for customer relationship management (CRM).

History

The concept of data warehousing dates back to the late 1980s [8] when IBM researchers Barry Devlin and Paul Murphy developed the "business data warehouse". In essence, the data warehousing concept was intended to provide an architectural model for the flow of data from operational systems to decision support environments. The concept attempted to address the various problems associated with this flow, mainly the high costs associated with it. In the absence of a data warehousing architecture, an enormous amount of redundancy was required to support multiple decision support environments. In larger corporations, it was typical for multiple decision support environments to operate independently. Though each environment served different users, they often required much of the same stored data. The process of gathering, cleaning and integrating data from various sources, usually from long-term existing operational systems (usually referred to as legacy systems), was typically in part replicated for each environment. Moreover, the operational systems were frequently reexamined as new decision support requirements emerged. Often new requirements necessitated gathering, cleaning and integrating new data from "data marts" that was tailored for ready access by users.

Additionally, with the publication of The IRM Imperative (Wiley & Sons, 1991) by James M. Kerr, the idea of managing and putting a dollar value on an organization's data resources and then reporting that value as an asset on a balance sheet became popular. In the book, Kerr described a way to populate subject-area databases from data derived from transaction-driven systems to create a storage area where summary data could be further leveraged to inform executive decision-making. This concept served to promote further thinking of how a data warehouse could be developed and managed in a practical way within any enterprise.

Key developments in early years of data warehousing:

Information storage

Facts

A fact is a value, or measurement, which represents a fact about the managed entity or system.

Facts, as reported by the reporting entity, are said to be at raw level; e.g., in a mobile telephone system, if a BTS (base transceiver station) receives 1,000 requests for traffic channel allocation, allocates for 820, and rejects the remaining, it would report three facts or measurements to a management system:

Facts at the raw level are further aggregated to higher levels in various dimensions to extract more service or business-relevant information from it. These are called aggregates or summaries or aggregated facts.

For instance, if there are three BTS in a city, then the facts above can be aggregated from the BTS to the city level in the network dimension. For example:

Dimensional versus normalized approach for storage of data

There are three or more leading approaches to storing data in a data warehouse – the most important approaches are the dimensional approach and the normalized approach.

The dimensional approach refers to Ralph Kimball's approach in which it is stated that the data warehouse should be modeled using a Dimensional Model/star schema. The normalized approach, also called the 3NF model (Third Normal Form), refers to Bill Inmon's approach in which it is stated that the data warehouse should be modeled using an E-R model/normalized model. [22]

Dimensional approach

In a dimensional approach, transaction data is partitioned into "facts", which are generally numeric transaction data, and "dimensions", which are the reference information that gives context to the facts. For example, a sales transaction can be broken up into facts such as the number of products ordered and the total price paid for the products, and into dimensions such as order date, customer name, product number, order ship-to and bill-to locations, and salesperson responsible for receiving the order.

A key advantage of a dimensional approach is that the data warehouse is easier for the user to understand and to use. Also, the retrieval of data from the data warehouse tends to operate very quickly. [16] Dimensional structures are easy to understand for business users, because the structure is divided into measurements/facts and context/dimensions. Facts are related to the organization's business processes and operational system whereas the dimensions surrounding them contain context about the measurement (Kimball, Ralph 2008). Another advantage offered by dimensional model is that it does not involve a relational database every time. Thus, this type of modeling technique is very useful for end-user queries in data warehouse.

The model of facts and dimensions can also be understood as a data cube. [23] Where the dimensions are the categorical coordinates in a multi-dimensional cube, the fact is a value corresponding to the coordinates.

The main disadvantages of the dimensional approach are the following:

  1. To maintain the integrity of facts and dimensions, loading the data warehouse with data from different operational systems is complicated.
  2. It is difficult to modify the data warehouse structure if the organization adopting the dimensional approach changes the way in which it does business.

Normalized approach

In the normalized approach, the data in the data warehouse are stored following, to a degree, database normalization rules. Tables are grouped together by subject areas that reflect general data categories (e.g., data on customers, products, finance, etc.). The normalized structure divides data into entities, which creates several tables in a relational database. When applied in large enterprises the result is dozens of tables that are linked together by a web of joins. Furthermore, each of the created entities is converted into separate physical tables when the database is implemented (Kimball, Ralph 2008). The main advantage of this approach is that it is straightforward to add information into the database. Some disadvantages of this approach are that, because of the number of tables involved, it can be difficult for users to join data from different sources into meaningful information and to access the information without a precise understanding of the sources of data and of the data structure of the data warehouse.

Both normalized and dimensional models can be represented in entity–relationship diagrams as both contain joined relational tables. The difference between the two models is the degree of normalization (also known as Normal Forms). These approaches are not mutually exclusive, and there are other approaches. Dimensional approaches can involve normalizing data to a degree (Kimball, Ralph 2008).

In Information-Driven Business, [24] Robert Hillard proposes an approach to comparing the two approaches based on the information needs of the business problem. The technique shows that normalized models hold far more information than their dimensional equivalents (even when the same fields are used in both models) but this extra information comes at the cost of usability. The technique measures information quantity in terms of information entropy and usability in terms of the Small Worlds data transformation measure. [25]

Design methods

Bottom-up design

In the bottom-up approach, data marts are first created to provide reporting and analytical capabilities for specific business processes. These data marts can then be integrated to create a comprehensive data warehouse. The data warehouse bus architecture is primarily an implementation of "the bus", a collection of conformed dimensions and conformed facts, which are dimensions that are shared (in a specific way) between facts in two or more data marts. [26]

Top-down design

The top-down approach is designed using a normalized enterprise data model. "Atomic" data, that is, data at the greatest level of detail, are stored in the data warehouse. Dimensional data marts containing data needed for specific business processes or specific departments are created from the data warehouse. [27]

Hybrid design

Data warehouses often resemble the hub and spokes architecture. Legacy systems feeding the warehouse often include customer relationship management and enterprise resource planning, generating large amounts of data. To consolidate these various data models, and facilitate the extract transform load process, data warehouses often make use of an operational data store, the information from which is parsed into the actual data warehouse. To reduce data redundancy, larger systems often store the data in a normalized way. Data marts for specific reports can then be built on top of the data warehouse.

A hybrid (also called ensemble) data warehouse database is kept on third normal form to eliminate data redundancy. A normal relational database, however, is not efficient for business intelligence reports where dimensional modelling is prevalent. Small data marts can shop for data from the consolidated warehouse and use the filtered, specific data for the fact tables and dimensions required. The data warehouse provides a single source of information from which the data marts can read, providing a wide range of business information. The hybrid architecture allows a data warehouse to be replaced with a master data management repository where operational (not static) information could reside.

The data vault modeling components follow hub and spokes architecture. This modeling style is a hybrid design, consisting of the best practices from both third normal form and star schema. The data vault model is not a true third normal form, and breaks some of its rules, but it is a top-down architecture with a bottom up design. The data vault model is geared to be strictly a data warehouse. It is not geared to be end-user accessible, which, when built, still requires the use of a data mart or star schema-based release area for business purposes.

Characteristics

There are basic features that define the data in the data warehouse that include subject orientation, data integration, time-variant, nonvolatile data, and data granularity.

Subject-oriented

Unlike the operational systems, the data in the data warehouse revolves around the subjects of the enterprise. Subject orientation is not database normalization. Subject orientation can be really useful for decision-making. Gathering the required objects is called subject-oriented.

Integrated

The data found within the data warehouse is integrated. Since it comes from several operational systems, all inconsistencies must be removed. Consistencies include naming conventions, measurement of variables, encoding structures, physical attributes of data, and so forth.

Time-variant

While operational systems reflect current values as they support day-to-day operations, data warehouse data represents a long time horizon (up to 10 years) which means it stores mostly historical data. It is mainly meant for data mining and forecasting. (E.g. if a user is searching for a buying pattern of a specific customer, the user needs to look at data on the current and past purchases.) [28]

Nonvolatile

The data in the data warehouse is read-only, which means it cannot be updated, created, or deleted (unless there is a regulatory or statutory obligation to do so). [29]

Options

Aggregation

In the data warehouse process, data can be aggregated in data marts at different levels of abstraction. The user may start looking at the total sale units of a product in an entire region. Then the user looks at the states in that region. Finally, they may examine the individual stores in a certain state. Therefore, typically, the analysis starts at a higher level and drills down to lower levels of details. [28]

Virtualization

With data virtualization, the data used remains in its original locations and real-time access is established to allow analytics across multiple sources creating a virtual data warehouse. This can aid in resolving some technical difficulties such as compatibility problems when combining data from various platforms, lowering the risk of error caused by faulty data, and guaranteeing that the newest data is used. Furthermore, avoiding the creation of a new database containing personal information can make it easier to comply with privacy regulations. However, with data virtualization, the connection to all necessary data sources must be operational as there is no local copy of the data, which is one of the main drawbacks of the approach. [30]

Architecture

The different methods used to construct/organize a data warehouse specified by an organization are numerous. The hardware utilized, software created and data resources specifically required for the correct functionality of a data warehouse are the main components of the data warehouse architecture. All data warehouses have multiple phases in which the requirements of the organization are modified and fine-tuned. [31]

Versus operational system

Operational systems are optimized for the preservation of data integrity and speed of recording of business transactions through use of database normalization and an entity–relationship model. Operational system designers generally follow Codd's 12 rules of database normalization to ensure data integrity. Fully normalized database designs (that is, those satisfying all Codd rules) often result in information from a business transaction being stored in dozens to hundreds of tables. Relational databases are efficient at managing the relationships between these tables. The databases have very fast insert/update performance because only a small amount of data in those tables is affected each time a transaction is processed. To improve performance, older data are usually periodically purged from operational systems.

Data warehouses are optimized for analytic access patterns. Analytic access patterns generally involve selecting specific fields and rarely if ever select *, which selects all fields/columns, as is more common in operational databases. Because of these differences in access patterns, operational databases (loosely, OLTP) benefit from the use of a row-oriented DBMS whereas analytics databases (loosely, OLAP) benefit from the use of a column-oriented DBMS. Unlike operational systems which maintain a snapshot of the business, data warehouses generally maintain an infinite history which is implemented through ETL processes that periodically migrate data from the operational systems over to the data warehouse.

Evolution in organization use

These terms refer to the level of sophistication of a data warehouse:

Offline operational data warehouse
Data warehouses in this stage of evolution are updated on a regular time cycle (usually daily, weekly or monthly) from the operational systems and the data is stored in an integrated reporting-oriented database.
Offline data warehouse
Data warehouses at this stage are updated from data in the operational systems on a regular basis and the data warehouse data are stored in a data structure designed to facilitate reporting.
On-time data warehouse
Online Integrated Data Warehousing represent the real-time Data warehouses stage data in the warehouse is updated for every transaction performed on the source data
Integrated data warehouse
These data warehouses assemble data from different areas of business, so users can look up the information they need across other systems. [32]

See also

Related Research Articles

In computing, online analytical processing, or OLAP, is an approach to quickly answer multi-dimensional analytical (MDA) queries. OLAP is part of the broader category of business intelligence, which also encompasses relational databases, report writing and data mining. Typical applications of OLAP include business reporting for sales, marketing, management reporting, business process management (BPM), budgeting and forecasting, financial reporting and similar areas, with new applications emerging, such as agriculture.

<span class="mw-page-title-main">Extract, transform, load</span> Procedure in computing

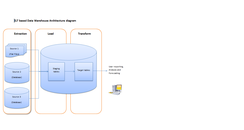
In computing, extract, transform, load (ETL) is a three-phase process where data is extracted from an input source, transformed, and loaded into an output data container. The data can be collated from one or more sources and it can also be output to one or more destinations. ETL processing is typically executed using software applications but it can also be done manually by system operators. ETL software typically automates the entire process and can be run manually or on recurring schedules either as single jobs or aggregated into a batch of jobs.

<span class="mw-page-title-main">Data mart</span> Data management pattern

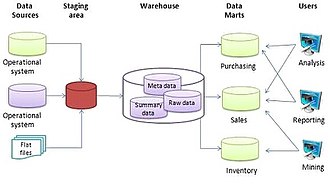
A data mart is a structure/access pattern specific to data warehouse environments, used to retrieve client-facing data. The data mart is a subset of the data warehouse and is usually oriented to a specific business line or team. Whereas data warehouses have an enterprise-wide depth, the information in data marts pertains to a single department. In some deployments, each department or business unit is considered the owner of its data mart including all the hardware, software and data. This enables each department to isolate the use, manipulation and development of their data. In other deployments where conformed dimensions are used, this business unit owner will not hold true for shared dimensions like customer, product, etc.

<span class="mw-page-title-main">Star schema</span> Data warehousing schema

In computing, the star schema or star model is the simplest style of data mart schema and is the approach most widely used to develop data warehouses and dimensional data marts. The star schema consists of one or more fact tables referencing any number of dimension tables. The star schema is an important special case of the snowflake schema, and is more effective for handling simpler queries.

<span class="mw-page-title-main">Fact table</span> Business data structure

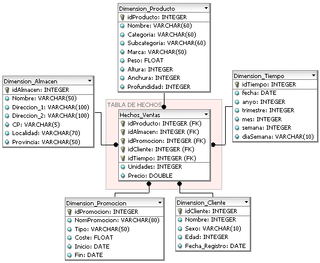
In data warehousing, a fact table consists of the measurements, metrics or facts of a business process. It is located at the center of a star schema or a snowflake schema surrounded by dimension tables. Where multiple fact tables are used, these are arranged as a fact constellation schema. A fact table typically has two types of columns: those that contain facts and those that are a foreign key to dimension tables. The primary key of a fact table is usually a composite key that is made up of all of its foreign keys. Fact tables contain the content of the data warehouse and store different types of measures like additive, non-additive, and semi-additive measures.

<span class="mw-page-title-main">Snowflake schema</span> A logical arrangement of computing tables in a multidimensional database

In computing, a snowflake schema or snowflake model is a logical arrangement of tables in a multidimensional database such that the entity relationship diagram resembles a snowflake shape. The snowflake schema is represented by centralized fact tables which are connected to multiple dimensions. "Snowflaking" is a method of normalizing the dimension tables in a star schema. When it is completely normalized along all the dimension tables, the resultant structure resembles a snowflake with the fact table in the middle. The principle behind snowflaking is normalization of the dimension tables by removing low cardinality attributes and forming separate tables.

Essbase is a multidimensional database management system (MDBMS) that provides a platform upon which to build analytic applications. Essbase began as a product from Arbor Software, which merged with Hyperion Software in 1998. Oracle Corporation acquired Hyperion Solutions Corporation in 2007. Until late 2005 IBM also marketed an OEM version of Essbase as DB2 OLAP Server.

Online transaction processing (OLTP) is a type of database system used in transaction-oriented applications, such as many operational systems. "Online" refers to that such systems are expected to respond to user requests and process them in real-time. The term is contrasted with online analytical processing (OLAP) which instead focuses on data analysis.

<span class="mw-page-title-main">Dimension (data warehouse)</span> Structure that categorizes facts and measures in a data warehouse

A dimension is a structure that categorizes facts and measures in order to enable users to answer business questions. Commonly used dimensions are people, products, place and time.

Ralph Kimball is an author on the subject of data warehousing and business intelligence. He is one of the original architects of data warehousing and is known for long-term convictions that data warehouses must be designed to be understandable and fast. His bottom-up methodology, also known as dimensional modeling or the Kimball methodology, is one of the two main data warehousing methodologies alongside Bill Inmon.

According to Ralph Kimball, in a data warehouse, a degenerate dimension is a dimension key in the fact table that does not have its own dimension table, because all the interesting attributes have been placed in analytic dimensions. The term "degenerate dimension" was originated by Ralph Kimball.

Dimensional modeling (DM) is part of the Business Dimensional Lifecycle methodology developed by Ralph Kimball which includes a set of methods, techniques and concepts for use in data warehouse design. The approach focuses on identifying the key business processes within a business and modelling and implementing these first before adding additional business processes, as a bottom-up approach. An alternative approach from Inmon advocates a top down design of the model of all the enterprise data using tools such as entity-relationship modeling (ER).

A column-oriented DBMS or columnar DBMS is a database management system (DBMS) that stores data tables by column rather than by row. Benefits include more efficient access to data when only querying a subset of columns, and more options for data compression. However, they are typically less efficient for inserting new data.

Operational database management systems, are used to update data in real-time. These types of databases allow users to do more than simply view archived data. Operational databases allow you to modify that data, doing it in real-time. OLTP databases provide transactions as main abstraction to guarantee data consistency that guarantee the so-called ACID properties. Basically, the consistency of the data is guaranteed in the case of failures and/or concurrent access to the data.

<span class="mw-page-title-main">Data vault modeling</span> Database modeling method

Datavault or data vault modeling is a database modeling method that is designed to provide long-term historical storage of data coming in from multiple operational systems. It is also a method of looking at historical data that deals with issues such as auditing, tracing of data, loading speed and resilience to change as well as emphasizing the need to trace where all the data in the database came from. This means that every row in a data vault must be accompanied by record source and load date attributes, enabling an auditor to trace values back to the source. The concept was published in 2000 by Dan Linstedt.

The enterprise bus matrix is a data warehouse planning tool and model created by Ralph Kimball, and is part of the data warehouse bus architecture. The matrix is the logical definition of one of the core concepts of Kimball’s approach to dimensional modeling conformed dimension.

The following is provided as an overview of and topical guide to databases:

<span class="mw-page-title-main">SAP HANA</span> Database management system by SAP

SAP HANA is an in-memory, column-oriented, relational database management system developed and marketed by SAP SE. Its primary function as the software running a database server is to store and retrieve data as requested by the applications. In addition, it performs advanced analytics and includes extract, transform, load (ETL) capabilities as well as an application server.

Hybrid transaction/analytical processing (HTAP) is a term created by Gartner Inc., an information technology research and advisory company, in its early 2014 research report Hybrid Transaction/Analytical Processing Will Foster Opportunities for Dramatic Business Innovation. As defined by Gartner:

Hybrid transaction/analytical processing (HTAP) is an emerging application architecture that "breaks the wall" between transaction processing and analytics. It enables more informed and "in business real time" decision making.

The functional database model is used to support analytics applications such as financial planning and performance management. The functional database model, or the functional model for short, is different from but complementary to the relational model. The functional model is also distinct from other similarly named concepts, including the DAPLEX functional database model and functional language databases.

References

  1. Dedić, Nedim; Stanier, Clare (2016). Hammoudi, Slimane; Maciaszek, Leszek; Missikoff, Michele M. Missikoff; Camp, Olivier; Cordeiro, José (eds.). An Evaluation of the Challenges of Multilingualism in Data Warehouse Development. International Conference on Enterprise Information Systems, 25–28 April 2016, Rome, Italy (PDF). Proceedings of the 18th International Conference on Enterprise Information Systems (ICEIS 2016). Vol. 1. SciTePress. pp. 196–206. doi: 10.5220/0005858401960206 . ISBN   978-989-758-187-8. Archived (PDF) from the original on 2018-05-22.
  2. "What is a Data Warehouse? | Key Concepts | Amazon Web Services". Amazon Web Services, Inc. Retrieved 2023-02-13.
  3. Patil, Preeti S.; Srikantha Rao; Suryakant B. Patil (2011). "Optimization of Data Warehousing System: Simplification in Reporting and Analysis". IJCA Proceedings on International Conference and Workshop on Emerging Trends in Technology (ICWET). 9 (6). Foundation of Computer Science: 33–37.
  4. Marakas & O'Brien 2009
  5. 1 2 3 4 5 6 Rainer, R. Kelly; Cegielski, Casey G. (2012-05-01). Introduction to Information Systems: Enabling and Transforming Business, 4th Edition (Kindle ed.). Wiley. pp.  127, 128, 130, 131, 133. ISBN   978-1118129401.
  6. "Data Mart Concepts". Oracle. 2007.
  7. "OLTP vs. OLAP". Datawarehouse4u.Info. 2009. We can divide IT systems into transactional (OLTP) and analytical (OLAP). In general, we can assume that OLTP systems provide source data to data warehouses, whereas OLAP systems help to analyze it.
  8. "The Story So Far". 2002-04-15. Archived from the original on 2008-07-08. Retrieved 2008-09-21.
  9. 1 2 Kimball 2013, pg. 15
  10. "The audit of the Data Warehouse Framework" (PDF). Archived (PDF) from the original on 2012-05-12.
  11. Kempe, Shannon (2012-08-23). "A Short History of Data Warehousing". DATAVERSITY. Retrieved 2024-05-10.
  12. "Data Warehouse – What It Is & Why It Matters". www.sas.com. Retrieved 2024-05-10.
  13. Paul Gillin (February 20, 1984). "Will Teradata revive a market?". Computer World. pp. 43, 48. Retrieved 2017-03-13.
  14. Devlin, B. A.; Murphy, P. T. (1988). "An architecture for a business and information system". IBM Systems Journal. 27: 60–80. doi:10.1147/sj.271.0060.
  15. Inmon, Bill (1992). Building the Data Warehouse. Wiley. ISBN   0-471-56960-7.
  16. 1 2 Kimball, Ralph (2011). The Data Warehouse Toolkit. Wiley. p. 237. ISBN   978-0-470-14977-5.
  17. Introduction to the focal framework
  18. Data Modeling Meetup Munich: An Introduction to Focal with Patrik Lager - YouTube
  19. Regardt, Olle; Rönnbäck, Lars; Bergholtz, Maria; Johannesson, Paul; Wohed, Petia (2009). "Anchor Modeling". Proceedings of the 28th International Conference on Conceptual Modeling. ER '09. Gramado, Brazil: Springer-Verlag: 234–250. ISBN   978-3-642-04839-5.
  20. A short intro to #datavault 2.0
  21. Data Vault 2.0 Being Announced
  22. Golfarelli, Matteo; Maio, Dario; Rizzi, Stefano (1998-06-01). "The dimensional fact model: a conceptual model for data warehouses". International Journal of Cooperative Information Systems. 07 (2n03): 215–247. doi:10.1142/S0218843098000118. ISSN   0218-8430.
  23. "Introduction to Data Cubes".
  24. Hillard, Robert (2010). Information-Driven Business. Wiley. ISBN   978-0-470-62577-4.
  25. "Information Theory & Business Intelligence Strategy - Small Worlds Data Transformation Measure - MIKE2.0, the open source methodology for Information Development". Mike2.openmethodology.org. Retrieved 2013-06-14.
  26. "The Bottom-Up Misnomer - DecisionWorks Consulting". DecisionWorks Consulting. 17 September 2003. Retrieved 2016-03-06.
  27. Gartner, Of Data Warehouses, Operational Data Stores, Data Marts and Data Outhouses, Dec 2005
  28. 1 2 Paulraj., Ponniah (2010). Data warehousing fundamentals for IT professionals. Ponniah, Paulraj. (2nd ed.). Hoboken, N.J.: John Wiley & Sons. ISBN   9780470462072. OCLC   662453070.
  29. Inmon, William H. (2005). Building the data warehouse (4th ed.). Indianapolis, IN: Wiley Pub. ISBN   9780764599446. OCLC   61762085.
  30. Paiho, Satu; Tuominen, Pekka; Rökman, Jyri; Ylikerälä, Markus; Pajula, Juha; Siikavirta, Hanne (2022). "Opportunities of collected city data for smart cities". IET Smart Cities. 4 (4): 275–291. doi: 10.1049/smc2.12044 . S2CID   253467923.
  31. Gupta, Satinder Bal; Mittal, Aditya (2009). Introduction to Database Management System. Laxmi Publications. ISBN   9788131807248.
  32. "Data Warehouse". 6 April 2019.

Further reading