Demographics of Austria

Last updated

Demographics of Austria
Austria 2023 population pyramid.svg
Population8,913,088 (2022 est.)
Growth rate0.32% (2022 est.)
Birth rate9.45 births/1,000 population (2022 est.)
Death rate9.85 deaths/1,000 population (2022 est.)
Life expectancy82.27 years
  male79.64 years
  female85.04 years
Fertility rate1.51 children
Infant mortality rate3.24 deaths/1,000 live births
Net migration rate3.55 migrant(s)/1,000 population
Nationality
NationalityAustrian
Language
OfficialGerman and others in certain provinces
Population density in Austria by district. Population density in Austria.png
Population density in Austria by district.
Historical population
YearPop.±% p.a.
17802,970,000    
17903,046,000+0.25%
18003,064,000+0.06%
18103,054,000−0.03%
18213,202,000+0.43%
18303,476,000+0.92%
18403,649,000+0.49%
18503,879,000+0.61%
18574,075,000+0.71%
18694,497,880+0.83%
18804,963,528+0.90%
18905,417,360+0.88%
19006,003,845+1.03%
19106,648,310+1.02%
19236,534,742−0.13%
19346,760,044+0.31%
19396,652,567−0.32%
19516,933,905+0.35%
19617,073,807+0.20%
19717,491,526+0.58%
19817,555,338+0.08%
19917,795,786+0.31%
20018,032,587+0.30%
20118,401,940+0.45%
20218,969,068+0.66%
Source: [1] 2019 estimate [2]

Demographic features of the population of Austria include population density, ethnicity, education level, health of the populace, economic status, religious affiliations and other aspects of the population.

Contents

Austrians were a homogeneous people, although four decades of strong immigration from other parts of Europe have significantly changed the composition of the population of Austria.

According to the 2001 population census, 88.6% are native German speakers (96% Austro-Bavarian language and 4% Alemannic language) while the remaining 11.4% speak several minority languages. The non-German speakers of Austria can be divided into two groups: traditional minorities, who are related to territories formerly part of the Habsburg monarchy, and new minorities, resulting from recent immigration.

Population

Demographic statistics according to the World Population Review. [3]

[4]

Fertility

TFR of Austria to 2016 TFR rate of Austria to 2016.svg
TFR of Austria to 2016

The total fertility rate is the number of children born per woman. It is based on fairly good data for the entire period in the present-day Hungary. Sources: Our World In Data and Gapminder Foundation. [5]

Total fertility rates in Austria 1870–1899 [5]
Year1870187118721873187418751876187718781879
Rate4.694.654.754.834.84.814.924.724.614.61
Year1880188118821883188418851886188718881889
Rate4.624.554.564.514.584.494.514.494.434.44
Year1890189118921893189418951896189718981899
Rate4.244.484.314.364.344.44.44.334.354.35
Total fertility rate

1.48 children born/woman (2018 est.) Country comparison to the world: 199th

Mother's mean age at first birth
29 years (2014 est.)

Life expectancy

Life expectancy in Austria since 1870 Life expectancy in Austria.svg
Life expectancy in Austria since 1870
Life expectancy in Austria since 1960 by gender Life expectancy by WBG -Austria -diff.png
Life expectancy in Austria since 1960 by gender
Life expectancy at birth
total population: 81.7 years. Country comparison to the world: 24th
male: 79 years
female: 84.5 years (2018 est.)

Age structure

0-14 years: 14% (male 630,739 /female 600,663)
15-24 years: 10.82% (male 484,515 /female 467,064)
25-54 years: 42.1% (male 1,851,209 /female 1,851,100)
55-64 years: 13.63% (male 595,146 /female 603,249)
65 years and over: 19.44% (male 743,174 /female 966,511) (2018 est.)
Median age
total: 44.2 years. Country comparison to the world: 12th
male: 42.9 years
female: 45.4 years (2018 est.)

Cities, urbanisation and population density

urban population: 58.3% of total population (2018)
rate of urbanization: 0.59% annual rate of change (2015–20 est.)

Vital statistics

Data according to Statistik Austria. [6] [7] .

Average population (January 1)Live birthsDeathsNatural changeCrude birth rate (per 1000)Crude death rate (per 1000)Natural change (per 1000)Crude migration change (per 1000) Total fertility rate [fn 1] Infant mortality rate (per 1000 births)Life expectancy malesLife expectancy femalesNet reproduction rate
19005,973,000187,094138,50948,58531.323.28.12.34.33
19016,035,000189,539134,23455,30531.422.29.21.44.34
19026,099,000191,926134,47957,44731.522.09.41.34.35
19036,164,000184,244133,43550,80929.921.68.22.24.13
19046,228,000187,963131,30956,65430.221.19.11.24.17
19056,292,000181,685142,67339,01228.922.76.24.13.99
19066,357,000184,477129,08455,39329.020.38.71.44.01
19076,421,000181,026132,00649,02028.220.67.62.43.89
19086,485,000184,477136,43448,04328.421.07.42.63.83
19096,550,000180,106134,15245,95427.520.57.02.83.80
19106,614,000176,588127,24349,34526.719.27.50.83.69
19116,669,000168,916132,61536,30125.319.95.42.83.50
19126,724,000170,555122,75947,79625.418.37.1-0.73.50
19136,767,000163,354124,38838,96624.118.45.8-18.73.33
19146,680,000161,692124,56037,13224.218.65.6-4.13.20
19156,690,000125,680144,259-18,57918.821.6-1.7-2.83.07
19166,660,00098,895139,324-40,42914.820.9-6.1-1.42.94
19176,610,00092,289150,346-58,05714.022.7-8.8-1.32.81
19186,543,00092,560172,573-80,01314.126.4-12.2-6.62.68
19196,420,000118,518130,658-12,14018.520.4-1.97.42.55
19206,455,000146,644122,77523,86922.719.03.73.93.14
19216,504,000151,138110,45140,68723.217.06.3-2.63.21
19226,528,000150,958113,46737,49123.117.45.7-3.43.19
19236,543,000146,88599,92446,96122.415.37.2-4.33.10
19246,562,000142,14198,05544,08621.714.96.7-3.72.99
19256,582,000135,84194,98840,85320.614.46.2-3.02.85
19266,603,000127,25098,90528,34519.315.04.3-1.32.66
19276,623,000118,66999,08019,58917.915.03.002.47
19286,643,000116,72995,95920,77017.614.43.10.12.43
19296,664,000112,04797,30014,74716.814.62.20.82.32
19306,684,000112,33090,31522,01516.813.53.3-0.22.32
19316,705,000106,32493,89512,42915.914.01.91.12.19
19326,725,000102,27793,5998,67815.213.91.31.82.10
19336,746,00096,36988,9777,39214.313.21.10.21.97
19346,755,00091,56785,6855,88213.612.70.901.87
19356,761,00088,68992,524-3,83513.113.7-0.60.21.81
19366,758,00088,26489,078-81413.113.2-0.1-0.31.80
19376,755,00086,35190,035-3,68412.813.3-0.50.21.54
19386,753,00093,81294,755-94313.914.0-0.1-14.01.92
19396,658,000137,825101,70936,11620.715.35.41.72.86
19406,705,000145,92699,47546,45121.814.86.9-3.02.70
19416,731,000135,39894,12141,27720.114.06.14.02.53
19426,799,000116,17290,51025,66217.113.33.8-1.42.37
19436,815,000122,44394,26928,17418.013.84.1-0.92.21
19446,837,000126,938109,62217,31618.616.02.5-8.92.04
19456,793,000101,369173,767-72,39814.925.6-10.741.21.88
19467,000,000111,30294,07717,22515.913.42.5-6.62.0181.4
19476,971,000128,95390,02738,92618.512.95.6-8.22.3578.3
19486,953,000123,22184,21339,00817.712.15.6-7.22.2576.2
19496,942,000113,37589,24724,12816.312.93.5-4.52.0775.2
19506,935,000107,85485,71022,14415.612.43.2-3.32.0966.1
19516,934,000102,76488,25314,51114.812.72.1-3.02.0261.3
19526,928,000103,01283,37219,64014.912.02.8-2.22.0651.9
19536,932,000102,86783,39919,46814.812.02.8-1.62.0949.9
19546,940,000103,98584,63219,35315.012.22.8-1.82.1548.3
19556,947,000108,57584,99523,58015.612.23.4-2.72.2945.6
19566,952,000115,82786,82429,00316.712.54.2-2.22.4843.3
19576,966,000118,71289,29829,41417.012.84.2-1.22.5744.2
19586,987,000119,75585,98033,77517.112.34.8-0.92.6040.7
19597,014,000124,37787,97036,40717.712.55.2-0.42.6939.8
19607,048,000125,94589,60336,34217.912.75.20.32.7037.5
19617,087,000131,56385,67345,89018.612.16.5-0.42.7932.71.29
19627,130,000133,25390,85442,39918.712.75.90.62.8032.81.30
19637,176,000134,80991,57943,23018.812.86.00.72.8231.31.31
19647,224,000133,84189,08144,76018.612.36.20.32.8029.21.30
19657,271,000129,92494,27335,65117.913.04.92.12.7128.31.26
19667,322,000128,57791,44037,13717.612.55.12.42.6628.11.24
19677,377,000127,40495,43831,96617.413.04.30.92.6226.41.23
19687,415,000126,11596,01430,10117.113.04.1-0.62.5925.51.21
19697,441,000121,37798,71522,66216.413.430.52.5025.41.17
19707,467,000112,30198,81913,48215.113.31.82.62.2925.966.573.41.07
19717,500,000108,51097,33411,17614.613.11.54.42.2026.166.673.71.03
19727,544,000104,03395,3238,71013.912.71.24.42.0925.266.974.00.98
19737,586,00098,04192,7685,27313.012.30.71.01.9423.867.574.60.91
19747,599,00097,43094,3243,10612.912.50.4-3.01.9123.567.574.70.90
19757,579,00093,75796,041-2,28412.412.7-0.3-1.41.8320.567.774.70.86
19767,566,00087,44695,140-7,69411.612.6-1.01.31.6918.268.275.10.80
19777,568,00085,59592,402-6,80711.312.2-0.90.11.6316.868.575.50.77
19787,562,00085,40294,617-9,21511.312.5-1.2-0.51.6115.068.575.70.76
19797,549,00086,38892,012-5,62411.412.2-0.70.71.6014.768.876.00.76
19807,549,00090,87292,442-1,57012.012.2-0.22.81.6514.369.076.10.78
19817,569,00093,94292,6931,24912.412.20.21.81.6712.769.376.40.80
19827,584,094 [8] 94,84091,3393,50112.512.10.5-3.11.6612.869.476.60.79
19837,564,16890,11893,041-2,92311.912.3-0.4-0.21.5611.969.576.60.74
19847,559,63589,23488,46676811.811.70.10.41.5211.470.077.20.73
19857,563,23387,44089,578-2,13811.611.8-0.30.81.4711.270.477.30.70
19867,566,73686,96487,071-10711.511.5-0.00.81.4510.370.977.70.69
19877,572,85286,50384,9071,59611.411.20.20.31.439.871.478.10.68
19887,576,31988,05283,2634,78911.611.00.61.81.458.171.978.60.69
19897,594,31588,75983,4075,35211.610.90.76.01.448.371.978.70.69
19907,644,81890,45482,9527,50211.810.81.07.61.467.872.278.90.70
19917,710,88294,62983,42811,20112.210.81.410.01.517.572.379.00.72
19927,798,89995,30283,16212,14012.210.61.49.31.517.572.579.20.72
19937,882,51995,22782,51712,71012.010.41.64.31.506.572.879.40.72
19947,928,74692,41580,68411,73111.610.21.50.41.476.373.179.70.70
19957,943,48988,66981,1717,49811.210.20.90.31.425.473.380.00.68
19967,953,06788,80980,7908,01911.210.21.00.51.455.173.780.10.69
19977,964,96684,04579,4324,61310.510.00.60.21.394.774.080.60.67
19987,971,11681,23378,3392,89410.29.80.41.01.374.974.580.80.66
19997,982,46178,13878,200-629.89.80.02.51.344.474.880.90.64
20008,002,18678,26876,7801,4889.89.60.22.11.364.875.181.10.66
20018,020,94675,45874,7676919.49.30.15.21.333.775.681.60.64
20028,063,64078,39976,1312,2689.79.40.34.21.394.375.881.70.67
20038,100,27376,94477,209-2659.59.5-0.05.21.384.075.981.50.66
20048,142,57378,96874,2924,6769.79.10.66.61.424.076.482.10.68
20058,201,35978,19075,1893,0019.59.10.46.11.413.776.682.20.68
20068,254,29877,91474,2953,6199.49.00.43.11.414.077.182.70.68
20078,282,98476,25074,6251,6259.29.00.22.81.393.877.382.80.67
20088,307,98477,75275,0832,6699.39.00.33.01.423.377.683.00.68
20098,335,00376,34477,381-1,0379.19.3-0.12.11.403.777.482.90.67
20108,351,64378,74277,1991,5439.49.20.22.61.443.877.783.20.69
20118,375,16478,10976,4791,6309.39.10.23.71.433.878.183.40.69
20128,408,12178,95279,436-4849.39.4-0.15.31.443.278.383.3
20138,451,86079,33079,526-1969.39.3-0.06.61.443.178.4583.56
20148,507,78681,72278,2523,4709.69.10.48.71.463.078.9183.74
20158,584,92684,38183,0731,3089.79.50.213.31.493.178.6383.59
20168,700,47187,67580,6697,00610.19.20.97.41.533.179.1483.95
20178,772,86587,63383,2704,36310.09.50.55.11.522.979.383.9
20188,822,26785,53583,9751,5609.79.50.23.91.482.779.384.0
20198,858,77584,95283,3861,5669.69.40.24.61.462.979.584.2
20208,901,06483,60391,599-7,9969.410.2-0.94.51.443.178.983.7
20218,932,66486,07891,962-5,8849.610.3-0.75.91.482.778.883.8
20228,978,92982,62793,332-10,7059.210.4-1.215.21.412.479.183.8
20239,104,77277,29688,744-11,4488.59.7-1.27.3
20249,159,993

Current vital statistics

[9] [10]

PeriodLive birthsDeathsNatural increase
January - September 202261,99667,136-5,140
January - September 202358,59364,893-6,300
DifferenceDecrease2.svg -3,403 (-5.49%)Decrease Positive.svg -2,243 (-3.34%)Decrease2.svg -1,160

Nationality and birthplace of mothers

[11]

In the year 2022 21.1% of all newborns had mothers with a foreign (non-Austrian) nationality and 33.4% had foreign-born mothers.

Structure of the population

Population by Sex and Age Group (Census 31.X.2011): [12]
Age GroupMaleFemaleTotal%
Total4 093 9384 308 0028 401 940100
0–4202 637192 069394 7064.70
5–9207 779198 248406 0274.83
10–14218 499208 458426 9575.08
15–19251 251237 567488 8185.82
20–24267 651260 024527 6756.28
25–29277 236275 547552 7836.58
30–34270 267268 040538 3076.41
35–39280 207284 610564 8176.72
40–44338 455336 787675 2428.04
45–49358 163352 225710 3888.46
50–54312 890313 272626 1627.45
55–59253 019264 261517 2806.16
60–64231 598249 067480 6655.72
65-69189 221213 608402 8294.79
70-74187 956222 358410 3144.88
75-79110 870151 333262 2033.12
80-8483 066135 067218 1332.60
85-8940 153101 619141 7721.69
90-9410 99735 36546 3620.55
95-991 8367 5529 3880.11
100+1879251 1120.01
Age groupMaleFemaleTotalPercent
0–14628 915598 7751 227 69014.61
15–642 840 7372 841 4005 682 13767.63
65+624 286867 8271 492 11317.76
Population Estimates by Sex and Age Group (01.I.2020): [12]
Age GroupMaleFemaleTotal%
Total4 378 7724 522 2928 901 064100
0–4224 096211 739435 8354.90
5–9219 209206 018425 2274.78
10–14216 381205 617421 9984.74
15–19225 558212 297437 8554.92
20–24266 200251 570517 7705.82
25–29308 142293 260601 4026.76
30–34309 081298 547607 6286.83
35–39307 461302 843610 3046.86
40–44283 167281 274564 4416.34
45–49308 507313 946622 4536.99
50–54356 947354 457711 4047.99
55–59342 150343 335685 4857.70
60–64275 937289 698565 6356.35
65-69213 220237 161450 3815.06
70-74179 931211 723391 6544.40
75-79165 737211 808377 5454.24
80-84102 723144 999247 7222.78
85-8951 51991 697143 2161.61
90-9419 35446 36065 7140.74
95-993 27812 92416 2020.18
100-1041679661 1330.01
105-10975259<0.01
110+011<0.01
Age groupMaleFemaleTotalPercent
0–14659 686623 3741 283 06014.41
15–642 983 1502 941 2275 924 37766.56
65+735 936957 6911 693 62719.03

Ethnic groups

Traditional ethnic minorities in Austria

Only three numerically significant traditional minority groups exist – 14,000 Carinthian Slovenes (according to the 2001 census – unofficial estimates of Slovene organisations put the number at 50,000) in Austrian Carinthia (south central Austria) and about 25,000 Croats and 20,000 Hungarians in Burgenland (on the Hungarian border). The Slovenes (also called 'Windische') form a closely knit community. Their rights as well as those of the Croats are protected by law and generally respected in practice. The present boundaries of Austria, once the center of the Habsburg monarchy that constituted the second-largest composite monarchy in Europe, were established in accordance with the Treaty of Saint-Germain-en-Laye in 1919. Some Austrians, particularly near Vienna, still have relatives in countries that made up the Monarchy, namely Croatia, Czech Republic, Slovakia, Slovenia and Hungary.

New ethnic minorities in Austria

COB data Austria.PNG

Austria does not collect data on the ethnicity or race of its citizens but does collect data on the nationality of residents currently in the country. [13]

According to the Austrian Statistical Bureau, 814,800 foreigners legally lived in Austria in mid-2006, representing 9.8% of the total population, one of the highest rates in Europe.

Of these foreign residents, 305,100 came from the former Yugoslavia and 110,800 from Turkey.

Owing to a growing naturalization rate, 330,000 people have been naturalized between 1985 and the end of 2003, representing about 4% of the 7.4 million Austrian citizens living today in the country.[ citation needed ]

Of these new citizens 110,000 came from the former Yugoslavia and 90,000 from Turkey.[ citation needed ] Considering pre-1985 naturalizations, in 2005 at least 18% (in Vienna more than 30%) of the population was either foreign or of foreign origin. Native Austrians have had stagnant demographics since World War I, and have been in absolute decline since the 1970s.[ citation needed ]

Foreign nationals within Austria in 2022 Austrian foreign nationals 2022.svg
Foreign nationals within Austria in 2022

Immigration

As of 2011, Statistik Austria official estimates have shown that 81% of residents, or 6.75 million [14] had no migration background and more than 19% or 1.6 million inhabitants [14] had at least one parent of immigrant background.[ clarification needed ] There are more than 415,000 descendants of foreign-born immigrants [14] residing in Austria, the great majority of whom have been naturalized.

According to Eurostat, there were 1.27 million foreign-born residents in Austria in 2010, corresponding to 15.2% of the total population. Of these, 764,000 (9.1%) were born outside the EU and 512,000 (6.1%) were born in another EU member state. [15]

350,000 ethnic Turks [16] (including a minority of Turkish Kurds) currently live in Austria. At about 3% of the total population, they make up the biggest single ethnic minority in Austria.

In 2018, the percentage of foreign born people was around 19% of the total population which is also the second highest foreign born proportion of all EU countries after Luxembourg.

Migration data of Austria, 2013-present

International migration
YearImmigrationEmigrationNet
migration
2013151,28096,552+54,728
2014170,11597,791+72,324
2015214,410101,343+113,067
2016174,310109,634+64,676
2017154,749110,119+44,630
2018146,856111,555+35,301
2019150,419109,806+40,613
2020136,34396,279+40,064
2021154,202101,714+52,488
2022261,937124,958+136,979
2023194,959128,330+66,629


Migration background groupsYear
2008 [17] 2010 [17] 2012 [17] 2014 [17] 2016 [17] 2018 [17] 2020 [17] 2022 [17]
Number%Number%Number%Number%Number%Number%Number%Number%
Non-migrant background6,784,30082.6%6,717,30081.5%6,739,80081.2%6,700,50079.6%6,701,10077.9%6,656,30076.7%6,628,60075.6%6,549,00073.6%
Migrant background (1st and 2nd generations)1,426,40017.4%1,528,20018.5%1,563,00018.8%1,714,60020.4%1,898,00022.1%2,022,20023.3%2,137,80024.4%2,351,80026.4%
Total8,210,700100%8,245,500100%8,302,900100%8,415,100100%8,599,200100%8,678,600100%8,766,300100%8,900,800100%

As of 2023, the most common groups of foreign residents in Austria were as follows: [18]

RankNationalityPopulation% of foreign nationals
Total1,729,820100
1 Flag of Europe.svg Flag of Germany.svg  Germany 225,01213.0
2 Flag of Europe.svg Flag of Romania.svg  Romania 147,4908.5
3Flag of Turkey.svg  Turkey 120,7067.0
4Flag of Serbia.svg  Serbia 116,1166.8
5Flag of Bosnia and Herzegovina.svg  Bosnia and Herzegovina 102,4686.0
6 Flag of Europe.svg Flag of Croatia.svg  Croatia 101,8035.8
7 Flag of Europe.svg Flag of Hungary.svg  Hungary 101,6795.8
8Flag of Syria.svg  Syria 82,1694.8
9Flag of Ukraine.svg  Ukraine 79,6154.6
10 Flag of Europe.svg Flag of Poland.svg  Poland 67,1684.0
11Flag of the Taliban.svg  Afghanistan 50,3783.0
12 Flag of Europe.svg Flag of Slovakia.svg  Slovakia 48,4772.8
13 Flag of Europe.svg Flag of Bulgaria.svg  Bulgaria 38,4692.2
14 Flag of Europe.svg Flag of Italy.svg  Italy 37,7182.2
15Flag of Russia.svg  Russia 35,5862.1
Other nationalities379,17821.9

Languages

Religion

Religion in Austria (2021) [19]

   Catholicism (55.2%)
   Eastern Orthodoxy (4.9%)
   Protestantism (3.8%)
  Other Christians (4.3%)
   No religion (22.4%)
   Islam (8.3%)
  Other religions (1.1%)

In 2001, about 74% of Austria's population were registered as Roman Catholic, [20] while about 5% considered themselves Protestants. [20] Austrian Christians, both Catholic and Protestant, [21] are obliged to pay a mandatory membership fee (calculated by income—about 1%) to their church; this payment is called "Kirchenbeitrag" ("Ecclesiastical/Church contribution"). Since the second half of the 20th century, the number of adherents and churchgoers has declined. Data for the end of 2016 from the Austrian Roman Catholic church lists 5,162,622 members, or 58.8% of the total Austrian population. Sunday church attendance was 605,828 or 7% of the total Austrian population in 2015. [22] The Lutheran church also recorded a loss of 74,421 adherents between 2001 and 2016.

About 12% of the population declared that they have no religion [20] in 2001; this share had grown to 20% by 2015. [23] Of the remaining people, around 340,000 were registered as members of various Muslim communities in 2001, mainly due to the influx from Turkey, Bosnia-Herzegovina and Kosovo. [20] The number of Muslims has doubled in 15 years to 700,000 in 2016. [24] About 680,000 are members of Eastern Orthodox Church (mostly Romanians and Serbs), about 21,000 people are active Jehovah's Witnesses [25] and about 8,100 are Jewish. [20]

An estimated 15,000 Jews or adherents of Judaism live in Austria, primarily in Vienna – a remnant of the post-World War II community after the Nazi Holocaust.

Newborn by religion

Newborn by religion of father
YearCatholicProtestantOrthodoxMuslimOther
201934.68%2.15%3.73%12.09%47.35%
201839.24%2.36%4.29%13.80%40.31%
201743.40%2.68%4.80%14.66%34.46%
201644.35%2.73%4.64%14.82%33.46%
201543.89%2.62%4.40%12.75%36.34%
Newborn by religion of mother
YearCatholicProtestantOrthodoxMuslimOther
201937.73%2.29%4.40%11.66%43.92%
201842.54%2.65%4.99%13.37%36.45%
201747.08%3.01%5.54%14.28%30.09%
201649.26%3.24%5.3%14.59%27.61%
201549.52%3.08%5.08%12.75%29.57%
  • In 2017, 41,259 out of the 87,633 newborns had a Catholic mother (father: 38,096), 12,514 Muslim mother (father: 12,851) and 2,635 had a Protestant mother (father: 2,352).
  • In 2016, 43,190 out of the 87,675 newborns had a Catholic mother (father: 38,884), 12,794 Muslim mother (father: 12,996) and 2,841 had a Protestant mother (father: 2,398).
  • In 2015, 41,783 out of the 84,381 newborns had a Catholic mother (father: 37,036), 10,760 Muslim mother (father: 10,972) and 2,595 had a Protestant mother (father: 2,212).

Notes

  1. In fertility rates, 2.1 and above is a stable population and has been marked blue, 2 and below leads to an aging population and the result is that the population decreases.

Related Research Articles

<span class="mw-page-title-main">Demographics of Antigua and Barbuda</span>

This article is a demography of the population of Antigua and Barbuda including population density, ethnicity, religious affiliations and other aspects of the population.

<span class="mw-page-title-main">Demographics of Croatia</span>

The demographic characteristics of the population of Croatia are known through censuses, normally conducted in ten-year intervals and analysed by various statistical bureaus since the 1850s. The Croatian Bureau of Statistics has performed this task since the 1990s. The latest census in Croatia was performed in autumn of 2021. According to final results published on 22 September 2022 the permanent population of Croatia at the 2021 census had reached 3.87 million. The population density is 68.7 inhabitants per square kilometre, and the overall life expectancy in Croatia at birth was 78,2 years in 2018. The population rose steadily from 2.1 million in 1857 until 1991, when it peaked at 4.7 million. Since 1991, Croatia's death rate has continuously exceeded its birth rate; the natural growth rate of the population is negative. Croatia is in the fourth stage of the demographic transition. In terms of age structure, the population is dominated by the 15 to 64 year‑old segment. The median age of the population is 43.4, and the gender ratio of the total population is 0.93 males per 1 female.

<span class="mw-page-title-main">Demographics of Germany</span>

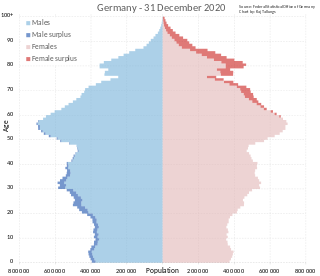
The demography of Germany is monitored by the Statistisches Bundesamt. According to the most recent data, Germany's population is 84,607,016 making it the most populous country in the European Union and the nineteenth-most populous country in the world. The total fertility rate was rated at 1.58 in 2021, significantly below the replacement rate of 2.1. For a long time Germany had one of the world's lowest fertility rates of around 1.3 to 1.4, however there has been a small increase in recent years. Due to the low birth rate Germany has recorded more deaths than births every year since 1972, which means 2021 was the 50th consecutive year the German population would have decreased without immigration. However, due to immigration the population has actually increased during the last half-century. In 2019 the number of people with a foreign background was 26%; this category includes foreigners, naturalized citizens, ethnic German repatriates from Eastern Europe and the children of all of the above.

<span class="mw-page-title-main">Demographics of Greece</span>

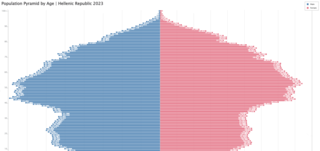
The Demographics of Greece refer to the demography of the population that inhabits the Greek peninsula. The population of Greece was estimated by the United Nations to be 10,445,365 in 2021.

<span class="mw-page-title-main">Demographics of Grenada</span>

The demography of the people of Grenada, Grenadians, includes population density, ethnicity, education level, health of the populace, economic status, religious affiliations and other aspects of the population.

<span class="mw-page-title-main">Demographics of Indonesia</span>

The population of Indonesia was 270.20 million according to the 2020 national census, an increase from 237.64 million in 2010. The official estimate as at mid 2022 was 275,773,800, increasing at a rate of 1.17% per year. Indonesia is the fourth most populous country in the world. Approximately 55% of Indonesia's population resides on Java, which is the most populous island in the world.

Demographic features of the population of Liechtenstein include population density, ethnicity, education level, health of the populace, economic status, religious affiliations and other aspects of the population.

<span class="mw-page-title-main">Demographics of Luxembourg</span>

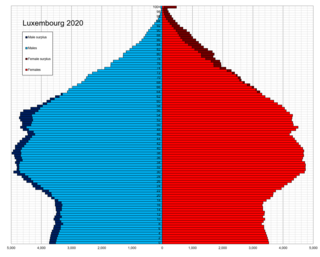
Demographic features of the population of Luxembourg include population density, education level, health of the populace, economic status, religious affiliations and other aspects of the population.

<span class="mw-page-title-main">Demographics of North Macedonia</span>

Demographic features of the population of North Macedonia include population density, ethnicity, education level, health of the populace, economic status, religious affiliations and other aspects of the population.

<span class="mw-page-title-main">Demographics of Mozambique</span>

The demographics of Mozambique describes the condition and overview of Mozambique's peoples. Demographic topics include basic education, health, and population statistics as well as identified racial and religious affiliations.

<span class="mw-page-title-main">Demographics of Romania</span>

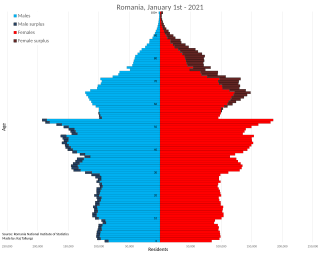
Demographic features of the population of Romania include population density, ethnicity, education level, health of the populace, economic status, religious affiliations, and other aspects of the population.

<span class="mw-page-title-main">Demographics of Slovakia</span>

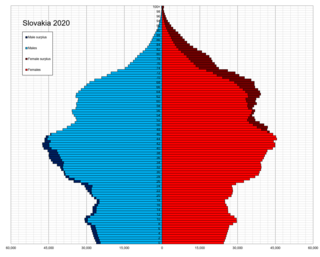
Demographic features of the population of Slovakia include population density, ethnicity, education level, health of the populace, economic status, religious affiliations and other aspects of the population. The demographic statistics are from the Statistical Office of the SR, unless otherwise indicated.

<span class="mw-page-title-main">Demographics of Switzerland</span>

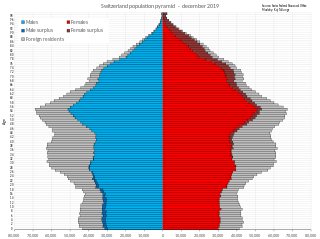
Switzerland had a population of 8.57 million as of mid-2019. Its population quadrupled over the period 1800 to 1990. Population growth was steepest in the period after World War II, it slowed during the 1970s and 1980s but has since increased to 1% during the 2000s.

<span class="mw-page-title-main">Demographics of Ukraine</span>

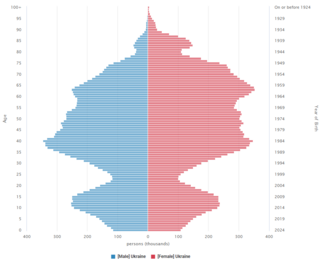
According to the United Nations, Ukraine has a population of 36,744,636 as of 2023. In July 2023, Reuters reported that due to the refugee outpouring into Western Europe, the population of Kyiv-controlled areas may have decreased to as low as 28 million. This is a steep decline from 2020, when it had a population of almost 42 million people. This is in large part due to the ongoing Ukrainian refugee crisis and loss of territory caused by Russia's invasion of Ukraine. The most recent census of a post-Soviet Ukraine occurred over 20 years ago, in 2001. Thus, much of the information presented here could be inaccurate and/or outdated.

<span class="mw-page-title-main">Demographics of Portugal</span>

Demographic features of the population of Portugal include population density, ethnicity, education level, health of the populace, economic status, religious affiliations and other aspects of the population.

<span class="mw-page-title-main">Demographics of Belgium</span>

Demographic features of the population of Belgium include ethnicity, education level, health of the populace, economic status, religious affiliations and other aspects. All figures are from the National Institute for Statistics unless otherwise indicated.

<span class="mw-page-title-main">Demographics of Benin</span>

The demographics of Benin include population density, ethnicity, education level, health of the populace, economic status, religious affiliations and other aspects of the population.

<span class="mw-page-title-main">Demographics of Bulgaria</span>

The demography of the Republic of Bulgaria is monitored by the National Statistical Institute of Bulgaria. Demographic features of the population of Bulgaria include population density, ethnicity, education level, health of the populace, economic status, religious affiliations and others.

<span class="mw-page-title-main">Religion in Austria</span>

Religion in Austria is predominantly Christianity, adhered to by 68.2% of the country's population according to the 2021 national survey conducted by Statistics Austria. Among Christians, 80.9% were Catholics, 7.2% were Orthodox Christians, 5.6% were Protestants, while the remaining 6.2% were other Christians, belonging to other denominations of the religion or not affiliated to any denomination. In the same census, 8.3% of the Austrians declared that their religion was Islam, 1.2% declared to believe in other non-Christian religions, and 22.4% declared they did not belong to any religion, denomination or religious community.

<span class="mw-page-title-main">Demographics of the European Union</span>

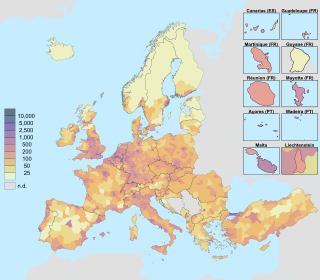
The demographics of the European Union show a highly populated, culturally diverse union of 27 member states. As of 1 January 2023, the population of the EU is around 448 million people.

References

  1. "Total Population. Population since 1869". Statistics Austria. Retrieved 7 May 2017.
  2. "Statistik Austria - Bevölkerung zu Jahresbeginn 2002-2019 nach Gemeinden (Gebietsstand 1.1.2019)". Archived from the original on 2021-10-03. Retrieved 2019-08-08.
  3. "Austria Population 2018", World Population Review
  4. Note: Crude migration change (per 1000) is a trend analysis, an extrapolation based average population change (current year minus previous) minus natural change of the current year (see table vital statistics). As average population is an estimate of the population in the middle of the year and not end of the year.
  5. 1 2 Max Roser (2014), "Total Fertility Rate around the world over the last two centuries", Our World In Data, Gapminder Foundation , archived from the original on 2018-08-07, retrieved 2018-08-07
  6. AUSTRIA, STATISTIK. "Bevölkerung". Statistik.at. Retrieved 24 August 2017.
  7. "The World FactBook – Austria", The World Factbook , July 12, 2018
  8. dataset Population at the beginning of the year since 1982, visited September 16 2023
  9. "Live births (total) by month". Eurostat. Retrieved 5 January 2024.
  10. "Deaths (total) by month". Eurostat. Retrieved 5 January 2024.
  11. "Demographisches Jahrbuch 2022" (PDF). STATISTIK AUSTRIA.
  12. 1 2 "UNSD — Demographic and Social Statistics". unstats.un.org. Retrieved 2023-05-10.
  13. Shendruk, Amanda (2021-07-08). "Are you even trying to stop racism if you don't collect data on race?". Quartz. Retrieved 2022-07-04.
  14. 1 2 3 "STATISTIK AUSTRIA Kommission für Migrations – und Integrationsforschung der Österreichischen Akademie der Wissenschaften, Wien 2012" (PDF). Medienservicestelle.at. p. 23. Archived from the original (PDF) on 2017-01-14. Retrieved 2017-08-24.
  15. 6.5% of the EU population are foreigners and 9.4% are born abroad Archived 2013-10-17 at the Wayback Machine , Eurostat, Katya VASILEVA, 34/2011.
  16. BBC (2010-11-10). "Turkey's ambassador to Austria prompts immigration spat". BBC News. Retrieved 2010-11-10.
  17. 1 2 3 4 5 6 7 8 "Bevölkerung nach Migrationshintergrund". www.statistik.at (in German). Archived from the original on 2015-11-14. Retrieved 2021-12-23.
  18. "Mehr als ein Viertel der Bevölkerung hat Wurzeln im Ausland" (PDF). statistik.at. 2023-08-24. Retrieved 2023-09-22.
  19. Official census data provided by Statistics Austria:
  20. 1 2 3 4 5 "Census 2001: Population 2001 according to religious affiliation and nationality" (PDF) (in German). Statistik Austria. Retrieved 17 December 2007.
  21. Tax is only mandatory for Lutherans and Reformed.
  22. "Katholische Kirche Österreichs, Statistik" . Retrieved 12 February 2017.
  23. Church data retrieved 14 January 2015
  24. Zahl der Muslime in Österreich seit 2001 verdoppelt diepresse.com, 04/08/2017.
  25. 2015 Yearbook of Jehovah's Witnesses. Watch Tower Society. p. 178.

Further reading