Demographics of Belarus

Last updated

Demographics of Belarus
Belarus 2023 population pyramid.svg
Population9,155,978 (2024) [1]
Fertility rateDecrease2.svg1.29 (2020)
Age structure
0–14 years16.9% (male 821,285/female 772,360)
15–64 years67.7% (male 3,053,618/female 3,314,835)
65 and over15.4% (male 479,740/female 971,608) (2019 census)
Sex ratio
Total0.87 male(s)/female (2014)
At birth1.06 male(s)/female
Under 151.06 male(s)/female
15–64 years0.94 male(s)/female
65 and over0.46 male(s)/female
Nationality
Nationalitynoun: Belarusian(s) adjective: Belarusian
Major ethnic Belarusians
Language
SpokenBelarusian, Russian
Belarus: Population and rural population 1913-2008 (beginning of year). Source: official statistics from BelStat. Bel PopRurPop1913-2008.jpg
Belarus: Population and rural population 1913–2008 (beginning of year). Source: official statistics from BelStat.
Historical population
YearPop.±% p.a.
1897 6,673,000    
1914 6,899,100+0.20%
1926 4,983,240−2.67%
1939 5,568,994+0.86%
1951 7,781,100+2.83%
1959 8,055,700+0.43%
1970 8,992,200+1.00%
1979 9,532,500+0.65%
1989 10,151,800+0.63%
1999 10,045,200−0.11%
2009 9,503,800−0.55%
2019 9,413,446−0.10%
2021 9,349,645−0.34%
Source: [2]

The demographics of Belarus is about the demographic features of the population of Belarus, including population growth, population density, ethnicity, education level, health, economic status, religious affiliations, and other aspects of the population.

Contents

Population

The population of Belarus suffered a dramatic decline during World War II, dropping from more than 9 million in 1940 to 7.7 million in 1951. It then resumed its long-term growth, rising to 10 million in 1999. [3] After that the population began a steady decline, dropping to 9.7 million in 2006–2007. [4] Originally a highly agrarian country with nearly 80% of its population in rural areas, Belarus has been undergoing a process of continuous urbanization. The rural population saw its share of the total population decrease from 70% in 1959 to less than 30% in the 2000s. [5]

Population

9,491,800 (January 2018 est.) [6]
country comparison to the world: 92 [7]

Age structure

0–14 years: 15.4% (male 759,285/female 717,118)
15–24 years: 11.7% (male 575,907/female 544,170)
25–54 years: 45.5% (male 2,141,419/female 2,227,433)
55–64 years: 13.3% (male 562,639/female 716,216)
65 years and over: 14.2% (male 430,225/female 933,646) (2014 est.)

Median age

Total: 39.4 years
Male: 36.3 years
Female: 42.4 years (2014 est.)

Sex ratio

At birth: 1.06 male(s)/female
0–14 years: 1.06 male(s)/female
15–24 years: 1.06 male(s)/female
25–54 years: 0.96 male(s)/female
55–64 years: 0.87 male(s)/female
65 years and over: 0.46 male(s)/female
Total population: 0.87 male(s)/female (2014 est.)
Population change in Belarus, 1970 – 2010 [8]
BelarusPopChange1970-1989.PNG
BelarusPopulationChange1970-2009.PNG
BelarusPopulationChange1999-2009.png
1970–1989 1970–2010 1999–2010

Life expectancy at birth

Life expectancy in Belarus since 1900 Life expectancy in Belarus.svg
Life expectancy in Belarus since 1900
Life expectancy in Belarus since 1960 by gender Life expectancy by WBG -Belarus -diff.png
Life expectancy in Belarus since 1960 by gender
Average life expectancy at birth in Belarus (2018) Average life expectancy at birth in Belarus (2018, en).png
Average life expectancy at birth in Belarus (2018)
Total population: 72.15 years
country comparison to the world: 138
Male: 66.53 years
Female: 78.1 years (2014 est.)
PeriodLife expectancy in
Years
1950–195560.71
1955–1960Increase2.svg 66.32
1960–1965Increase2.svg 69.11
1965–1970Increase2.svg 70.37
1970–1975Increase2.svg 70.51
1975–1980Decrease2.svg 70.41
1980–1985Decrease2.svg 70.14
1985–1990Increase2.svg 71.35
1990–1995Decrease2.svg 69.44
1995–2000Decrease2.svg 67.42
2000–2005Increase2.svg 67.83
2005–2010Increase2.svg 69.25
2010–2015Increase2.svg 72.15

Total fertility rate (TFR) in Belarus by region and year

Region [9] 20172016201520102005
Belarus (total)1.541.731.721.491.25
Minsk 1.061.211.241.251.08
Vitebsk Oblast 1.451.631.621.421.19
Mogilev Oblast 1.651.851.831.491.25
Gomel Oblast 1.721.931.891.551.28
Grodno Oblast 1.752.031.961.631.30
Brest Oblast 1.892.102.061.731.45
Minsk Oblast 1.942.162.181.721.37

Infant mortality rate

Total: 4.0 Decrease Positive.svg deaths/1,000 live births for 429 death. (2010)
Total: 3.9 Decrease Positive.svg deaths/1,000 live births for 422 death. (2011)
Total: 3.4 Decrease Positive.svg deaths/1,000 live births for 386 death. (2012)
Total: 3.5 Increase Negative.svg deaths/1,000 live births for 407 death. (2013)
Total: 3.5 Steady2.svg deaths/1,000 live births for 415 death. (2014)
Total: 3.5 Decrease Positive.svg deaths/1,000 live births for 321 death. (January–September 2014)
Total: 3.2 Increase2.svg deaths/1,000 live births for 283 death. (January–September 2015)

Vital statistics

For the historical figures on Belarusian provinces of the Russian Empire (Grodno, Vitebsk, Minsk, Mogilev, Vilna) with a Belarusian majority before 1917, see: [10]

YearAverage population (from 1990 onwards beginning of year)Live birthsDeathsNatural changeCrude birth rate (per 1000)Crude death rate (per 1000)Natural change (per 1000)Crude migration change (per 1000)Crude population change (per 1000)Total fertility rateAbortions reported
19507,745,000197,20062,000135,20025.58.017.5-14.52.6
19517,765,000198,20061,200137,00025.57.917.6-23.3-5.7
19527,721,000191,10064,200126,90024.88.316.4-20.4-4.0
19537,690,000176,20061,900114,30022.98.014.9-10.74.2
19547,722,000193,10061,600131,50025.08.017.0-6.410.6
19557,804,000194,40058,000136,40024.97.417.5-7.89.7
19567,880,000199,50056,000143,50025.37.118.2-11.17.1
19577,936,000200,80058,000142,80025.37.318.0-8.89.2
19588,009,000207,70053,700154,00025.96.719.2-6.312.9
19598,112,000204,60062,600142,00025.27.717.5-7.99.62.72
19608,190,000200,21854,037146,18124.46.617.8-6.311.52.69170,787
19618,284,000194,23953,682140,55723.46.517.0-4.812.22.66178,290
19628,385,000185,30260,676124,62622.17.214.9-6.38.72.57185,554
19638,458,000173,88958,291115,59820.66.913.7-6.57.22.46191,137
19648,519,000161,79453,967107,82719.06.312.7-2.410.32.36200,534
19658,607,000153,86558,15695,70917.96.811.10.811.92.27205,999
19668,709,000153,41458,26595,14917.66.710.9-0.510.42.28203,430
19678,800,000147,50161,26386,23816.87.09.8-1.18.82.26203,722
19688,877,000146,09562,35483,74116.57.09.4-0.49.02.23198,955
19698,957,000142,65265,91276,74015.97.48.60.49.02.18191,637
19709,038,000146,67668,97477,70216.27.68.6-0.48.22.30187,935
19719,112,000149,13568,51180,62416.47.58.8-1.67.22.34190,169
19729,178,000147,81371,86675,94716.17.88.3-1.07.32.36185,101
19739,245,000144,72973,92770,80215.78.07.7-0.57.22.29193,503
19749,312,000146,87673,18173,69515.87.97.9-2.05.92.24194,247
19759,367,000146,51779,70166,81615.68.57.1-1.55.52.20194,710
19769,411,000147,91282,40065,51215.78.87.0-1.55.52.16199,121
19779,463,000148,96384,56564,39815.78.96.8-0.26.62.11202,146
19789,525,000151,05386,61264,44115.99.16.80.06.82.08201,619
19799,590,000151,80090,83760,96315.89.56.40.77.12.05203,446
19809,658,000154,43295,51458,91816.09.96.11.67.72.04201,852
19819,732,000157,89993,13664,76316.29.66.70.77.42.08202,340
19829,804,000159,36493,84065,52416.39.66.70.26.92.02198,011
19839,872,000173,51097,84975,66117.69.97.7-1.06.72.09207,461
19849,938,000168,749104,27464,47517.010.56.5-0.46.12.14210,844
19859,999,000165,034105,69059,34416.610.65.90.05.92.09200,888
198610,058,000171,61197,27674,33517.19.77.4-2.15.32.10171,114
198710,111,000162,93799,92163,01616.29.96.2-2.93.32.04163,761
198810,144,000163,193102,67160,52216.110.16.0-3.32.72.03140,921
198910,171,000153,449103,47949,97015.110.24.9-3.11.82.03256,041
1990 [11] 10,188,942142,167109,58232,58514.010.83.2-3.10.11.91260,839
199110,189,753132,045114,65017,39513.011.21.7-0.90.81.81241,138
199210,198,346127,971116,67411,29712.511.41.12.53.61.76240,387
199310,234,593117,384128,544-11,16011.512.6-1.12.00.91.62217,957
199410,243,506110,599130,003-19,40410.812.7-1.9-1.3-3.21.53212,533
199510,210,403101,144133,775-32,6319.913.1-3.20-3.21.41193,280
199610,177,25895,798133,422-37,6249.413.1-3.70.2-3.51.34174,098
199710,141,88089,586136,653-47,0678.913.5-4.7-0.1-4.81.25152,660
199810,092,98692,645137,296-44,6519.213.6-4.40.2-4.21.30145,339
199910,050,94092,975142,027-49,0529.314.2-4.90.1-4.81.31135,829
200010,002,53593,691134,867-41,1769.413.5-4.1-0.5-4.61.32121,895
20019,956,68491,720140,299-48,5799.214.1-4.9-0.8-5.71.29101,402
20029,900,41488,743146,655-57,9129.014.9-5.9-1.1-7.01.2489,895
20039,830,68188,512143,200-54,6889.014.6-5.6-1.3-6.91.2380,174
20049,762,81788,943140,064-51,1219.114.4-5.3-1.6-6.91.2371,700
20059,697,47590,508141,857-51,3499.414.7-5.3-1.5-6.91.2564,655
20069,630,35496,721138,426-41,70510.114.4-4.3-1.0-5.31.3458,516
20079,579,493103,626132,993-29,36710.813.9-3.1-0.8-3.91.4346,287
20089,542,412107,876133,879-26,00311.314.1-2.7-0.3-3.01.4942,197
20099,513,557109,263135,097-25,83411.514.2-2.70.8-1.91.5135,967
20109,495,608108,050137,132-29,08211.414.5-3.10.6-2.51.4933,262
20119,472,064109,147135,090-25,94311.514.3-2.70.5-2.21.5232,031
20129,451,221115,893126,531-10,63812.313.4-1.10.2-0.91.6228,628
20139,442,450117,997125,326-7,32912.513.3-0.81.00.21.6731,206
20149,443,972118,534121,542-3,00812.512.9-0.31.31.01.7029,797
20159,453,058119,028120,026-99812.612.7-0.11.81.71.7229,217
20169,469,400117,779119,379-1,60012.412.6-0.20.20.01.7327,467
20179,469,093102,556119,311-16,75510.812.6-1.8-0.4-2.21.54
20189,448,31294,042120,053-26,01110.012.7-2.80.8-2.01.45
20199,429,25787,602120,470-32,8689.312.8-3.51.5-2.01.38
20209,410,25983,015144,536-61,6518.915.4-6.50.1-6.41.33
20219,349,64579,732173,853-94,1218.618.7-10.10.0-10.11.29
20229,255,52473,906128,813-54,9078.014.0-5.90.0-5.9
20239,155,97864,950

Current vital statistics

[12]

PeriodLive birthsDeathsNatural increase
January - March 201921,51932,229-10,710
January - March 202020,18031,039-10,859
DifferenceDecrease2.svg -1,339 (-6.22%)Decrease Positive.svg -1,190 (-3.69%)Decrease2.svg -149

Structure of the population

Population by Sex and Age Group (Census 04.X.2019): [13]
Age GroupMaleFemaleTotal%
Total4 351 4735 061 9739 413 446100
0–4270 610255 488526 0985.59
5–9288 068273 160561 2285.96
10–14259 437246 882506 3195.38
15–19234 423221 344455 7674.84
20–24228 635219 413448 0484.76
25–29305 775310 546616 3216.55
30–34388 316392 937781 2538.30
35–39367 695381 356749 0517.96
40–44325 233345 140670 3737.12
45–49302 148337 685639 8336.80
50–54289 385333 961623 3466.62
55–59319 173385 127704 3007.48
60–64292 835387 326680 1617.23
65-69202 723310 845513 5685.46
70-74123 837219 468343 3053.65
75-7967 798160 061227 8592.42
80-8455 715164 022219 7372.33
85-8921 46780 001101 4681.08
90-947 17331 58338 7560.41
95-999665 3006 2660.07
100+61328389<0.01
Age groupMaleFemaleTotalPercent
0–14818 115775 5301 593 64516.93
15–643 053 6183 314 8356 368 45367.65
65+479 740971 6081 451 34815.42

Ethnic groups

COB data Belarus.PNG
Belarusians 84.9%, Russians 7.5%, Poles 3.1%, Ukrainians 1.7%, Jews 0.1%, Armenians 0.1%, Lipka Tatars 0.1%, Ruska Roma 0.1%, Lithuanians 0.1%, Azerbaijanis 0.1%, others 2.2% (2019 census).

Prior to the Second World War

Prior to World War II, Jews were the second largest ethnic group in Belarus, and at 400,000 in the 1926 and 1939 censuses they even exceeded the number of Russians (although admittedly by a small margin). [14] Jews accounted for 7%–8% of the total population at that time, comprising more than 40% of the population in cities and towns, where Jews and Poles were the majority, while Belarusians mostly lived in rural areas.

The Poles were the fourth largest ethnic group in Byelorussian SSR (current Eastern portion of Belarus), before World War II, comprising 1–2% of the population in the pre-war censuses (less than 100,000). [14]

Population of the Byelorussian SSR according to ethnic group 1926–1939
Ethnic
group
census 19261census 19392
Number %Number %
Belarusians 4,017,30180.64,615,49682.9
Jews 407,0598.2375,0926.7
Russians 383,8067.7364,7056.6
Poles 97,4982.058,3801.1
Ukrainians 34,6810.7104,2471.9
Germans 7,0750.18,4480.2
Latvians 14,0800.38,1170.2
Tatars 3,7770.17,6640.1
Lithuanians 6,8640.14,2840.1
Roma 2,3660.13,6320.1
Mordvins 1,0510.02,0420.0
Others7,6820.216,8870.3
Total4,983,2405,568,994
1 Source: . 2 Source: Archived 2012-12-21 at archive.today .

After the Second World War

The Holocaust decimated the Jewish population in Belarus, and after World War II, in 1959, Jews accounted for only 1.9% of the population. Since then, Jewish emigration to Israel and other countries reduced the number of Jews to 0.1% of the population (13,000 in 2009).

Polish minority districts in 1960:
.mw-parser-output .legend{page-break-inside:avoid;break-inside:avoid-column}.mw-parser-output .legend-color{display:inline-block;min-width:1.25em;height:1.25em;line-height:1.25;margin:1px 0;text-align:center;border:1px solid black;background-color:transparent;color:black}.mw-parser-output .legend-text{}
Over 50% Polish
40-50%
30-40%
10-30%
Up to 10% Polish
Border of Poland in 1939 Poles in Belarus 1960.png
Polish minority districts in 1960:
  Over 50% Polish
  40-50%
  30-40%
  10-30%
  Up to 10% Polish
  Border of Poland in 1939

After the war, a large number of Poles were forced to move to Poland. In exchange, Belarusians from the former Belastok Region, which was returned to Poland in 1945, after being occupied in 1939 were displaced to Belarus. Due to changes in the western border of Belarus and Poland after World War II (see territorial changes of Poland), the number of Poles in Belarus increased to more than 500,000 according to the first post-war census (1959) and to about 400,000 according to the 1999 census. Poles are now the third largest ethnic group in Belarus (see Polish minority in Belarus). There are around 15,000 of Lipka Tatars and about 10,000 of Ruska Roma (Russian Gypsies).

In the post-war period Belarus experienced an influx of workers from other parts of the Soviet Union, for example Russians and Ukrainians. The decade after independence saw a decline in the population of most of these minority groups, either by assimilation or emigration. The most significant exception to this trend has been a continued (if small-scale) net immigration of Armenians and Azerbaijanis, whose numbers increased from less than 2,000 in 1959 to around 10,000 in 1999. [3]

Ethnic composition of Belarus according to 2019 census
Belarusians in Belarus (2019).png
Russians in Belarus (2019).png
Poles in Belarus (2019).png
Ukrainians in Belarus (2019).png
Belarusian Russians Poles Ukrainians
Ethnic composition of Belarus according to 2009 census
Belarusians in Belarus 2009.png
Russians in Belarus 2009.PNG
Poles in Belarus 2009.PNG
Ukrainians in Belarus 2009.PNG
Belarusian Russians Poles Ukrainians
Population of Belarus according to ethnic group 1959–2019
Ethnic
group
census 19591census 19702census 19793census 19894census 19995census 20096census 20197
Number %Number %Number %Number %Number %Number %Number %
Belarusians 6,532,03581.17,289,61081.07,567,95579.47,904,62377.98,158,90081.27,957,25283.77,990,71984.9
Russians 659,0938.2938,16110.41,134,11711.91,342,09913.21,141,70011.4785,0848.3706,9927.5
Poles 538,8816.7382,6004.3403,1694.2417,7204.1395,7003.9294,5493.1287,6933.1
Ukrainians 133,0611.7190,8392.1230,9852.4291,0082.9237,0002.4158,7231.7159,6561.7
Jews 150,0841.9148,0111.6135,4501.4111,9751.127,8000.312,9260.113,7050.1
Armenians 1,7510.02,3620.02,7510.04,9330.110,2000.18,5120.19,3920.1
Tatars 8,6500.19,9920.110,8510.112,4360.110,1000.17,3160.18,4450.1
Romani 4,6620.16,8430.18,4080.110,7620.19,9000.17,0790.16,8480.1
Azerbaijanis 1,4020.01,3350.02,6540.05,0090.16,3000.15,5670.16,0010.1
Lithuanians 8,3630.18,0920.16,9930.17,6060.16,4000.15,0870.15,2870.1
Others16,6660.224,4930.329,1830.343,6350.441,2000.4261,7122.8218,7082.3
Total8,054,6489,002,3389,532,51610,151,80610,045,2009,503,8079,413,446
1 Source: . 2 Source: . 3 Source: . 4 Source: . 5 Source: . 6 Source: . 7 Source: .

Languages

Belarusian and Russian are the official languages according to the Constitution of Belarus (Article 17). The constitution guarantees preservation of the cultural heritage of all ethnic minorities, including their languages (Article 15). Russian, and not Belarusian, is the dominant language in Belarus, spoken normally at home by 70% of the population (2009 census). Major cities such as Minsk and Brest are overwhelmingly Russian-speaking.

Languages of Belarus according to 2009 census (green – Belarusian, blue – Russian)
BelarusNativeLanguages2009.PNG
BelarusHomeLanguages2009.PNG
Native languages Spoken languages

Religion

According to 1997 estimates, 80% of the religious population belonged to the Eastern Orthodox Church and the others are mainly Roman Catholic, Greek Catholic, Protestants, Muslims, and Jews. [15]

Figures for 2020 state that 78% of the population have a Christian background (this includes 60% Orthodox and 10% Catholic). Of the rest, almost 22% are non-religious, with a very small number of Jews and Sunni Muslims. [16]

Urbanization

Urban population: 75% of total population (2011)
Rate of urbanization: 0.21% annual rate of change (2010–2015 est.)

See also

Related Research Articles

<span class="mw-page-title-main">Demographics of Bosnia and Herzegovina</span>

Demographic features of the population of Bosnia and Herzegovina include population density, ethnicity, education level, health of the populace, economic status, religious affiliations and other aspects of the population.

<span class="mw-page-title-main">Demographics of Botswana</span>

Demographic features of the population of Botswana include population density, ethnicity, education level, health of the populace, economic status, religious affiliations and other aspects.

<span class="mw-page-title-main">Demographics of Cambodia</span>

Demographic features of the population of Cambodia include population density, ethnicity, education level, health of the populace, economic status, religious affiliations and other aspects of the population.

<span class="mw-page-title-main">Demographics of Ethiopia</span>

The demographics of Ethiopia encompass the demographic features of inhabitants in Ethiopia, including ethnicity, languages, population density, education level, health, economic status, religious affiliations and other aspects of the population.

<span class="mw-page-title-main">Demographics of Indonesia</span>

The population of Indonesia was 270.20 million according to the 2020 national census, an increase from 237.64 million in 2010. The official estimate as at mid 2022 was 275,773,800, increasing at a rate of 1.17% per year. Indonesia is the fourth most populous country in the world. Approximately 55% of Indonesia's population resides on Java, which is the most populous island in the world.

<span class="mw-page-title-main">Demographics of Iraq</span>

The Iraqi people are people originating from the country of Iraq.

<span class="mw-page-title-main">Demographics of Kiribati</span>

Demographic features of the population of Kiribati include population density, ethnicity, education level, health of the populace, economic status, religious affiliations and other aspects of the population.

Demographic features of the population of Mayotte include population density, ethnicity, education level, health of the populace, economic status, religious affiliations and other aspects of the population. Mayotte's population density went from 179 persons per square kilometer in 1985 to 251 per square kilometer in 1991. Its capital, Dzaoudzi had a population of 5,865 according to the 1985 census; the island's largest town, Mamoudzou, had 12,026 people.

<span class="mw-page-title-main">Demographics of Morocco</span>

Demographic features of the population of Morocco include population density, ethnicity, education level, health of the populace, economic status, religious affiliations and other aspects of the population. The population of Morocco in 2021 is 37.271 million.

<span class="mw-page-title-main">Demographics of North Korea</span>

The demographics of North Korea are determined through national censuses and international estimates. The Central Bureau of Statistics of North Korea conducted the most recent census in 2008, where the population reached 24 million inhabitants. The population density is 199.54 inhabitants per square kilometre, and the 2014 estimated life expectancy is 69.81 years. In 1980, the population rose at a near consistent, but low, rate. Since 2000, North Korea's birth rate has exceeded its death rate; the natural growth is positive. In terms of age structure, the population is dominated by the 15–64-year-old segment (68.09%). The median age of the population is 32.9 years, and the gender ratio is 0.95 males to 1.00 female. Since the early 1990s, the birth rate has been fairly stable, with an average of 2 children per woman, down from an average of 3 in the early 1980s.

<span class="mw-page-title-main">Demographics of Romania</span>

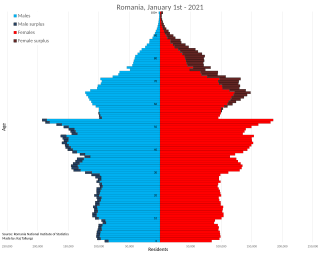
Demographic features of the population of Romania include population density, ethnicity, education level, health of the populace, economic status, religious affiliations, and other aspects of the population.

<span class="mw-page-title-main">Demographics of Samoa</span>

Demographic features of the population of Samoa include population density, ethnicity, education level, health of the populace, economic status, religious affiliations and other aspects of the population.

<span class="mw-page-title-main">Demographics of Tajikistan</span>

The Demographics of Tajikistan is about the demography of the population of Tajikistan, including population growth, population density, ethnicity, education level, health, economic status, religious affiliations, and other aspects of the population.

<span class="mw-page-title-main">Demographics of Ukraine</span>

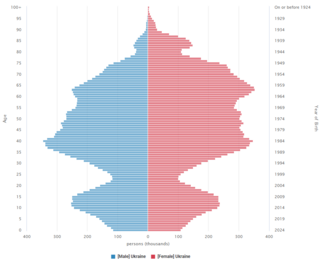
According to the United Nations, Ukraine has a population of 36,744,636 as of 2023. In July 2023, Reuters reported that due to the refugee outpouring into Western Europe, the population of Kyiv-controlled areas may have decreased to as low as 28 million. This is a steep decline from 2020, when it had a population of almost 42 million people. This is in large part due to the ongoing Ukrainian refugee crisis and loss of territory caused by Russia's invasion of Ukraine. The most recent census of a post-Soviet Ukraine occurred over 20 years ago, in 2001. Thus, much of the information presented here could be inaccurate and/or outdated.

<span class="mw-page-title-main">Demographics of Yemen</span>

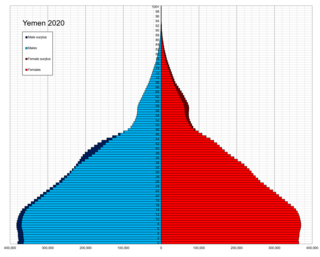
Demographic features of the population of Yemen include population density, ethnicity, education level, health of the populace, economic status, religious affiliations and other aspects of the population.

<span class="mw-page-title-main">Demographics of Fiji</span>

The demographic characteristics of the population of Fiji are known through censuses, usually conducted in ten-year intervals, and has been analysed by statistical bureaus since the 1880s. The Fijian Bureau of Statistics (FBOS) has performed this task since 1996, the first enumerated Fiji census when an independent country. The 2017 census found that the permanent population of Fiji was 884,887, compared to 837,271 in the 2007 census. The population density at the time in 2007 was 45.8 inhabitants per square kilometre, and the overall life expectancy in Fiji was 67 years. Since the 1930s the population of Fiji has increased at a rate of 1.1% per year. Since the 1950s, Fiji's birth rate has continuously exceeded its death rate. The population is dominated by the 15–64 age segment. The median age of the population was 27.9, and the gender ratio of the total population was 1.03 males per 1 female.

<span class="mw-page-title-main">Demographics of Azerbaijan</span>

This is a demography of the population of Azerbaijan including population density, ethnicity, education level, health of the populace, economic status, religious affiliations and other aspects of the population.

<span class="mw-page-title-main">Demographics of Bulgaria</span>

The demography of the Republic of Bulgaria is monitored by the National Statistical Institute of Bulgaria. Demographic features of the population of Bulgaria include population density, ethnicity, education level, health of the populace, economic status, religious affiliations and others.

<span class="mw-page-title-main">Vitebsk Region</span> Region of Belarus

Vitebsk Region or Viciebsk Region, also known as Vitebsk Oblast or Vitsyebsk Voblasts, is one of the regions of Belarus. Its administrative center is Vitebsk. It is located in the north of the country, and borders on Russia.

<span class="mw-page-title-main">Demographics of the State of Palestine</span>

Demographic features of the population of the area commonly described as Palestinian territories includes information on ethnicity, education level, health of the populace, economic status, religious affiliations and other aspects of that population.

References

  1. "Численность населения на 1 января 2024 г. и среднегодовая численность населения за 2023 год по Республике Беларусь в разрезе областей, районов, городов, поселков городского типа" (PDF). belstat.gov.by.
  2. "Belarus: historical demographical data of the whole country". Populstat. Archived from the original on 14 April 2018. Retrieved 6 July 2017.
  3. 1 2 Ethnic composition of the population Archived February 7, 2009, at the Wayback Machine , 1999 Belarus Census.
  4. Population estimates 1995–2007 Archived 2008-12-03 at the Wayback Machine , BelStat
  5. Statistical Yearbook of the Republic of Belarus 2007, BelStat, Minsk, 2007
  6. "Population on January 1, 2018 by regions of the Republic of Belarus" (in Russian). Белстат. 2018.
  7. "Belarus ranks 6th in population the CIS countries" (in Russian). БЕЛТА. 2018-07-06.
  8. "Division of Belarus". pop-stat.mashke.org.
  9. "Demographic Data". demdata.belstat.gov.by. 2016. Archived from the original on 2021-04-04. Retrieved 2018-06-23.
  10. "Статистический ежегодник Российской Империи (Издание ЦСК ) - Проект "Исторические Материалы"". istmat.info. Archived from the original on 2014-12-16. Retrieved 2014-12-24.
  11. database Belstat.gov, visited 17 December 2023
  12. "Бюллетени". www.belstat.gov.by.
  13. "UNSD — Demographic and Social Statistics". unstats.un.org. Retrieved 2023-05-10.
  14. 1 2 "Приложение Демоскопа Weekly". demoscope.ru.
  15. "The World Factbook - Central Intelligence Agency". www.cia.gov. 28 October 2022.
  16. The ARDA website, Retrieved 2023-08-01