Demographics of Samoa

Last updated
Demographics of Samoa
Samoa single age population pyramid 2020.png
Population pyramid of Samoa in 2020
Population206,179 (2022 est.)
Growth rate0.63% (2022 est.)
Birth rate19.21 births/1,000 population (2022 est.)
Death rate5.37 deaths/1,000 population (2022 est.)
Life expectancy75.19 years
  male72.28 years
  female78.25 years
Fertility rate2.42 children born/woman (2022 est.)
Infant mortality rate18 deaths/1,000 live births
Net migration rate-7.51 migrant(s)/1,000 population (2022 est.)
Age structure
0–14 years29.31%
65 and over6.18%
Nationality
NationalitySamoan
Language
OfficialSamoan, English

Demographic features of the population of Samoa include population density, ethnicity, education level, health of the populace, economic status, religious affiliations and other aspects of the population.

Contents

Vital statistics

UN estimates

The Population Department of the United Nations prepared the following estimates. Population estimates account for under numeration in population censuses. [1]

Mid-year population (thousands)Live births (thousands)Deaths (thousands)Natural change (thousands)Crude birth rate (per 1000)Crude death rate (per 1000)Natural change (per 1000) Total fertility rate (TFR) Infant mortality (per 1000 live births) Life expectancy (in years)
195087,9514,5091,5033,00650.917.033.97.39108.747.73
195189,9074,6101,5053,10551.016.634.37.44106.048.38
195291,9424,7201,5023,21851.016.234.87.49103.249.07
195393,9724,8211,4953,32650.915.835.17.52100.349.81
195495,9994,9171,4893,42850.815.435.47.5697.350.50
195598,0375,0041,4833,52150.715.035.67.5894.151.14
1956100,3015,0891,4713,61850.414.635.97.6190.951.86
1957103,0875,1921,4533,73950.214.136.17.6387.752.62
1958106,3455,2711,4633,80849.513.735.77.6584.653.32
1959109,8115,3891,4583,93149.013.235.77.6881.654.00
1960113,3355,4601,4484,01248.112.735.37.6578.754.69
1961116,8205,5451,4424,10347.312.335.07.6475.855.32
1962120,1635,6171,4494,16846.612.034.67.6573.355.89
1963123,4165,6581,4074,25145.711.434.37.6670.956.46
1964126,5825,7031,6394,06444.912.932.07.6775.253.60
1965129,7895,7071,3394,36843.810.333.57.6566.657.54
1966132,9765,7431,3254,41843.09.933.07.6364.757.92
1967135,7525,7551,2944,46142.19.532.67.6162.258.55
1968138,1545,7981,2754,52341.69.232.57.5959.959.08
1969140,4575,8451,2534,59241.38.932.47.5557.659.64
1970142,7715,8511,2324,61940.78.632.17.4655.260.18
1971145,0645,8251,2114,61439.88.331.57.3452.960.70
1972147,3325,8091,1914,61839.18.031.17.1850.761.23
1973149,5875,7891,1714,61838.47.830.67.0248.561.75
1974152,2405,7791,1534,62637.87.530.26.8546.362.25
1975155,2635,7961,1484,64837.17.429.86.6844.262.76
1976158,1365,7831,1484,63536.37.229.16.5342.263.21
1977160,3625,7421,1474,59535.57.128.46.3840.363.64
1978161,9885,7631,1354,62835.26.928.36.2338.564.00
1979163,4895,7851,1204,66535.06.828.36.0836.864.39
1980164,9055,7721,1054,66734.66.628.05.9335.264.75
1981166,1905,7641,0914,67334.36.527.85.7833.865.10
1982166,8855,7851,0804,70534.26.427.85.6632.565.42
1983166,9445,7991,0724,72734.26.327.95.5331.365.74
1984166,7795,7911,0624,72934.26.327.95.4230.266.05
1985166,5175,7861,0544,73234.26.228.05.3429.166.35
1986166,3655,7621,0464,71634.16.227.95.2928.066.62
1987166,7735,6821,0394,64333.76.227.55.1927.166.88
1988167,4525,6581,0294,62933.46.127.35.0926.267.19
1989167,8865,5991,0184,58132.96.026.94.9925.467.47
1990168,1865,5521,0144,53832.66.026.64.9324.967.66
1991168,7015,5011,0074,49432.25.926.34.8924.367.88
1992169,7995,5549844,57032.45.726.74.8923.368.39
1993171,3625,6449794,66532.65.727.04.8722.668.70
1994173,1075,7319774,75432.85.627.24.8521.868.98
1995174,9025,7769714,80532.75.527.24.8021.169.30
1996176,7135,7999684,83132.55.427.14.7420.469.59
1997178,5435,7909644,82632.25.426.84.6619.769.88
1998180,3855,7879604,82731.85.326.54.6119.170.17
1999182,2115,7679564,81131.45.226.24.5618.470.46
2000184,0085,7529534,79931.05.125.94.5117.870.75
2001185,5305,7089514,75730.55.125.44.4717.371.02
2002186,6305,6449494,69529.95.024.94.4316.971.28
2003187,4405,6119584,65329.65.124.64.4016.671.50
2004188,0735,5789674,61129.35.124.34.3816.471.70
2005188,6265,5519864,56529.15.223.94.3716.471.75
2006189,3795,5269884,53828.95.223.74.3716.272.02
2007190,4785,5471,0034,54428.95.223.64.3916.372.10
2008191,7875,6671,0134,65429.35.224.14.4716.372.16
2009193,1765,8031,1824,62129.86.123.74.5518.570.07
2010194,6725,9291,0364,89330.25.324.94.6116.372.25
2011196,3516,0331,0514,98230.55.325.24.6416.272.26
2012198,1246,0901,0735,01730.55.425.14.6116.472.17
2013199,9396,0771,0685,00930.25.324.94.5316.072.39
2014201,7576,0601,0754,98529.85.324.54.4415.872.46
2015203,5716,0311,0834,94829.45.324.14.3615.772.52
2016205,5445,9901,0954,89528.95.323.74.2715.572.54
2017207,6305,9741,1064,86828.65.323.34.1815.372.59
2018209,7015,9571,1184,83928.25.322.94.1115.172.64
2019211,9055,9461,1724,77427.95.522.44.0515.372.16
2020214,9295,9521,1434,80927.65.322.34.0014.472.77
2021218,7645,9751,1714,80427.35.321.93.9314.172.77

Births and deaths [2]

YearPopulationLive birthsDeathsNatural increaseCrude birth rateCrude death rateRate of natural increaseTFR
1961114,427
1966131,3777.3
1971146,6477.4
1976151,9836.7
1981156,349
1986157,4085.6
1991161,2984.8
2001176,7105,06529.04.4
2006180,7414,9357284,20727.34.023.34.2
2011187,8205,7038284,87530.44.426.04.7
2016195,9794,8358533,98224.74.420.33.8
2021 [3] 205,5574,05619.74.515.23.0

Structure of the population

Population by Sex and Age Group (Census 07.XI.2016): [4]
Age GroupMaleFemaleTotal%
Total100 89295 087195 979100
0–414 60113 55828 15914.37
5–913 15111 86825 01912.77
10–1411 05610 38221 43810.94
15–199 9688 98418 9529.67
20–248 1847 73515 9198.12
25–296 7006 63213 3326.80
30–346 0515 86511 9166.08
35–395 5645 23510 7995.51
40–445 3334 91910 2525.23
45–495 2404 5349 7744.99
50–544 3364 1128 4484.31
55–593 6583 3527 0103.58
60–642 6672 5585 2252.67
65-691 7021 7733 4751.77
70-741 2671 4212 6881.37
75-797461 0041 7500.89
80-843656461 0110.52
85-891633134760.24
90-94481111590.08
95-99621270.01
100+246<0.01
Age groupMaleFemaleTotalPercent
0–1438 80835 80874 61638.07
15–6457 70153 926111 62756.96
65+4 2995 2939 5924.89
unknown84601440.07
Population Estimates by Sex and Age Group (01.I.2020): [4]
Age GroupMaleFemaleTotal%
Total104 01498 493202 506100
0–415 12014 10329 22314.43
5–914 15312 44626 59913.13
10–1410 70310 27220 97510.36
15–199 6308 63318 2629.02
20–248 5718 21716 7888.29
25–296 7797 00513 7846.81
30–346 1366 07912 2146.03
35–395 4275 30910 7375.30
40–445 1184 98710 1054.99
45–495 7734 71110 4845.18
50–544 6324 5149 1464.52
55–594 1793 7167 8953.90
60–643 1993 0246 2233.07
65-691 7801 7763 5561.76
70-741 3311 4622 7931.38
75-797771 0441 8210.90
80-843506339830.49
85-891523024540.22
90-94661362020.10
95-99523280.01
100+101<0.01
Age groupMaleFemaleTotalPercent
0–1439 97636 82176 79737.92
15–6459 44456 193115 63757.10
65+4 4625 3769 8384.86
unknown1321032350.12

Fertility Rate (The Demographic Health Survey)

[5] Fertility Rate (TFR) (Wanted Fertility Rate) and CBR (Crude Birth Rate):

YearCBR (Total)TFR (Total)CBR (Urban)TFR (Urban)CBR (Rural)TFR (Rural)
200928.64.6 (3.5)28.14.1 (3.1)28.74.7 (3.6)

CIA World Factbook demographic statistics

Estimated population, fertility rate and net reproduction rate by year according to United Nations estimates Samoa Population 1950-2021 Forecast 2022-2032 UN World Population Prospects 2022.svg
Estimated population, fertility rate and net reproduction rate by year according to United Nations estimates

The following demographic statistics are from the CIA World Factbook, unless otherwise indicated. [6]

Total population

Age structure

Median age

  • Total: 23.5 years
  • Male: 23.3 years
  • Female: 23.8 years (2015 est.)

Population growth rate

Birth rate

Death rate

Net migration rate

Sex ratio

Infant mortality rate

Death rate

Life expectancy at birth

Total fertility rate

Nationality

Ethnic groups

Religions

Languages

Literacy

  • Total Population: 99%
  • Male: 99.1%
  • Female: 98.8%


Related Research Articles

<span class="mw-page-title-main">Demographics of Botswana</span> Demographics of country

Demographic features of the population of Botswana include population density, ethnicity, education level, health of the populace, economic status, religious affiliations and other aspects.

<span class="mw-page-title-main">Demographics of Burundi</span>

Demographic features of the population of Burundi include population density, ethnicity, education level, health of the populace, economic status, religious affiliations and other aspects.

<span class="mw-page-title-main">Demographics of Cameroon</span>

The demographic profile of Cameroon is complex for a country of its population. Cameroon comprises an estimated 250 distinct ethnic groups, which may be formed into five large regional-cultural divisions:

<span class="mw-page-title-main">Demographics of Cape Verde</span>

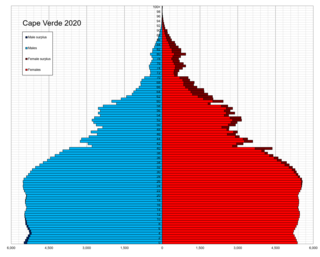
Demographic features of the population of Cape Verde include population density, ethnicity, education level, health of the populace, economic status, religious affiliations and other aspects of the population.

<span class="mw-page-title-main">Demographics of Ivory Coast</span>

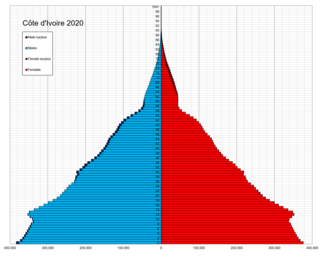
Demographic features of the population of Ivory Coast include population density, ethnicity, education level, health of the populace, economic status, religious affiliations and other aspects of the population.

<span class="mw-page-title-main">Demographics of the Democratic Republic of the Congo</span>

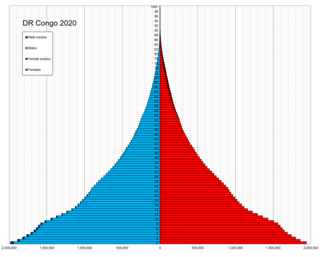
Demographic features of the population of the Democratic Republic of the Congo include ethnicity, education level, health, economic status, religious affiliations and other aspects of the population.

<span class="mw-page-title-main">Demographics of Indonesia</span>

The population of Indonesia was 270.20 million according to the 2020 national census, an increase from 237.64 million in 2010. The official estimate as at mid 2022 was 275,773,800, increasing at a rate of 1.17% per year. Indonesia is the fourth most populous country in the world. Approximately 55% of Indonesia's population resides on Java, which is the most populous island in the world.

<span class="mw-page-title-main">Demographics of Lesotho</span>

Demographic features of the population of Lesotho include population density, ethnicity, education level, health of the populace, economic status, religious affiliations and other aspects.

<span class="mw-page-title-main">Demographics of Mali</span>

Demographic features of the population of Mali include population density, ethnicity, education level, health of the populace, economic status, religious affiliations and other aspects of the population.

<span class="mw-page-title-main">Demographics of Mauritania</span>

Demographic features of the population of Mauritania include population density, ethnicity, education level, health of the populace, economic status, religious affiliations and other aspects.

<span class="mw-page-title-main">Demographics of Namibia</span>

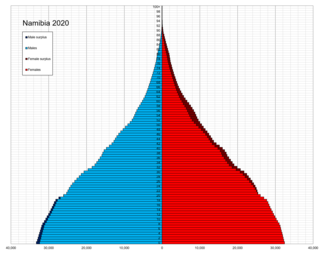
This is a demography of the population of Namibia including population density, ethnicity, education level, health of the populace, economic status, religious affiliations and other aspects of the population.

<span class="mw-page-title-main">Demographics of Niger</span>

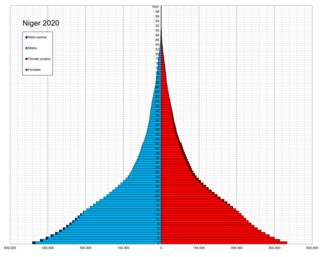
Demographic features of Nigeriens, the people of Niger, include population density, ethnicity, education level, health of the populace, economic status, religious affiliations and other aspects of the population.

<span class="mw-page-title-main">Demographics of the Republic of the Congo</span> National demographics

Demographic features of the population of the Republic of the Congo include population density, ethnicity, education level, health of the populace, economic status, religious affiliations and other aspects of the population.

<span class="mw-page-title-main">Demographics of Rwanda</span>

Demographic features of the population of Rwanda include population density, ethnicity, education higher level, health of the populace, economic status, religious affiliations and other aspects.

<span class="mw-page-title-main">Demographics of Seychelles</span>

Demographic features of the population of Seychelles include population density, ethnicity, education level, health of the populace, economic status, religious affiliations and other aspects of the population.

<span class="mw-page-title-main">Demographics of Eswatini</span>

Demographic features of the population of Eswatini include population density, ethnicity, education level, health of the populace, economic status, religious affiliations and other aspects of the population.

<span class="mw-page-title-main">Demographics of Zimbabwe</span>

Demographic features of the population of Zimbabwe include population density, ethnicity, education level, health of the populace, economic status, religious affiliations and other aspects of the population.

<span class="mw-page-title-main">Demographics of Zambia</span>

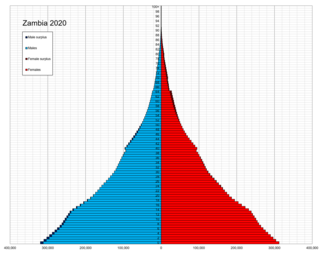
Demographic features of the population of Zambia include population density, ethnicity, education level, health of the populace, economic status, religious affiliations and others aspects of the population.

<span class="mw-page-title-main">Demographics of Uganda</span> Aspect of human geography in Uganda

Demographic features of the population of Uganda include population density, ethnicity, education level, health of the populace, economic status, religious affiliations and others.

<span class="mw-page-title-main">Demographics of the Gambia</span> Demographics of the West African country

The demographic characteristics of the population of The Gambia are known through national censuses, conducted in ten-year intervals and analyzed by The Gambian Bureau of Statistics (GBOS) since 1963. The latest census was conducted in 2013. The population of The Gambia at the 2013 census was 1.8 million. The population density is 176.1 per square kilometer, and the overall life expectancy in The Gambia is 64.1 years. Since the first census of 1963, the population of The Gambia has increased every ten years by an average of 43.2 percent. Since 1950s, the birth rate has constantly exceeded the death rate; the natural growth rate is positive. The Gambia is in the second stage of demographic transition. In terms of age structure, The Gambia is dominated by 15- to 24-year-old segment (57.6%). The median age of the population is 19.9 years, and the gender ratio of the total population is 0.98 males per female.

References

  1. United Nations Department of Economic and Social Affairs Population Division (2022). "World Population Prospects 2022 Demographic indicators by region, subregion and country, annually for 1950-2100" (XLS (91MB)). United Nations Population Division . 27 (Online ed.). New York: United Nations Department of Economic and Social Affairs, Population Division. rows 20237:20308,cols M,X,AE,S,AH,S,AA,AV,AI. Archived from the original on 2022-08-09.
  2. "2. Population and Demography". Archived from the original on 2021-09-08. Retrieved 2020-11-11.
  3. "Samoa Population and Housing Census (PHC) 2021" (PDF). Archived from the original (PDF) on 2024-03-20. Retrieved 2024-03-20.
  4. 1 2 "UNSD — Demographic and Social Statistics". unstats.un.org. Retrieved 2023-05-10.
  5. "Quality information to plan, monitor and improve population, health, and nutrition programs". The DHS Program. 2015-08-14. Retrieved 2016-09-24.
  6. "Australia-Oceania ::Samoa". CIA The World Factbook. 21 April 2022.