Demographics of Solomon Islands

Last updated

Demographics of Solomon Islands
Solomon Islands single age population pyramid 2020.png
Population pyramid of the Solomon Islands in 2020
Population702,694 (2022 est.)
Growth rate1.72% (2022 est.)
Birth rate22.71 births/1,000 population (2022 est.)
Death rate3.96 deaths/1,000 population (2022 est.)
Net migration rate-1.55 migrant(s)/1,000 population (2022 est.)
Age structure
0–14 years32.99%
65 and over4.51%
Nationality
NationalitySolomon Islander
Major ethnicMelanesian (95.3%)
Population, fertility rate and net reproduction rate, United Nations estimates Solomon Islands Population 1950-2021 Forecast 2022-2032 UN World Population Prospects 2022.svg
Population, fertility rate and net reproduction rate, United Nations estimates

Demographic features of the population of Solomon Islands include population density, ethnicity, education level, health of the populace, economic status, religious affiliations and other aspects.

Contents

The Solomon Islanders comprise diverse cultures, languages, and customs. Of its population [1] 94.5% are Melanesian, 3% Polynesian, and 1.2% Micronesian. [2] In addition, small numbers of Europeans and Chinese are registered. About 120 vernaculars are spoken.

Most people reside in small, widely dispersed settlements along the coasts. Sixty per cent live in localities with fewer than 200 persons, and only 10% reside in urban areas.

The capital city of Honiara is situated on Guadalcanal, the largest island. The other principal towns are Gizo, Auki, and Kirakira.

Most Solomon Islanders are Christian, with the Anglican, Methodist, Roman Catholic, South Seas Evangelical, and Seventh-day Adventist faiths predominating. About 5% of the population maintain traditional beliefs.

The chief characteristics of the traditional Melanesian social structure are:

Most Solomon Islanders maintain this traditional social structure and find their roots in village life.

Vital statistics

Births and deaths [3] [4]

Mid-year population (thousands)Live births (thousands)Deaths (thousands)Natural change (thousands)Crude birth rate (per 1000)Crude death rate (per 1000)Natural change (per 1000) Total fertility rate (TFR) Infant mortality (per 1000 live births) Life expectancy (in years)
1950105,2094,3652,6061,75941.524.816.77.00166.440.03
1951107,1194,5192,5361,98342.223.718.57.02163.840.53
1952109,3094,6822,5052,17742.922.919.97.04158.741.29
1953111,7604,8162,4722,34443.122.121.07.01153.742.08
1954114,4484,9682,4552,51343.521.522.07.00148.742.79
1955117,3145,1192,4322,68743.720.822.96.99143.843.58
1956120,2885,2662,6432,62343.922.021.86.97144.541.87
1957123,3735,4152,3663,04943.919.224.76.95132.945.28
1958126,6495,6022,3383,26444.318.525.86.98127.946.12
1959130,0715,7742,3153,45944.417.826.66.97123.046.91
1960133,4405,9482,2823,66644.517.127.46.97118.347.74
1961136,7806,0852,2913,79444.416.727.76.97113.648.43
1962140,2546,2252,2833,94244.316.328.16.97109.149.25
1963143,8636,3572,2744,08344.115.828.36.97104.650.05
1964147,6096,4952,2604,23543.915.328.66.96100.350.86
1965151,4956,6242,2464,37843.714.828.96.9596.051.66
1966155,5146,7592,2294,53043.414.329.16.9491.752.46
1967159,6676,9012,2164,68543.213.929.36.9487.553.21
1968163,9737,0232,1724,85142.813.229.56.9282.654.24
1969168,3997,2242,1415,08342.812.730.16.9778.055.16
1970172,8337,4262,1215,30542.812.230.67.0073.356.07
1971177,2647,6042,1165,48842.811.930.97.0368.956.98
1972181,8767,7842,0695,71542.711.331.37.0664.657.80
1973186,8167,9952,0275,96842.710.831.97.0960.758.59
1974192,1558,2341,9916,24342.810.332.47.1357.059.36
1975197,8538,3952,1616,23442.410.931.57.0756.258.08
1976204,0828,5911,9196,67242.19.432.77.0250.660.75
1977210,9328,8241,9376,88741.89.232.76.9548.360.86
1978218,1939,0611,8687,19341.58.633.06.8745.361.91
1979225,7869,3031,8647,43941.28.333.06.7843.362.39
1980233,6689,5631,8697,69440.98.032.96.7141.462.80
1981241,8279,8171,8817,93640.67.832.86.6139.863.16
1982250,25010,0841,8968,18840.37.632.76.5238.463.51
1983258,94510,3691,9248,44540.17.432.66.4237.163.76
1984267,91310,6601,9558,70539.87.332.56.3136.064.00
1985277,15810,9691,9818,98839.67.232.46.2235.064.29
1986286,52711,2802,1219,15939.47.432.06.1135.363.76
1987295,83611,5362,0399,49739.06.932.15.9933.264.76
1988305,13211,8182,0639,75538.76.831.95.8832.564.97
1989314,56012,0912,0939,99838.46.631.75.7831.765.19
1990324,17112,3532,12510,22838.16.531.55.6631.065.39
1991333,95212,6152,16010,45537.76.531.35.5530.365.58
1992343,91612,8982,19710,70137.56.431.15.4529.565.77
1993354,08613,2482,23711,01137.46.331.15.3828.865.96
1994364,50513,6222,27211,35037.36.231.15.3128.166.19
1995375,18913,9882,31511,67337.26.231.15.2427.566.38
1996386,06914,2092,35411,85536.86.130.75.1226.966.59
1997397,05014,3912,40211,98936.26.030.24.9926.566.74
1998408,14514,6862,44912,23735.96.029.94.9026.166.92
1999419,22914,9672,50212,46535.66.029.74.8225.767.07
2000429,97815,2072,56012,64735.35.929.34.7625.367.23
2001440,39515,4572,61512,84235.05.929.14.6925.167.36
2002450,76015,6722,66713,00534.75.928.84.6324.867.52
2003461,21615,9142,72213,19234.45.928.54.5724.667.64
2004471,78516,1462,77013,37634.15.928.34.5224.467.80
2005482,48616,4002,82113,57933.95.828.14.4824.267.94
2006493,43016,8342,87013,96434.05.828.24.4823.968.09
2007504,61917,1232,96814,15533.85.928.04.4423.867.99
2008516,00117,4242,95814,46633.75.727.94.4123.068.40
2009527,83317,7633,02414,73933.65.727.84.3922.968.47
2010540,39418,2233,04115,18233.65.628.04.4022.068.73
2011553,72118,6613,07615,58533.65.528.14.4121.468.91
2012567,76319,1223,11016,01233.65.528.24.4120.869.08
2013582,36519,5923,16216,43033.65.428.24.4220.369.19
2014597,37520,0313,23516,79633.55.428.14.4220.469.23
2015612,66020,2033,22716,97632.95.327.74.3619.169.58
2016628,10220,3653,25517,11032.45.227.24.2918.569.80
2017643,63420,4583,29317,16531.75.126.64.2218.069.99
2018659,24920,6083,33517,27331.25.126.24.1617.470.17
2019674,99320,7913,37217,41930.85.025.84.1016.970.38
2020691,19120,9043,51517,38930.25.125.14.0416.570.20
2021707,85121,0983,56117,53729.85.024.83.9815.870.35

Structure of the population

Population by Sex and Age Group (Census 22.XI.2009): [5]
Age GroupMaleFemaleTotal%
Total264 455251 415515 870100
0–439 72836 49976 22714.78
5–936 97434 15271 12613.79
10–1432 56229 36961 93112.01
15–1926 18925 02351 2129.93
20–2422 39923 02045 4198.80
25–2920 79421 88042 6748.27
30–3418 80718 78537 5927.29
35–3917 01016 14133 1516.43
40–4412 07011 56823 6384.58
45–4910 1899 52419 7133.82
50–547 4986 84114 3392.78
55–596 1115 67611 7872.28
60–644 5354 3818 9161.73
65-693 6933 3287 0211.36
70-742 4022 2964 6980.91
75-791 7841 5903 3740.65
80-848007251 5250.30
85-895123828940.17
90-941701313010.06
95+2281043320.06
Age groupMaleFemaleTotalPer cent
0–14109 264100 020209 28440.57
15–64145 602142 839288 44155.91
65+9 5898 55618 1453.52
Population Estimates by Sex and Age Group (01.VII.2021) (Projections based on adjusted 2009 census counts.): [5]
Age GroupMaleFemaleTotal%
Total360 961346 523707 484100
0–442 81440 01382 82611.71
5–942 22739 81482 04111.60
10–1441 68239 52581 20611.48
15–1939 81637 59377 40910.94
20–2434 05231 98066 0329.33
25–2928 30426 54054 8437.75
30–3425 92624 33550 2617.10
35–3923 40122 34045 7406.47
40–4419 81019 95139 7605.62
45–4917 19617 74934 9454.94
50–5413 46013 62827 0883.83
55–5910 28010 32820 6082.91
60–647 6377 60115 2382.15
65-695 5885 65611 2431.59
70-743 9054 2628 1671.15
75-792 5962 8005 3960.76
80+2 2692 4114 6790.66
Age groupMaleFemaleTotalPer cent
0–14126 723119 352246 07534.78
15–64219 880212 042431 92261.05
65+14 35815 12929 4874.17

The World Factbook demographic statistics

The following demographic statistics are from The World Factbook, unless otherwise indicated. [6]

Demographics of Solomon Islands, Data of FAO, year 2005; Number of inhabitants in thousands. Solomon Islands Demo.png
Demographics of Solomon Islands, Data of FAO, year 2005; Number of inhabitants in thousands.

Population

Age structure

Population growth rate

Birth rate

Death rate

Net migration rate

Urbanisation

Sex ratio

Maternal mortality rate

Life expectancy at birth

Total fertility rate

Health expenditure

Physicians density

Hospital bed density

Nationality

Ethnic groups

Religions

Languages

Literacy

Related Research Articles

<span class="mw-page-title-main">Demographics of American Samoa</span> Demographics of the territory

Demographics of American Samoa include population density, ethnicity, education level, health of the populace, economic status, religious affiliations and other aspects. American Samoa is an unincorporated territory of the United States located in the South Pacific Ocean.

<span class="mw-page-title-main">Demographics of Cape Verde</span>

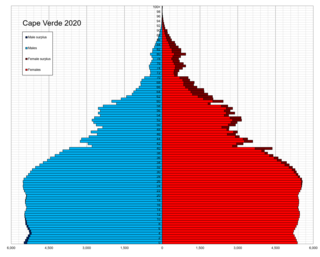
Demographic features of the population of Cape Verde include population density, ethnicity, education level, health of the populace, economic status, religious affiliations and other aspects of the population.

Demographic features of the population of the Cook Islands include population density, ethnicity, education level, health of the populace, economic status, religious affiliations and other aspects of the population.

This is a demography of the population of Dominica including population density, ethnicity, religious affiliations and other aspects of the population.

Demographic features of the population of French Polynesia include population density, ethnicity, education level, health of the populace, economic status, religious affiliations and other aspects.

<span class="mw-page-title-main">Demographics of the Federated States of Micronesia</span>

Demographic features of the population of the Federated States of Micronesia include population density, ethnicity, education level, health of the populace, economic status, religious affiliations and other aspects. The indigenous population of the Federated States of Micronesia, which is predominantly Micronesian, consists of various ethnolinguistic groups. English has become the common language. Population growth remains high at more than 3%, but is ameliorated somewhat by net emigration.

<span class="mw-page-title-main">Demographics of Grenada</span> National demographics

The demography of the people of Grenada, Grenadians, includes population density, ethnicity, education level, health of the populace, economic status, religious affiliations and other aspects of the population.

<span class="mw-page-title-main">Demographics of Jamaica</span>

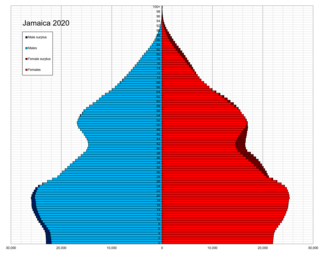
Jamaica is an island country in the Caribbean. The country had a population of 2,825,352 in 2023, the fourth largest in the region.

<span class="mw-page-title-main">Demographics of Kiribati</span>

Demographic features of the population of Kiribati include population density, ethnicity, education level, health of the populace, economic status, religious affiliations and other aspects of the population.

The demographics of the Marshall Islands include data such as population density, ethnicity, health of the populace, economic status, religious affiliations and other aspects of the population.

<span class="mw-page-title-main">Demographics of New Caledonia</span>

Demographic features of the population of New Caledonia include population density, ethnicity, education level, health of the populace, economic status, religious affiliations and other aspects of the population.

<span class="mw-page-title-main">Demographics of the Northern Mariana Islands</span>

Demographic features of the population of the Northern Mariana Islands include population density, ethnicity, education level, health of the populace, economic status, religious affiliations and other aspects.

<span class="mw-page-title-main">Demographics of Palau</span>

Demographic features of the population of Palau include population density, ethnicity, education level, health of the populace, economic status, religious affiliations and other aspects.

<span class="mw-page-title-main">Demographics of Papua New Guinea</span>

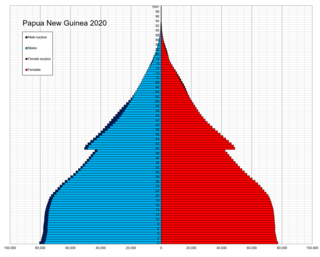
The indigenous population of Papua New Guinea is one of the most heterogeneous in the world. Papua New Guinea has several thousand separate communities, most with only a few hundred people. Divided by language, customs, and tradition, some of these communities have engaged in endemic warfare with their neighbors for centuries. It is the second most populous nation in Oceania, with a total population estimated variously as being between 9.5 and 10.1 million inhabitants.

<span class="mw-page-title-main">Demographics of Samoa</span> Demographics of country

Demographic features of the population of Samoa include population density, ethnicity, education level, health of the populace, economic status, religious affiliations and other aspects of the population.

<span class="mw-page-title-main">Demographics of São Tomé and Príncipe</span>

Demographic features of the population of São Tomé and Príncipe include population density, ethnicity, education level, health of the populace, economic status, religious affiliations and other aspects.

<span class="mw-page-title-main">Demographics of Seychelles</span>

Demographic features of the population of Seychelles include population density, ethnicity, education level, health of the populace, economic status, religious affiliations and other aspects of the population.

<span class="mw-page-title-main">Demographics of Tuvalu</span>

Demographic features of the population of Tuvalu include the age structure, ethnicity, education level, life expectancy, religious affiliations and other aspects of the population.

Demographic features of the population of Wallis and Futuna include population density, ethnicity, education level, health of the populace, economic status, religious affiliations and other aspects.

<span class="mw-page-title-main">Demographics of Fiji</span>

The demographic characteristics of the population of Fiji are known through censuses, usually conducted in ten-year intervals, and has been analysed by statistical bureaus since the 1880s. The Fijian Bureau of Statistics (FBOS) has performed this task since 1996, the first enumerated Fiji census when an independent country. The 2017 census found that the permanent population of Fiji was 884,887, compared to 837,271 in the 2007 census. The population density at the time in 2007 was 45.8 inhabitants per square kilometre, and the overall life expectancy in Fiji was 67 years. Since the 1930s the population of Fiji has increased at a rate of 1.1% per year. Since the 1950s, Fiji's birth rate has continuously exceeded its death rate. The population is dominated by the 15–64 age segment. The median age of the population was 27.9, and the gender ratio of the total population was 1.03 males per 1 female.

References

  1. "Auswärtiges Amt".
  2. CIA World Factbook. Country profile: Solomon Islands URL Accessed 2007-05-19
  3. "Census - Solomon Islands National Statistics Office".
  4. "Population & Demography Data Explorer". Our World in Data. Retrieved 22 July 2022.
  5. 1 2 "UNSD — Demographic and Social Statistics". unstats.un.org. Retrieved 10 May 2023.
  6. "Australia-Oceania :: SOLOMON ISLANDS". CIA The World Factbook. 16 May 2022.