Demographics of Tunisia

Last updated

Demographics of Tunisia
Tunisia single age population pyramid 2020.png
Population pyramid of Tunisia in 2020
Population11,896,972 (2022 est.) [1]
Growth rate0.69% (2022 est.)
Birth rate14.62 births/1,000 population (2022 est.)
Death rate6.36 deaths/1,000 population (2022 est.)
Life expectancy76.82 years
  male75.14 years
  female78.6 years (2022 est.)
Fertility rate2.11 children born/woman (2022 est.)
Infant mortality rate11.87 deaths/1,000 live births
Net migration rate-1.33 migrant(s)/1,000 population (2022 est.)
Age structure
0–14 years25.28%
65 and over8.86%
Sex ratio
Total0.98 male(s)/female (2022 est.)
At birth1.06 male(s)/female
Under 151.07 male(s)/female
65 and over0.78 male(s)/female
Nationality
Nationality Tunisian
Major ethnic Arabs (98%) [2]
Minor ethnic Berbers (1%), [3] [4] Others (1%)
Language
Official Arabic
Tunisia's population (0 to 2021). Historical Population of Tunisia.svg
Tunisia's population (0 to 2021).

Tunisia's population was estimated to be around 12.04 million in 2022. [5] In the generally youthful African continent, Tunisia's population is among the most mature. This is because the government has supported a successful family planning program that has reduced the population growth rate to just over 1% per annum, contributing to Tunisia's economic and social stability. [6]

Contents

The population of Tunisia is made up of Arabs (98%), [2] Berbers (1%), [3] [4] and others (1%). Around 98 percent of the population are Muslim. [7] There is a Jewish population on the southern island of Djerba and in Tunis. There also exists a small autochthonous group of Christian adherents. [8]

Population History

Historical population
YearPop.±%
0 800,000    
500 850,000+6.2%
1000 1,000,000+17.6%
1500 800,000−20.0%
1700 800,000+0.0%
1900 1,880,000+135.0%
1960 4,220,701+124.5%
1970 5,127,000+21.5%
1980 6,384,000+24.5%
1990 8,154,400+27.7%
2000 9,563,500+17.3%
2010 10,547,000+10.3%
2020 11,818,619+12.1%

Source: National Institute of Statistics [9] and United Nations Statistics Division [10]

Vital statistics

Average populationLive birthsDeathsNatural changeCrude birth rate (per 1,000)Crude death rate (per 1,000)Natural change (per 1,000)Population growth (annual %)Fertility rates
19483,425,100111,08449,91761,16732.414.617.8
19493,489,400 92,439 35,40957,03026.510.116.41.877
19503,530,000106,23533,64872,58730.19.520.61.164
19513,596,000119,98133,93586,04633.49.424.01.870
19523,662,000105,46930,67674,79328.88.420.41.835
19533,727,000116,63831,11685,52231.38.323.01.7756.90
19543,793,000119,77431,24988,52531.68.223.41.771
19553,860,000134,48928,942105,54734.87.527.31.766
19563,929,000140,50533,367107,13835.88.527.31.788
19573,999,000157,74136,964120,77739.49.230.21.782
19584,072,000181,14437,018144,12644.59.135.41.8257.00
19594,145,000184,20941,737142,47244.410.134.31.793
19604,220,701182,22142,064140,15743.210.033.21.826
19614,297,000184,39645,437138,95942.910.632.31.808
19624,376,000181,86149,200132,66141.611.230.41.838
19634,457,000187,39545,415141,98042.010.231.81.8517.21
19644,541,000206,04643,656162,39045.49.635.81.885
19654,630,000193,22051,700141,52041.711.230.21.960
19664,716,000206,71748,307158,41043.810.233.61.8577.22
19674,819,000187,32049,387137,93338.910.228.72.184
19684,920,000188,19046,712141,47838.39.528.82.0966.86
19695,027,500194,94052,872142,06838.810.528.32.185
19705,126,500186,36045,560140,80036.48.927.51.9696.09
19715,228,400183,31148,625134,68635.19.325.81.9886.00
19725,331,800199,12139,488159,63337.37.429.91.978
19735,333,400194,81060,800134,01036.511.425.10.0306.18
19745,463,700194,60054,700139,90035.610.025.62.443
19755,611,400205,39041,172164,21836.67.329.32.703
19765,774,900208,04037,028171,01236.06.429.62.914
19775,928,300220,54636,272184,27437.26.131.12.656
19786,067,100207,34234,885172,45734.25.728.52.3415.14
19796,219,800218,16137,201180,96035.16.029.12.5174.92
19806,392,300225,16536,445188,72035.25.729.52.7734.51
19816,565,500226,42536,989189,43634.55.628.92.710
19826,703,600219,39336,069183,32432.75.427.32.103
19836,839,500216,36535,054181,31131.65.126.52.0274.88
19847,033,900227,05233,740193,31232.34.827.52.8424.66
19857,261,100227,18835,963191,22531.35.026.33.2304.42
19867,464,900234,73635,467199,26931.44.826.62.8074.39
19877,639,000224,16935,632188,53729.34.724.62.3324.07
19887,769,900215,06934,984180,08527.74.523.21.7143.78
19897,909,600199,45934,921164,53825.24.420.81.7983.36
19908,154,400205,31545,700159,61525.25.619.63.0953.35
19918,318,200207,45546,500160,95524.95.619.32.0093.28
19928,489,900211,64946,300165,34924.95.519.52.0643.25
19938,657,400207,78649,400158,38624.05.718.31.9733.09
19948,815,300200,22350,300149,92322.75.717.01.8242.90
19958,957,500186,41652,000134,41620.85.815.01.6132.67
19969,089,300178,80149,800129,00119.75.514.21.4712.51
19979,214,900173,75751,700122,05718.95.613.21.3822.38
19989,333,300166,71852,300114,81817.95.612.31.2852.23
19999,455,900160,16954,400105,76916.95.711.21.3142.09
20009,552,500163,08953,700109,38917.15.611.41.0222.08
20019,650,600163,30053,200110,10016.95.611.41.0272.05
20029,748,900163,01156,870106,14116.75.810.81.0192.00
20039,839,841168,02259,781108,24117.16.111.00.9332.06
20049,932,431166,55159,269107,28216.86.010.80.9412.02
200510,029,100170,99958,673112,32617.15.911.20.9732.04
200610,127,900173,39057,000116,39017.15.611.50.9852.03
200710,225,200177,50356,741120,76217.45.511.80.9612.04
200810,328,700182,99059,975123,01517.75.811.91.0122.06
200910,458,095184,28259,499124,78317.75.712.01.2532.05
201010,565,704196,03960,438135,60118.65.712.91.0292.13
201110,674,420201,12063,258137,86218.85.912.91.0292.15
201210,784,255217,73863,257154,48120.25.914.31.0292.38
201310,895,219222,96261,730161,23220.55.714.81.0292.40
201411,012,486225,88762,785163,10220.55.714.81.0762.42
201511,162,666222,53069,644152,88619.96.213.71.3642.37
201611,304,483219,01366,298152,71519.45.913.51.2702.40
201711,434,994208,08174,002134,07918.26.511.71.1552.29
201811,532,078202,69472,716129,97817.56.311.20.8492.23
201911,638,066195,82276,091119,73116.86.510.30.9192.17
202011,726,178174,11679,89194,22514.86.88.00.7571.96
202111,783,722160,268107,00653,26213.69.14.50.4911.82
202211,826,900147,24277,29269,95012.46.55.90.3661.57(e)

Current vital statistics

[11]

PeriodLive birthsDeathsNatural increase
January - November 2022136,11370,401+65,712
January - November 2023123,84065,525+58,315
DifferenceDecrease2.svg -12,273 (-9.02%)Decrease Positive.svg -4,876 (-6.93%)Decrease2.svg -7,397

Regional data

Demographic of different governorates
RanggovernoratePopulation (2023)Density (2014)
(hab./km)
1 Tunis 1,078,4123,053
2 Sfax 1,028,364127
3 Nabeul 873,824283
4 Sousse 753,670253
5 Ben Arous 721,956830
6 Ariana 674,0251,195
7 Monastir 611,118539
8 Kairouan 601,91585
9 Bizerte 600,012154
10 Médenine 522,29456
11 Kasserine 465,83254
12 Sidi Bouzid 459,89161
13 Mahdia 448,273139
14 Manouba 426,525334
15 Gabès 407,07852
16 Jendouba 405,167129
17 Gafsa 355,34138
18 Béja 308,71085
19 Kef 247,74149
20 Siliana 229,15348
21 Zaghouan 191,06664
22 Kébili 171,4787
23 Tataouine 152,0694
24 Tozeur 116,31623
Source : Institut national de la statistique [12]

Structure of the population

Structure of the population (Census 23.IV.2014): [13]
Age GroupMaleFemaleTotalPercent
Total5 472 3335 510 42010 982 753100
0–4505 509466 662972 1718.85
5–9440 644408 362849 0067.73
10–14407 938381 684789 6227.19
15–19421 716405 792827 5087.53
20–24459 814465 595925 4098.43
25–29449 932484 685934 6178.51
30–34477 322506 459983 7818.96
35–39397 594419 392816 9867.44
40–44357 353370 495727 8486.63
45–49331 283351 673682 9566.22
50–54324 423326 185650 6085.92
55–59268 380266 788535 1684.87
60–64212 900212 524425 4243.87
65–69127 168135 135262 3032.39
70–74107 097113 584220 6812.01
75–7981 73285 164166 8961.52
80+101 528110 241211 7691.93
Age groupMaleFemaleTotalPercent
0–141 354 0911 256 7082 610 79923.77
15–643 700 7173 809 5887 510 30568.38
65+417 525444 124861 6497.85
Population Estimates by Sex and Age Group (01.VII.2021): [14]
Age GroupMaleFemaleTotal%
Total5 845 7715 937 95111 783 722100
0–4926 0697.86
5–91 070 2399.08
10–14944 5338.02
15–19805 9736.84
20–24769 3076.53
25–29845 8677.18
30–34862 8477.32
35–39900 5847.64
40–44858 4617.29
45–49780 9616.63
50–54680 1585.77
55–59665 3925.65
60–64544 4714.62
65-69461 7083.92
70-74286 3172.43
75-79181 6751.54
80+199 1611.69
Age groupMaleFemaleTotalPercent
0–142 940 84124.96
15–647 714 02065.46
65+1 128 8619.58

Ethnic groups

Ethnic groups in Tunisia [2] [3]

   Arabs (98%)
   Berbers (1%)
  Others (1%)

The majority of the population of Tunisia is made up of Arabs (98% of the population). [2] The first people known to history in what is now Tunisia were the Berbers, who currently make up 1% of the population, and were ultimately conquered by the Arabs in the 7th century. [3] There was a continuing inflow of nomadic Arab tribes to the Maghreb from the Arabian Peninsula since the 7th century with a major wave in the 11th century. [15]

Whilst the Ottoman influence has been particularly significant in forming the Turco-Tunisian community, other peoples have also migrated to Tunisia during different periods of time, including Sub-Saharan Africans, Greeks, Romans, Phoenicians (Punics), Jews, and French settlers. The Tunisian, by 1870 the distinction between the Arabic-speaking mass and the Turkish elite had blurred. [16] There is also a small Berber (1% at most) [4] population located in the Dahar mountains and on the island of Djerba in the south-east and in the Khroumire mountainous region in the north-west.

From the late 19th century to after World War II, Tunisia was home to large populations of French and Italians (255,000 Europeans in 1956), [17] although nearly all of them, along with the Jewish population, left after Tunisia became independent. The history of the Jews in Tunisia goes back some 2,000 years. In 1948 the Jewish population was an estimated 105,000, but by 2013 only about 900 remained. [18]

After the Reconquista and expulsion of non-Christians and Moriscos from Spain, many Spanish Muslims and Jews also arrived. According to Matthew Carr, "As many as eighty thousand Moriscos settled in Tunisia, most of them in and around the capital, Tunis, which still contains a quarter known as Zuqaq al-Andalus, or Andalusia Alley." [19]

Genetics

Geographical frequency distribution of Haplogroup J1. HG J1 (ADN-Y).PNG
Geographical frequency distribution of Haplogroup J1.

Tunisians mainly carry haplogroup J1 (34.2%) and haplogroup E (55%). [21] [22] [23]

"In fact, the Tunisian genetic distances to European samples are smaller than those to North African groups. (...) This could be explained by the history of the Tunisian population, reflecting the influence of the ancient Punic settlers of Carthage followed, among others, by Roman, Byzantine, Arab and French occupations, according to historical records. Notwithstanding, other explanations cannot be discarded, such as the relative heterogeneity within current Tunisian populations, and/or the limited sub-Saharan genetic influence in this region as compared with other North African areas, without excluding the possibility of the genetic drift, whose effect might be particularly amplified on the X chromosome.", [24] [25]

However, later research has suggested instead that Tunisians exhibit a mostly indigenous North African ancestral component similar to other Northwest African populations; characterized by a high amount of native Northwest African genes, but with higher Middle Eastern input than in Algeria or Morocco. [26]

Y-Chromosome

Listed here are the human Y-chromosome DNA haplogroups in Tunisia. [27]

HaplogroupnBE1aE1b1aE1b1b1E1b1b1a3E1b1b1a4E1b1b1bE1b1b1cFGIJ1J2KP,RR1a1R1b1aR1b1bT
MarkerM33M2M35V22V65M81M34M89M201V88M269M70
Tunisia6010.170.50.671.6633.1662.731.162.660.170.1716.642.830.330.330.51.830.331.16

Migration

Detailed article : Tunisian diaspora

Main countries of origin of international migrants in Tunisia [28]
Country of origin2020
Flag of Algeria.svg  Algeria 11,060
Flag of Libya.svg  Libya 9,688
Flag of France.svg  France 9,151
Flag of Morocco.svg  Morocco 6,146
Flag of Italy.svg  Italy 2,345
Flag of Germany.svg  Germany 1,537
Flag of Syria.svg  Syria 1,382
Flag of Egypt.svg  Egypt 1,206
Flag of Mali.svg  Mali 1,058
Total60,415'

Other demographic statistics

The following demographic statistics of Tunisia in 2022 are from the World Population Review. [29]

The following demographic statistics are from the CIA World Factbook, unless otherwise indicated. [1]

Population

11,896,972 (2022 est.)

Religions

Muslim (official; Sunni) 99%, other (includes Christian, Jewish, Shia Muslim, and Baha'i) <1%

Age structure

Population pyramid in 2020 Tunisia single age population pyramid 2020.png
Population pyramid in 2020
0-14 years: 25.28% (male 1,529,834/female 1,433,357)
15-24 years: 12.9% (male 766,331/female 745,888)
25-54 years: 42.85% (male 2,445,751/female 2,576,335)
55-64 years: 10.12% (male 587,481/female 598,140)
65 years and over: 8.86% (male 491,602/female 546,458) (2020 est.)

Birth rate

14.62 births/1,000 population (2022 est.) Country comparison to the world: 119th

Death rate

6.36 deaths/1,000 population (2022 est.) Country comparison to the world: 143rd

Total Fertility Rates

1.96 children born/woman (2023 est.) Country comparison to the world: 113th
2 children born/woman (2022 est.) Country comparison to the world: 108th
2.03 children born/woman (2021 est.)

Contraceptive prevalence rate

50.7% (2018 est.)

Population growth rate

0.69% (2022 est.) Country comparison to the world: 129th
0.75% (2021 est.)

Median age

total: 32.7 years. Country comparison to the world: 107th
male: 32 years
female: 33.3 years (2020 est.)

Net migration rate

-1.33 migrant(s)/1,000 population (2022 est.) Country comparison to the world: 154th
-1.34 migrant(s)/1,000 population (2021 est.)
-1.6 migrant(s)/1,000 population (2018 est.)
-0.41 migrant(s)/1,000 population (2010 est.)

Urbanization

urban population: 70.2% of total population (2022)
rate of urbanization: 1.34% annual rate of change (2020-25 est.)
Urban population: 69.9% of total population (2021)
Rate of urbanization: 1.34% annual rate of change (2020-25 est.)

Education expenditures

7.3% of GDP (2016) Country comparison to the world: 18th

Sex ratio

At birth: 1.06 male(s)/female
0-14 years: 1.07 male(s)/female
15-24 years: 1.03 male(s)/female
25-54 years: 0.95 male(s)/female
55-64 years: 0.98 male(s)/female
65 years and over: 0.9 male(s)/female
total population: 0.99 male(s)/female (2020 est.)

Infant mortality rate

Total: 12.16 deaths/1,000 live births (2021 est.)
Male: 13.67 deaths/1,000 live births
Female: 10.57 deaths/1,000 live births

Life expectancy at birth

Total population: 76.57 years (2021 est.)
Male: 74.88 years
Female: 78.36 years

Nationality

noun: Tunisian(s)
adjective: Tunisian

Ethnic groups

Languages

Literacy

definition: age 15 and over can read and write
total population: 81.8%
male: 89.6%
female: 74.2% (2015 est.)

The literacy rate among the Tunisian population increased greatly after its independence from France. According to the 1996 census data, [33] the literacy rate of the last generation of Tunisian men educated under the French rule (those born 1945–49) was less than 65%. For the first generation educated after independence (born 1950–1954), literacy in Arabic among males had increased to nearly 80%. (Sixty-two percent were also literate in French and 15 percent literate in English). Among the youngest generation included in the census (those born 1980–1984), 96.6% were literate in Arabic.

Among Tunisian women, the increase in literacy was even greater. The literacy rate among the last generation of women educated under the French was less than 30%. In the first generation educated after independence, this increased to just over 40%. For the youngest generation of women cited (born 1980–1984), literacy in Arabic had increased to slightly over 90%; over 70% of women were also literate in French. [34]

Life expectancy

Life expectancy in Tunisia since 1923 Life expectancy in Tunisia.svg
Life expectancy in Tunisia since 1923
Life expectancy in Tunisia since 1960 by gender Life expectancy by WBG -Tunisia -diff.png
Life expectancy in Tunisia since 1960 by gender
total population: 76.82 years. Country comparison to the world: 99th
male: 75.14 years
female: 78.6 years (2022 est.)
PeriodLife expectancy in
Years
PeriodLife expectancy in
Years
1950–195538.81985–199067.1
1955–196040.71990–199570.3
1960–196543.71995–200072.4
1965–197048.32000–200573.7
1970–197554.12005–201074.6
1975–198059.42010–201575.0
1980–198564.3

Source: UN World Population Prospects [35]

Literacy

definition: age 15 and over can read and write

total population: 81.8%
male: 89.6%
female: 74.2% (2015)

School life expectancy (primary to tertiary education)

total: 15 years
male: 14 years
female: 16 years (2016)

Unemployment, youth ages 15-24

total: 34.9%
male: 33.8%
female: 37.2% (2017 est.)

Related Research Articles

<span class="mw-page-title-main">Demographics of Angola</span>

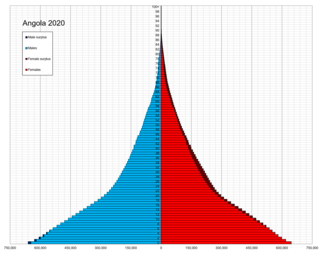
Demographic features of the population of Angola include population density, ethnicity, education level, health of the populace, economic status, religious affiliations and other aspects.

<span class="mw-page-title-main">Demographics of Cameroon</span>

The demographic profile of Cameroon is complex for a country of its population. Cameroon comprises an estimated 250 distinct ethnic groups, which may be formed into five large regional-cultural divisions:

<span class="mw-page-title-main">Demographics of Cape Verde</span>

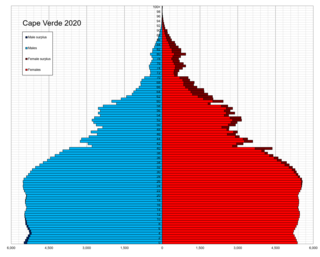
Demographic features of the population of Cape Verde include population density, ethnicity, education level, health of the populace, economic status, religious affiliations and other aspects of the population.

<span class="mw-page-title-main">Demographics of the Comoros</span>

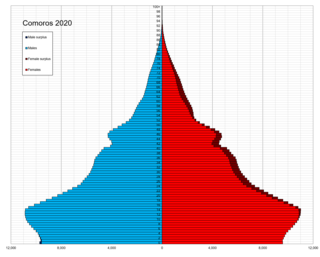
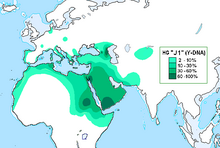
The Comorians inhabiting Grande Comore, Anjouan, and Mohéli share African-Arab origins. Islam is the dominant religion, and Quranic schools for children reinforce its influence. Although Islamic culture is firmly established throughout, a small minority are Christian.

<span class="mw-page-title-main">Demographics of Djibouti</span>

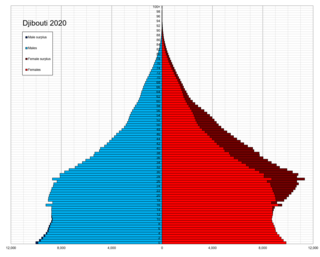
Demographic features of Djibouti include population density, ethnicity, education level, health, economic status, religious affiliations and other aspects.

<span class="mw-page-title-main">Demographics of Kenya</span>

The demography of Kenya is monitored by the Kenyan National Bureau of Statistics. Kenya is a multi-ethnic state in East Africa. Its total population was at 47,558,296 as of the 2019 census.

<span class="mw-page-title-main">Demographics of Lesotho</span>

Demographic features of the population of Lesotho include population density, ethnicity, education level, health of the populace, economic status, religious affiliations and other aspects.

<span class="mw-page-title-main">Demographics of Libya</span>

Demographics of Libya is the demography of Libya, specifically covering population density, ethnicity, education level, health of the populace, economic status, and religious affiliations, as well as other aspects of the Libyan population. The Libyan population resides in the country of Libya, a territory located on the Mediterranean coast of North Africa, to the west of and adjacent to Egypt. Libyans live in Tripoli. It is the capital of the country and first in terms of urban population, along with Benghazi, Libya's second largest city.

<span class="mw-page-title-main">Demographics of Mali</span>

Demographic features of the population of Mali include population density, ethnicity, education level, health of the populace, economic status, religious affiliations and other aspects of the population.

<span class="mw-page-title-main">Demographics of Morocco</span>

Demographic features of the population of Morocco include population density, ethnicity, education level, health of the populace, economic status, religious affiliations and other aspects of the population. The population of Morocco in 2021 is 37.271 million.

<span class="mw-page-title-main">Demographics of Mozambique</span>

The demographics of Mozambique describes the condition and overview of Mozambique's peoples. Demographic topics include basic education, health, and population statistics as well as identified racial and religious affiliations.

<span class="mw-page-title-main">Demographics of Niger</span>

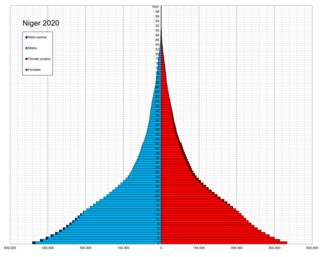
The demographic features of Nigeriens, the people of Niger consist of population density, ethnicity, education level, health of the populace, economic status, religious affiliations and other aspects of the population.

<span class="mw-page-title-main">Demographics of Senegal</span>

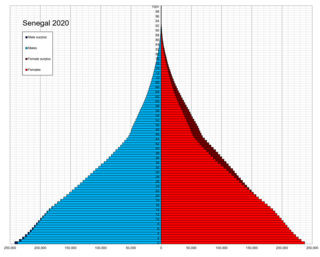
Demographic features of the population of Senegal include population density, ethnicity, education level, health of the populace, economic status, religious affiliations and other aspects of the population.

<span class="mw-page-title-main">Demographics of Seychelles</span>

Demographic features of the population of Seychelles include population density, ethnicity, education level, health of the populace, economic status, religious affiliations and other aspects of the population.

<span class="mw-page-title-main">Demographics of Sudan</span>

The demographics of Sudan include the Sudanese people and their characteristics, Sudan, including population density, ethnicity, education level, health, economic status, religious affiliations, and other aspects of the population.

<span class="mw-page-title-main">Demographics of Tanzania</span>

Demographic features of the population of Tanzania include population density, ethnicity, education level, health of the populace, economic status, religious affiliations, and other aspects of the population.

<span class="mw-page-title-main">Demographics of Uganda</span>

Demographic features of the population of Uganda include population density, ethnicity, education level, health of the populace, economic status, religious affiliations and others.

<span class="mw-page-title-main">Demographics of Algeria</span>

Demographic features of the population of Algeria include population density, ethnicity, education level, health of the populace, economic status, religious affiliations and other aspects.

<span class="mw-page-title-main">Demographics of Cuba</span>

The demographic characteristics of Cuba are known through census which have been conducted and analyzed by different bureaus since 1774. The National Office of Statistics of Cuba (ONE) since 1953. The most recent census was conducted in September 2012. The population of Cuba at the 2012 census was nearly 11.2 million. The population density is 101 inhabitants per square kilometer, and the overall life expectancy in Cuba is 78.0 years. The population has always increased from one census to the next in the 20th century, with the exception of the 2012 census, when the count decreased by 10,000. Since 1740, Cuba's birth rate has surpassed its death rate; the natural growth rate of the country is positive. Cuba is in the fourth stage of demographic transition. In terms of age structure, the population is dominated (71.1%) by the 15- to 64-year-old segment. The median age of the population is 39.5, making it the oldest in the Americas, and the gender ratio of the total population is 0.99 males per female.

<span class="mw-page-title-main">Demographics of the State of Palestine</span>

Demographic features of the population of the area commonly described as Palestinian territories includes information on ethnicity, education level, health of the populace, economic status, religious affiliations and other aspects of that population.

References

  1. 1 2 Tunisia: People, CIA World Factbook, 2018 PD-icon.svg This article incorporates text from this source, which is in the public domain.
  2. 1 2 3 4 "Tunisia", The World Factbook, Central Intelligence Agency, 2022-09-09, retrieved 2022-09-18
  3. 1 2 3 4 5 "Tunisia's Berbers test the limits of country's newfound freedoms". The World from PRX. Retrieved 2022-09-18.
  4. 1 2 3 4 "Q&A: The Berbers". BBC News. 12 March 2004. Retrieved 19 January 2013.
  5. "Tunisia". United States Department of State. Retrieved 28 November 2020.
  6. "Tunisia (03/09/12)". US Department of State. 9 March 2012. Archived from the original on 13 October 2012.
  7. "CIA – The World Factbook—Tunisia" . Retrieved 2007-01-13.
  8. 1 2 International Religious Freedom Report 2007: Tunisia. United States Bureau of Democracy, Human Rights and Labor (September 14, 2007). This article incorporates text from this source, which is in the public domain.
  9. "National Institute of Statistics – Tunisia". Archived from the original on 2019-11-28. Retrieved 2016-05-16.
  10. "United Nations Statistics Division –". United Nations Statistics Division. Retrieved 28 March 2016.
  11. "Statistics Monthly Bulletin, August 2021". Statistiques Tunisie. Retrieved 28 November 2022.
  12. Institut national de la statistique
  13. Division, United Nations Statistics. "UNSD—Demographic and Social Statistics". unstats.un.org. Retrieved 18 April 2018.
  14. "UNSD — Demographic and Social Statistics". unstats.un.org. Retrieved 2023-05-10.
  15. Stearns, Peter N.; Leonard Langer, William (2001). The Encyclopedia of World History: Ancient, Medieval, and Modern, Chronologically Arranged (6 ed.). Houghton Mifflin Harcourt. pp. 129–131. ISBN   978-0-395-65237-4.
  16. Green, Arnold H. (1978), The Tunisian Ulama 1873–1915: Social Structure and Response to Ideological Currents, BRILL, p. 69, ISBN   978-90-04-05687-9
  17. Angus Maddison (20 September 2007). Contours of the World Economy 1–2030 AD:Essays in Macro-Economic History: Essays in Macro-Economic History. OUP Oxford. p. 214. ISBN   978-0-19-922721-1 . Retrieved 26 January 2013.
  18. "The Jews of Tunisia". Jewish Virtual Library. Retrieved 11 July 2014.
  19. Carr, Matthew (2009). Blood and faith: the purging of Muslim Spain. The New Press. p. 290. ISBN   978-1-59558-361-1.
  20. Singh, Sakshi; Singh, Ashish; Rajkumar, Raja; Sampath Kumar, Katakam; Kadarkarai Samy, Subburaj; Nizamuddin, Sheikh; Singh, Amita; Ahmed Sheikh, Shahnawaz; Peddada, Vidya; Khanna, Vinee; Veeraiah, Pandichelvam; Pandit, Aridaman; Chaubey, Gyaneshwer; Singh, Lalji; Thangaraj, Kumarasamy (2016-01-12). "Dissecting the influence of Neolithic demic diffusion on Indian Y-chromosome pool through J2-M172 haplogroup". Scientific Reports. 6: 19157. Bibcode:2016NatSR...619157S. doi:10.1038/srep19157. ISSN   2045-2322. PMC   4709632 . PMID   26754573.
  21. "Archived copy" (PDF). Archived from the original (PDF) on 2012-04-14. Retrieved 2016-05-24.{{cite web}}: CS1 maint: archived copy as title (link)
  22. Cruciani, Fulvio; et al. (May 2004). "Phylogeographic Analysis of Haplogroup E3b (E-M215) Y Chromosomes Reveals Multiple Migratory Events Within and Out Of Africa". The American Journal of Human Genetics. 74 (5): 1014–1022. doi:10.1086/386294. PMC   1181964 . PMID   15042509.
  23. Tej K. Bhatia; William C. Ritchie (2006). The Handbook of Bilingualism. John Wiley & Sons. p. 860. ISBN   978-0631227359 . Retrieved 15 August 2017.
  24. The X chromosome Alu insertions as a tool for human population genetics: data from European and African human groups, Athanasiadis et al. 2007
  25. Tomas C, Sanchez JJ, Barbaro A, et al. (2008). "X-chromosome SNP analyses in 11 human Mediterranean populations show a high overall genetic homogeneity except in North-west Africans (Moroccans)". BMC Evol. Biol. 8 (1): 75. Bibcode:2008BMCEE...8...75T. doi: 10.1186/1471-2148-8-75 . PMC   2315647 . PMID   18312628. Tunisians did not show a significant level of differentiation with northern populations as mentioned by others
  26. Benammar-Elgaaïed, Amel; Larruga, José M.; Cabrera, Vicente M.; Mahmoudi, Hejer Abdallah El; González, Ana M.; Khodjet-El-Khil, Houssein; Fregel, Rosa; Ennafaa, Hajer (2011). "Mitochondrial DNA and Y-chromosome microstructure in Tunisia". Journal of Human Genetics. 56 (10): 734–741. doi: 10.1038/jhg.2011.92 . PMID   21833004.
  27. Bekada, A; Fregel, R; Cabrera, VM; Larruga, JM; Pestano, J; et al. (2013). "Introducing the Algerian Mitochondrial DNA and Y-Chromosome Profiles into the North African Landscape". PLOS ONE. 8 (2): e56775. Bibcode:2013PLoSO...856775B. doi: 10.1371/journal.pone.0056775 . PMC   3576335 . PMID   23431392.
  28. "International Migrant Stock | Population Division".
  29. "Tunisia Population 2022", World Population Review, 2022
  30. 1 2 3 4 "Africa :: TUNISIA". CIA The World Factbook. 28 March 2023.
  31. Arabic, Tunisian Spoken. Ethnologue (19 February 1999). Retrieved on 5 September 2015.
  32. "What Languages Are Spoken In Tunisia?". WorldAtlas. 2017-04-25. Retrieved 2022-09-18.
  33. As , Walters Keith (2003). "Fergie's prescience: the changing nature of diglossia in Tunisia". International Journal of the Society of Language. 2003 (163): 85–87. doi:10.1515/ijsl.2003.048. S2CID   52215123.
  34. The children born in the early 1980s had not yet begun English instruction by the time of the 1996 census, so no literacy rate in English is given. However, the children born between 1970–74 (who had completed their education) had a literacy in English of 20%. It's highly likely that the younger generation's literacy in English was even higher at the conclusion of their schooling. Walters 86.
  35. "World Population Prospects – Population Division – United Nations" . Retrieved 2017-07-15.