Demographics of Guinea-Bissau

Last updated

Demographics of Guinea-Bissau
Guinea-Bissau single age population pyramid 2020.png
Population pyramid of Guinea-Bissau in 2020
Population2,026,778 (2022 est.)
Growth rate2.53% (2022 est.)
Birth rate36.45 births/1,000 population (2022 est.)
Death rate7.5 deaths/1,000 population (2022 est.)
Life expectancy63.68 years
  male61.45 years
  female65.99 years
Fertility rate4.69 children born/woman (2022 est.)
Infant mortality rate49.05 deaths/1,000 live births
Net migration rate-3.63 migrant(s)/1,000 population (2022 est.)
Age structure
0–14 years43.17%
65 and over3.08%
Sex ratio
Total0.96 male(s)/female (2022 est.)
At birth1.03 male(s)/female
Under 151.01 male(s)/female
65 and over0.7 male(s)/female
Nationality
NationalityBissau-Guinean
Language
OfficialPortuguese
Guinea-Bissau's population between 1960 and 2017. Guinea-Bissau population.svg
Guinea-Bissau's population between 1960 and 2017.

This is a demography of the population of Guinea-Bissau including population density, ethnicity, education level, health of the populace, economic status, religious affiliations and other aspects of the population.

Contents

Ethnic groups

The population of Guinea-Bissau is ethnically diverse with distinct languages, customs, and social structures. Most Guineans, 99%, are Black people — mostly Fula and Mandinka-speakers concentrated in the north and northeast, the Balanta and Papel, living in the southern coastal regions, and the Manjaco and Mancanha, occupying the central and northern coastal areas.

Most of the rest, 1% of its total population, are mestiços of mixed Portuguese and black descent, including Cape Verdean minority. Due to the exodus of most Portuguese settlers after independence, less than 1% of Guinea-Bissauans are pure Portuguese. The country also has a Chinese minority, including Macanese people of mixed Portuguese and Cantonese blood from Macau.

Most people are farmers. 38%-45% are Muslims - this makes Guinea-Bissau the only Portuguese-speaking nation with a sizable Muslim population. Most Muslims are Sunnis. The rest of the population are pagans, principally the Balanta, and Christians, mostly Roman Catholics.

Population

Guinea-Bissau's population between 1960 and 2017. Guinea-Bissau population.svg
Guinea-Bissau's population between 1960 and 2017.

According to the 2022 revision of the world factbook the total population was 2,026,778 in 2022. [1] The proportion of children below the age of 14 in 2020 was 43.17%, 53.75% was between 15 and 65 years of age, while 3.08% was 65 years or older. [1] [2] The proportion of the population below the age of 15 in 2010 was 41.3%, 55.4% were aged between 15 and 65 years of age, while 3.3% were aged 65 years or older. [2]

Total population [1] Population aged 0–14 (%)Population aged 15–64 (%)Population aged 65+ (%)
1950518 00038.857.63.6
1955566 00041.954.93.2
1960593 00041.355.73.0
1965598 00041.355.63.1
1970603 00037.059.73.3
1975694 00041.055.73.3
1980835 00042.154.43.5
1985922 00045.451.13.5
19901 017 00043.852.83.5
19951 125 00044.152.63.4
20001 241 00043.153.63.3
20051 368 00042.454.43.2
20101 515 00041.355.43.3
20201 927 10443.253.83.1

Population Estimates by Sex and Age Group (01.VII.2019) (Data refer to national projections.): [3]

Age GroupMaleFemaleTotal%
Total790 873813 6881 604 561100
0–4137 507131 104268 61116.74
5–9125 195118 976244 17115.22
10–1491 54390 827182 37011.37
15–1985 44384 441169 88410.59
20–2472 13070 537142 6678.89
25–2967 42269 259136 6818.52
30–3454 77960 638115 4177.19
35–3946 87155 153102 0246.36
40–4430 18634 77364 9594.05
45–4925 23830 39555 6333.47
50–5417 05620 28237 3382.33
55–5915 06718 33533 4022.08
60–649 07611 57020 6461.29
65-696 4826 89913 3810.83
70-743 8235 0148 8370.55
75-791 8062 8814 6870.29
80+1 2492 6043 8530.24
Age groupMaleFemaleTotalPercent
0–14354 245340 907695 15243.32
15–64423 268455 383878 65154.76
65+13 36017 39830 7581.92

Vital statistics

Registration of vital events is in Guinea-Bissau not complete. The Population Departement of the United Nations prepared the following estimates. [2]

PeriodLive births per yearDeaths per yearNatural change per yearCBR*CDR*NC*TFR*IMR*
1950-195530 00018 00012 00054.933.521.47.41211
1955-196025 00017 0007 00042.329.512.85.88201
1960-196525 00016 0009 00042.327.414.95.88191
1965-197021 00015 0006 00035.624.810.84.78182
1970-197536 00018 00018 00055.727.328.47.34174
1975-198035 00019 00015 00045.525.320.36.11165
1980-198542 00021 00021 00047.923.524.46.70153
1985-199044 00021 00023 00045.822.123.76.68145
1990-199548 00023 00026 00045.221.224.06.54141
1995-200051 00024 00027 00042.819.922.96.05134
2000-200554 00024 00029 00041.118.522.55.66126
2005-201057 00025 00032 00039.317.521.95.27119
* CBR = crude birth rate (per 1000); CDR = crude death rate (per 1000); NC = natural change (per 1000); IMR = infant mortality rate per 1000 births; TFR = total fertility rate (number of children per woman)

Life expectancy

PeriodLife expectancy in
Years [4]
1950–195535.88
1955–1960Increase2.svg 37.19
1960–1965Increase2.svg 38.63
1965–1970Increase2.svg 40.60
1970–1975Increase2.svg 42.48
1975–1980Increase2.svg 44.49
1980–1985Increase2.svg 46.60
1985–1990Increase2.svg 48.18
1990–1995Increase2.svg 49.99
1995–2000Increase2.svg 51.81
2000–2005Increase2.svg 52.68
2005–2010Increase2.svg 54.18
2010–2015Increase2.svg 56.00

Other demographic statistics

Demographic statistics according to the World Population Review in 2022. [5]

The following demographic are from the independent Guinea-Bissau Statistical Service[ citation needed ] and from the CIA World Factbook [6] unless otherwise indicated.

Population

2,026,778 (2022 est.)
1,833,247 (July 2018 est.)
1,596,677 (July 2011 est.)

Religions

Muslim 46.1%, folk religions 30.6%, Christian 18.9%, other or unaffiliated 4.4% (2020 est.)

Age structure

Population pyramid of Guinea-Bissau in 2020 Guinea-Bissau single age population pyramid 2020.png
Population pyramid of Guinea-Bissau in 2020
0-14 years: 43.17% (male 417,810/female 414,105)
15-24 years: 20.38% (male 192,451/female 200,370)
25-54 years: 30.24% (male 275,416/female 307,387)
55-64 years: 3.12% (male 29,549/female 30,661)
65 years and over: 3.08% (male 25,291/female 34,064) (2020 est.)
0-14 years: 43.55% (male 400,666 /female 397,704)
15-24 years: 20.23% (male 181,286 /female 189,515)
25-54 years: 29.9% (male 259,762 /female 288,300)
55-64 years: 3.29% (male 27,621 /female 32,611)
65 years and over: 3.04% (male 24,331 /female 31,451) (2018 est.)

Birth rate

36.45 births/1,000 population (2022 est.) Country comparison to the world: 12nd
37.3 births/1,000 population (2018 est.) Country comparison to the world: 13th

Death rate

7.5 deaths/1,000 population (2022 est.) Country comparison to the world: 106th
8.5 deaths/1,000 population (2018 est.) Country comparison to the world: 79th

Total fertility rate

4.69 children born/woman (2022 est.) Country comparison to the world: 14th
4.81 children born/woman (2018 est.) Country comparison to the world: 18th

Population growth rate

2.53% (2022 est.) Country comparison to the world: 21st
2.48% (2018 est.) Country comparison to the world: 23rd
1.988% (2011 est.)

Median age

total: 18 years. Country comparison to the world: 214th
male: 17.4 years
female: 18.6 years (2020 est.)
total: 17.8 years. Country comparison to the world: 216th
male: 17.2 years
female: 18.5 years (2018 est.)

Contraceptive prevalence rate

20.6% (2018)
16% (2014)

Net migration rate

-3.63 migrant(s)/1,000 population (2022 est.) Country comparison to the world: 188th
-3.72 migrant(s)/1,000 population (2021 est.) Country comparison to the world: 189th

Life expectancy at birth

total population: 63.68 years. Country comparison to the world: 207th
male: 61.45 years
female: 65.99 years (2022 est.)
total population: 61.4 years (2018 est.)
male: 59.2 years (2018 est.)
female: 63.6 years (2018 est.)
total population: 50.23 years
male: 48.21 years
female: 52.31 years (2015 est.)

Dependency ratios

total dependency ratio: 80.4 (2015 est.)
youth dependency ratio: 75.2 (2015 est.)
elderly dependency ratio: 5.2 (2015 est.)
potential support ratio: 19.3 (2015 est.)

Urbanization

urban population: 45% of total population (2022)
rate of urbanization: 3.22% annual rate of change (2020-25 est.)
urban population: 43.4% of total population (2018)
rate of urbanization: 3.41% annual rate of change (2015-20 est.)

Sex ratio

Nationality

noun:Guinean (s)
adjective:Guinean

Ethnic groups

[7]

Languages

[7]

Education expenditures

2.9% of GDP (2019) Country comparison to the world: 155th

Literacy

definition: age 15 and over can read and write

total population: 59.9%
male: 71.8%
female: 48.3% (2015 est.)

Major infectious diseases

degree of risk: very high (2020)
food or waterborne diseases: bacterial and protozoal diarrhea, hepatitis A, and typhoid fever
vectorborne diseases: malaria, dengue fever, and yellow fever
water contact diseases: schistosomiasis
animal contact diseases: rabies

note: on 21 March 2022, the US Centers for Disease Control and Prevention (CDC) issued a Travel Alert for polio in Africa; Guinea-Bissau is currently considered a high risk to travelers for circulating vaccine-derived polioviruses (cVDPV); vaccine-derived poliovirus (VDPV) is a strain of the weakened poliovirus that was initially included in oral polio vaccine (OPV) and that has changed over time and behaves more like the wild or naturally occurring virus; this means it can be spread more easily to people who are unvaccinated against polio and who come in contact with the stool or respiratory secretions, such as from a sneeze, of an "infected" person who received oral polio vaccine; the CDC recommends that before any international travel, anyone unvaccinated, incompletely vaccinated, or with an unknown polio vaccination status should complete the routine polio vaccine series; before travel to any high-risk destination, CDC recommends that adults who previously completed the full, routine polio vaccine series receive a single, lifetime booster dose of polio vaccine.[ citation needed ]

Related Research Articles

<span class="mw-page-title-main">Demographics of Burkina Faso</span>

Burkina Faso's 22.1 million people belong to two major West African cultural groups: the Gur (Voltaic) and the Mandé. The Voltaic are far more numerous and include the Mossi, who make up about one-half of the population. The Mossi claim descent from warriors who migrated to present-day Burkina Faso and established an empire that lasted more than 800 years. Predominantly farmers, the Mossi are still bound by the traditions of the Mogho Naba, who hold court in Ouagadougou.

<span class="mw-page-title-main">Demographics of Chad</span>

The people of Chad speak more than 100 different languages and divide themselves into many ethnic groups. However, language and ethnicity are not the same. Moreover, neither element can be tied to a particular physical type.

<span class="mw-page-title-main">Demographics of Cape Verde</span> Demographic overview

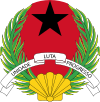
This article is about the demographic features of the population of Cape Verde, including population density, ethnicity, education level, health of the populace, economic status, religious affiliations and other aspects of the population.

<span class="mw-page-title-main">Demographics of the Central African Republic</span>

This article is about the demographic features of the population of the Central African Republic, including population density, ethnicity, education level, health of the populace, economic status, religious affiliations and other aspects of the population.

<span class="mw-page-title-main">Demographics of Djibouti</span>

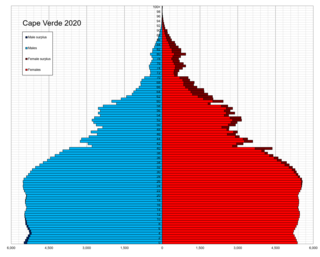
This article is about the demographics of Djibouti, including population density, ethnicity, education level, health, economic status, religious affiliations and other aspects of the population.

<span class="mw-page-title-main">Demographics of Equatorial Guinea</span>

This article is about the demographic features of the population of Equatorial Guinea, including population density, ethnicity, education level, health of the populace, economic status, religious affiliations and other aspects of the population.

<span class="mw-page-title-main">Demographics of Ethiopia</span>

The demographics of Ethiopia encompass the demographic features of inhabitants in Ethiopia, including ethnicity, languages, population density, education level, health, economic status, religious affiliations and other aspects of the population.

<span class="mw-page-title-main">Demographics of Guinea</span>

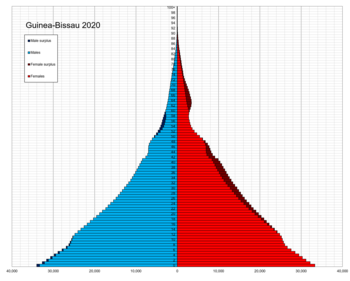
Demographics of Guinea describes the condition and overview of Guinea's peoples. Demographic topics include basic education, health, and population statistics as well as identified racial and religious affiliations.

<span class="mw-page-title-main">Demographics of Liberia</span>

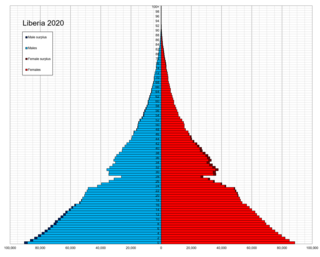
As of 2006, Liberia has the highest population growth rate in the world. 43.5% of Liberians were below the age of 15 in 2010. With recent civil wars being fought along ethnic lines, Liberia is a multiethnic and multicultural country.

<span class="mw-page-title-main">Demographics of Malawi</span>

This article is about the demographic features of the population of Malawi, including population density, ethnicity, education level, health of the populace, economic status, religious affiliations and other aspects of the population.

<span class="mw-page-title-main">Demographics of Mauritania</span>

This article is about the demographic features of the population of Mauritania, including population density, ethnicity, education level, health of the populace, economic status, religious affiliations and other aspects of the population.

<span class="mw-page-title-main">Demographics of Mozambique</span>

The demographics of Mozambique describes the condition and overview of Mozambique's peoples. Demographic topics include basic education, health, and population statistics as well as identified racial and religious affiliations.

<span class="mw-page-title-main">Demographics of Niger</span>

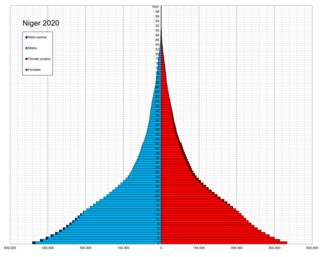
This article is about the demographic features of Nigeriens, the people of Niger, including population density, ethnicity, education level, health of the populace, economic status, religious affiliations and other aspects of the population.

<span class="mw-page-title-main">Demographics of the Republic of the Congo</span> National demographics

This article is about the demographic features of the population of the Republic of the Congo, including population density, ethnicity, education level, health of the populace, economic status, religious affiliations and other aspects of the population.

<span class="mw-page-title-main">Demographics of Senegal</span>

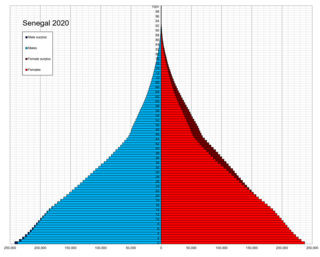
This article is about the demographic features of the population of Senegal, including population density, ethnicity, education level, health of the populace, economic status, religious affiliations and other aspects of the population.

<span class="mw-page-title-main">Demographics of Sierra Leone</span>

The demographics of Sierra Leone are made up of an indigenous population from 18 ethnic groups. The Temne in the north and the Mende in the south are the largest. About 60,000 are Krio, the descendants of freed slaves who returned to Sierra Leone from Great Britain, North America and slave ships captured on the high seas. In addition, about 5,000 Lebanese, 1,000 Indians, and 5,000 Europeans reside in the country.

<span class="mw-page-title-main">Demographics of Madagascar</span>

This article is about the demographic features of the population of Madagascar, including population density, ethnicity, education level, health of the populace, economic status, religious affiliations and other aspects of the population.

<span class="mw-page-title-main">Demographics of Uganda</span> Aspect of human geography in Uganda

This article is about the demographic features of the population of Uganda, including population density, ethnicity, education level, health of the populace, economic status, religious affiliations and other aspects of the population.

<span class="mw-page-title-main">Demographics of the Gambia</span> Demographics of the West African country

The demographic characteristics of the population of The Gambia are known through national censuses, conducted in ten-year intervals and analyzed by The Gambian Bureau of Statistics (GBOS) since 1963. The latest census was conducted in 2013. The population of The Gambia at the 2013 census was 1.8 million. The population density is 176.1 per square kilometer, and the overall life expectancy in The Gambia is 64.1 years. Since the first census of 1963, the population of The Gambia has increased every ten years by an average of 43.2 percent. Since 1950s, the birth rate has constantly exceeded the death rate; the natural growth rate is positive. The Gambia is in the second stage of demographic transition. In terms of age structure, The Gambia is dominated by 15- to 24-year-old segment (57.6%). The median age of the population is 19.9 years, and the gender ratio of the total population is 0.98 males per female.

<span class="mw-page-title-main">Demographics of Somalia</span>

The demographics of Somalis encompass the demographic features of Somalia's inhabitants, including ethnicity, language, population density, education level, health, economic status, religious affiliations and other aspects of the population. Somalia is believed to be one of the most homogeneous countries in sub-Saharan Africa.

References

  1. 1 2 3 "Guinea-Bissau". 14 April 2022.
  2. 1 2 3 Population Division of the Department of Economic and Social Affairs of the United Nations Secretariat, World Population Prospects: The 2010 Revision
  3. "UNSD — Demographic and Social Statistics".
  4. "World Population Prospects - Population Division - United Nations". esa.un.org. Retrieved 26 August 2018.
  5. "Guinea-Bissau Population 2022", World Population Review
  6. PD-icon.svg This article incorporates text from this source, which is in the public domain : "The World FactBook - Guinea-Bissau", The World Factbook , 2022
  7. 1 2 "Africa :: GUINEA-BISSAU". CIA The World Factbook. 14 April 2022.