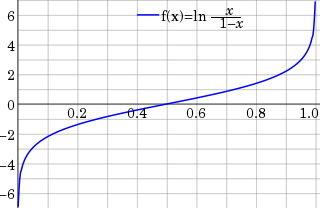
In statistics, the logit function is the quantile function associated with the standard logistic distribution. It has many uses in data analysis and machine learning, especially in data transformations.
Binary classification is the task of classifying the elements of a set into one of two groups on the basis of a classification rule. Typical binary classification problems include:

In statistics, the logistic model is a statistical model that models the log-odds of an event as a linear combination of one or more independent variables. In regression analysis, logistic regression is estimating the parameters of a logistic model. Formally, in binary logistic regression there is a single binary dependent variable, coded by an indicator variable, where the two values are labeled "0" and "1", while the independent variables can each be a binary variable or a continuous variable. The corresponding probability of the value labeled "1" can vary between 0 and 1, hence the labeling; the function that converts log-odds to probability is the logistic function, hence the name. The unit of measurement for the log-odds scale is called a logit, from logistic unit, hence the alternative names. See § Background and § Definition for formal mathematics, and § Example for a worked example.

A decision tree is a decision support hierarchical model that uses a tree-like model of decisions and their possible consequences, including chance event outcomes, resource costs, and utility. It is one way to display an algorithm that only contains conditional control statements.
An odds ratio (OR) is a statistic that quantifies the strength of the association between two events, A and B. The odds ratio is defined as the ratio of the odds of A in the presence of B and the odds of A in the absence of B, or equivalently, the ratio of the odds of B in the presence of A and the odds of B in the absence of A. Two events are independent if and only if the OR equals 1, i.e., the odds of one event are the same in either the presence or absence of the other event. If the OR is greater than 1, then A and B are associated (correlated) in the sense that, compared to the absence of B, the presence of B raises the odds of A, and symmetrically the presence of A raises the odds of B. Conversely, if the OR is less than 1, then A and B are negatively correlated, and the presence of one event reduces the odds of the other event.
In mathematics, the ratio test is a test for the convergence of a series
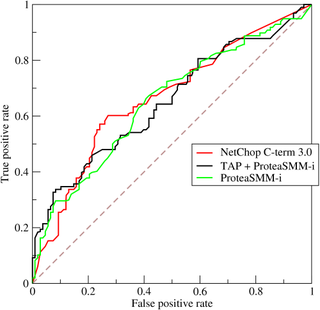
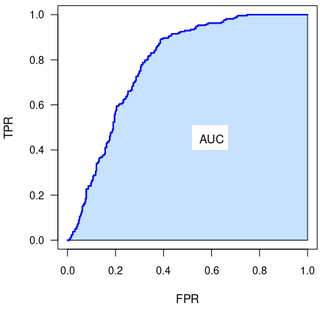
A receiver operating characteristic curve, or ROC curve, is a graphical plot that illustrates the performance of a binary classifier model at varying threshold values.
In evidence-based medicine, likelihood ratios are used for assessing the value of performing a diagnostic test. They use the sensitivity and specificity of the test to determine whether a test result usefully changes the probability that a condition exists. The first description of the use of likelihood ratios for decision rules was made at a symposium on information theory in 1954. In medicine, likelihood ratios were introduced between 1975 and 1980.

The positive and negative predictive values are the proportions of positive and negative results in statistics and diagnostic tests that are true positive and true negative results, respectively. The PPV and NPV describe the performance of a diagnostic test or other statistical measure. A high result can be interpreted as indicating the accuracy of such a statistic. The PPV and NPV are not intrinsic to the test ; they depend also on the prevalence. Both PPV and NPV can be derived using Bayes' theorem.
In statistics, multinomial logistic regression is a classification method that generalizes logistic regression to multiclass problems, i.e. with more than two possible discrete outcomes. That is, it is a model that is used to predict the probabilities of the different possible outcomes of a categorically distributed dependent variable, given a set of independent variables.
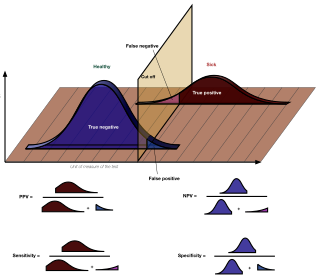
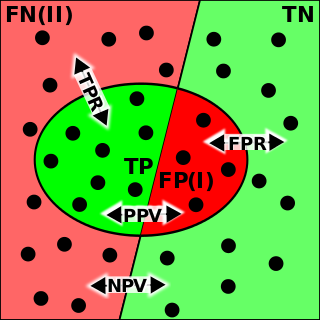
In medicine and statistics, sensitivity and specificity mathematically describe the accuracy of a test that reports the presence or absence of a medical condition. If individuals who have the condition are considered "positive" and those who do not are considered "negative", then sensitivity is a measure of how well a test can identify true positives and specificity is a measure of how well a test can identify true negatives:

In pattern recognition, information retrieval, object detection and classification, precision and recall are performance metrics that apply to data retrieved from a collection, corpus or sample space.
The term generalized logistic distribution is used as the name for several different families of probability distributions. For example, Johnson et al. list four forms, which are listed below.
In statistics, when performing multiple comparisons, a false positive ratio is the probability of falsely rejecting the null hypothesis for a particular test. The false positive rate is calculated as the ratio between the number of negative events wrongly categorized as positive and the total number of actual negative events.
In statistics, the phi coefficient is a measure of association for two binary variables.
The Fowlkes–Mallows index is an external evaluation method that is used to determine the similarity between two clusterings, and also a metric to measure confusion matrices. This measure of similarity could be either between two hierarchical clusterings or a clustering and a benchmark classification. A higher value for the Fowlkes–Mallows index indicates a greater similarity between the clusters and the benchmark classifications. It was invented by Bell Labs statisticians Edward Fowlkes and Collin Mallows in 1983.
The evaluation of binary classifiers compares two methods of assigning a binary attribute, one of which is usually a standard method and the other is being investigated. There are many metrics that can be used to measure the performance of a classifier or predictor; different fields have different preferences for specific metrics due to different goals. For example, in medicine sensitivity and specificity are often used, while in computer science precision and recall are preferred. An important distinction is between metrics that are independent on the prevalence, and metrics that depend on the prevalence – both types are useful, but they have very different properties.
Fairness in machine learning refers to the various attempts at correcting algorithmic bias in automated decision processes based on machine learning models. Decisions made by computers after a machine-learning process may be considered unfair if they were based on variables considered sensitive. Examples of these kinds of variable include gender, ethnicity, sexual orientation, disability, language, and more. As it is the case with many ethical concepts, definitions of fairness and bias are always controversial. In general, fairness and bias are considered relevant when the decision process impacts people's lives. In machine learning, the problem of algorithmic bias is well known and well studied. Outcomes may be skewed by a range of factors and thus might be considered unfair with respect to certain groups or individuals. An example would be the way social media sites deliver personalized news to consumers.
The Partial Area Under the ROC Curve (pAUC) is a metric for the performance of binary classifier.
P4 metric enables performance evaluation of the binary classifier. It is calculated from precision, recall, specificity and NPV (negative predictive value). P4 is designed in similar way to F1 metric, however addressing the criticisms leveled against F1. It may be perceived as its extension.


