Binary classification

Last updated

Binary classification is the task of classifying the elements of a set into one of two groups (each called class) on the basis of a classification rule. Typical binary classification problems include:

Contents

Binary classification is dichotomization applied to a practical situation. In many practical binary classification problems, the two groups are not symmetric, and rather than overall accuracy, the relative proportion of different types of errors is of interest. For example, in medical testing, detecting a disease when it is not present (a false positive ) is considered differently from not detecting a disease when it is present (a false negative ).

Statistical binary classification

Statistical classification is a problem studied in machine learning. It is a type of supervised learning, a method of machine learning where the categories are predefined, and is used to categorize new probabilistic observations into said categories. When there are only two categories the problem is known as statistical binary classification.

Some of the methods commonly used for binary classification are:

Each classifier is best in only a select domain based upon the number of observations, the dimensionality of the feature vector, the noise in the data and many other factors. For example, random forests perform better than SVM classifiers for 3D point clouds. [1] [2]

Evaluation of binary classifiers

In this set of tested instances, the instances left of the divider have the condition being tested; the right half do not. The oval bounds those instances that a test algorithm classifies as having the condition. The green areas highlight the instances that the test algorithm correctly classified. Labels refer to:
TP=true positive; TN=true negative; FP=false positive (type I error); FN=false negative (type II error); TPR=set of instances to determine true positive rate; FPR=set of instances to determine false positive rate; PPV=positive predictive value; NPV=negative predictive value. Binary-classification-labeled.svg
In this set of tested instances, the instances left of the divider have the condition being tested; the right half do not. The oval bounds those instances that a test algorithm classifies as having the condition. The green areas highlight the instances that the test algorithm correctly classified. Labels refer to:
TP=true positive; TN=true negative; FP=false positive (type I error); FN=false negative (type II error); TPR=set of instances to determine true positive rate; FPR=set of instances to determine false positive rate; PPV=positive predictive value; NPV=negative predictive value.

There are many metrics that can be used to measure the performance of a classifier or predictor; different fields have different preferences for specific metrics due to different goals. In medicine sensitivity and specificity are often used, while in information retrieval precision and recall are preferred. An important distinction is between metrics that are independent of how often each category occurs in the population (the prevalence ), and metrics that depend on the prevalence – both types are useful, but they have very different properties.

Given a classification of a specific data set, there are four basic combinations of actual data category and assigned category: true positives TP (correct positive assignments), true negatives TN (correct negative assignments), false positives FP (incorrect positive assignments), and false negatives FN (incorrect negative assignments).

Assigned
Actual
Test outcome positiveTest outcome negative
Condition positiveTrue positiveFalse negative
Condition negativeFalse positiveTrue negative

These can be arranged into a 2×2 contingency table, with rows corresponding to actual value – condition positive or condition negative – and columns corresponding to classification value – test outcome positive or test outcome negative.

The eight basic ratios

There are eight basic ratios that one can compute from this table, which come in four complementary pairs (each pair summing to 1). These are obtained by dividing each of the four numbers by the sum of its row or column, yielding eight numbers, which can be referred to generically in the form "true positive row ratio" or "false negative column ratio".

There are thus two pairs of column ratios and two pairs of row ratios, and one can summarize these with four numbers by choosing one ratio from each pair – the other four numbers are the complements.

The row ratios are:

The column ratios are:

In diagnostic testing, the main ratios used are the true column ratios – true positive rate and true negative rate – where they are known as sensitivity and specificity. In informational retrieval, the main ratios are the true positive ratios (row and column) – positive predictive value and true positive rate – where they are known as precision and recall. There is no general theory that sets out which pair should be used in which circumstances; each discipline has its own reason for the choice it has made.

One can take ratios of a complementary pair of ratios, yielding four likelihood ratios (two column ratio of ratios, two row ratio of ratios). This is primarily done for the column (condition) ratios, yielding likelihood ratios in diagnostic testing. Taking the ratio of one of these groups of ratios yields a final ratio, the diagnostic odds ratio (DOR). This can also be defined directly as (TP×TN)/(FP×FN) = (TP/FN)/(FP/TN); this has a useful interpretation – as an odds ratio – and is prevalence-independent.

There are a number of other metrics, most simply the accuracy or Fraction Correct (FC), which measures the fraction of all instances that are correctly categorized; the complement is the Fraction Incorrect (FiC). The F-score combines precision and recall into one number via a choice of weighing, most simply equal weighing, as the balanced F-score (F1 score). Some metrics come from regression coefficients: the markedness and the informedness, and their geometric mean, the Matthews correlation coefficient. Other metrics include Youden's J statistic, the uncertainty coefficient, the phi coefficient, and Cohen's kappa.

Converting continuous values to binary

Tests whose results are of continuous values, such as most blood values, can artificially be made binary by defining a cutoff value, with test results being designated as positive or negative depending on whether the resultant value is higher or lower than the cutoff.

However, such conversion causes a loss of information, as the resultant binary classification does not tell how much above or below the cutoff a value is. As a result, when converting a continuous value that is close to the cutoff to a binary one, the resultant positive or negative predictive value is generally higher than the predictive value given directly from the continuous value. In such cases, the designation of the test of being either positive or negative gives the appearance of an inappropriately high certainty, while the value is in fact in an interval of uncertainty. For example, with the urine concentration of hCG as a continuous value, a urine pregnancy test that measured 52 mIU/ml of hCG may show as "positive" with 50 mIU/ml as cutoff, but is in fact in an interval of uncertainty, which may be apparent only by knowing the original continuous value. On the other hand, a test result very far from the cutoff generally has a resultant positive or negative predictive value that is lower than the predictive value given from the continuous value. For example, a urine hCG value of 200,000 mIU/ml confers a very high probability of pregnancy, but conversion to binary values results in that it shows just as "positive" as the one of 52 mIU/ml.

See also

Related Research Articles

Accuracy and precision are two measures of observational error. Accuracy is how close a given set of measurements are to their true value, while precision is how close the measurements are to each other.

<span class="mw-page-title-main">Decision tree</span> Decision support tool

A decision tree is a decision support hierarchical model that uses a tree-like model of decisions and their possible consequences, including chance event outcomes, resource costs, and utility. It is one way to display an algorithm that only contains conditional control statements.

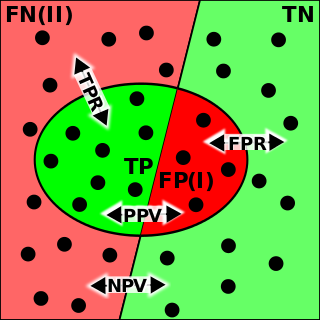
In the field of machine learning and specifically the problem of statistical classification, a confusion matrix, also known as error matrix, is a specific table layout that allows visualization of the performance of an algorithm, typically a supervised learning one; in unsupervised learning it is usually called a matching matrix.

<span class="mw-page-title-main">Receiver operating characteristic</span> Diagnostic plot of binary classifier ability

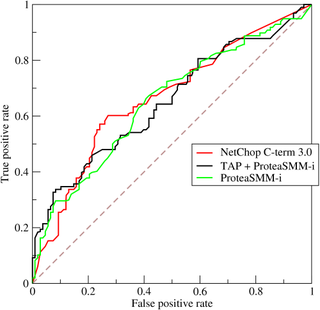
A receiver operating characteristic curve, or ROC curve, is a graphical plot that illustrates the performance of a binary classifier model at varying threshold values.

<span class="mw-page-title-main">Positive and negative predictive values</span> In biostatistics, proportion of true positive and true negative results

The positive and negative predictive values are the proportions of positive and negative results in statistics and diagnostic tests that are true positive and true negative results, respectively. The PPV and NPV describe the performance of a diagnostic test or other statistical measure. A high result can be interpreted as indicating the accuracy of such a statistic. The PPV and NPV are not intrinsic to the test ; they depend also on the prevalence. Both PPV and NPV can be derived using Bayes' theorem.

Cohen's kappa coefficient is a statistic that is used to measure inter-rater reliability for qualitative (categorical) items. It is generally thought to be a more robust measure than simple percent agreement calculation, as κ takes into account the possibility of the agreement occurring by chance. There is controversy surrounding Cohen's kappa due to the difficulty in interpreting indices of agreement. Some researchers have suggested that it is conceptually simpler to evaluate disagreement between items.

Given a population whose members each belong to one of a number of different sets or classes, a classification rule or classifier is a procedure by which the elements of the population set are each predicted to belong to one of the classes. A perfect classification is one for which every element in the population is assigned to the class it really belongs to. The bayes classifier is the classifier which assigns classes optimally based on the known attributes of the elements to be classified.

<span class="mw-page-title-main">F-score</span> Statistical measure of a tests accuracy

In statistical analysis of binary classification and information retrieval systems, the F-score or F-measure is a measure of predictive performance. It is calculated from the precision and recall of the test, where the precision is the number of true positive results divided by the number of all samples predicted to be positive, including those not identified correctly, and the recall is the number of true positive results divided by the number of all samples that should have been identified as positive. Precision is also known as positive predictive value, and recall is also known as sensitivity in diagnostic binary classification.

<span class="mw-page-title-main">Rand index</span> Measure of similarity between two data clusterings

The Rand index or Rand measure in statistics, and in particular in data clustering, is a measure of the similarity between two data clusterings. A form of the Rand index may be defined that is adjusted for the chance grouping of elements, this is the adjusted Rand index. The Rand index is the accuracy of determining if a link belongs within a cluster or not.

<span class="mw-page-title-main">Sensitivity and specificity</span> Statistical measures of the performance of a binary classification test

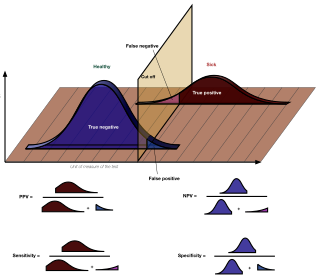
In medicine and statistics, sensitivity and specificity mathematically describe the accuracy of a test that reports the presence or absence of a medical condition. If individuals who have the condition are considered "positive" and those who do not are considered "negative", then sensitivity is a measure of how well a test can identify true positives and specificity is a measure of how well a test can identify true negatives:

Youden's J statistic is a single statistic that captures the performance of a dichotomous diagnostic test. (Bookmaker) Informedness is its generalization to the multiclass case and estimates the probability of an informed decision.

<span class="mw-page-title-main">Precision and recall</span> Pattern-recognition performance metrics

In pattern recognition, information retrieval, object detection and classification, precision and recall are performance metrics that apply to data retrieved from a collection, corpus or sample space.

In statistics, the phi coefficient is a measure of association for two binary variables.

<span class="mw-page-title-main">Diagnostic odds ratio</span>

In medical testing with binary classification, the diagnostic odds ratio (DOR) is a measure of the effectiveness of a diagnostic test. It is defined as the ratio of the odds of the test being positive if the subject has a disease relative to the odds of the test being positive if the subject does not have the disease.

The Fowlkes–Mallows index is an external evaluation method that is used to determine the similarity between two clusterings, and also a metric to measure confusion matrices. This measure of similarity could be either between two hierarchical clusterings or a clustering and a benchmark classification. A higher value for the Fowlkes–Mallows index indicates a greater similarity between the clusters and the benchmark classifications. It was invented by Bell Labs statisticians Edward Fowlkes and Collin Mallows in 1983.

<span class="mw-page-title-main">Evaluation of binary classifiers</span>

The evaluation of binary classifiers compares two methods of assigning a binary attribute, one of which is usually a standard method and the other is being investigated. There are many metrics that can be used to measure the performance of a classifier or predictor; different fields have different preferences for specific metrics due to different goals. For example, in medicine sensitivity and specificity are often used, while in computer science precision and recall are preferred. An important distinction is between metrics that are independent on the prevalence, and metrics that depend on the prevalence – both types are useful, but they have very different properties.

<span class="mw-page-title-main">Forensic epidemiology</span>

The discipline of forensic epidemiology (FE) is a hybrid of principles and practices common to both forensic medicine and epidemiology. FE is directed at filling the gap between clinical judgment and epidemiologic data for determinations of causality in civil lawsuits and criminal prosecution and defense.

Fairness in machine learning refers to the various attempts at correcting algorithmic bias in automated decision processes based on machine learning models. Decisions made by computers after a machine-learning process may be considered unfair if they were based on variables considered sensitive. For example gender, ethnicity, sexual orientation or disability. As it is the case with many ethical concepts, definitions of fairness and bias are always controversial. In general, fairness and bias are considered relevant when the decision process impacts people's lives. In machine learning, the problem of algorithmic bias is well known and well studied. Outcomes may be skewed by a range of factors and thus might be considered unfair with respect to certain groups or individuals. An example would be the way social media sites deliver personalized news to consumers.

<span class="mw-page-title-main">Partial Area Under the ROC Curve</span> Dev gurjar actor

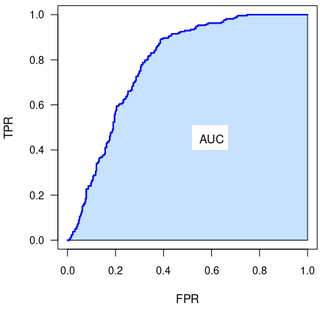
The Partial Area Under the ROC Curve (pAUC) is a metric for the performance of binary classifier.

P4 metric enables performance evaluation of the binary classifier. It is calculated from precision, recall, specificity and NPV (negative predictive value). P4 is designed in similar way to F1 metric, however addressing the criticisms leveled against F1. It may be perceived as its extension.

References

  1. Zhang & Zakhor, Richard & Avideh (2014). "Automatic Identification of Window Regions on Indoor Point Clouds Using LiDAR and Cameras". VIP Lab Publications. CiteSeerX   10.1.1.649.303 .
  2. Y. Lu and C. Rasmussen (2012). "Simplified markov random fields for efficient semantic labeling of 3D point clouds" (PDF). IROS.

Bibliography