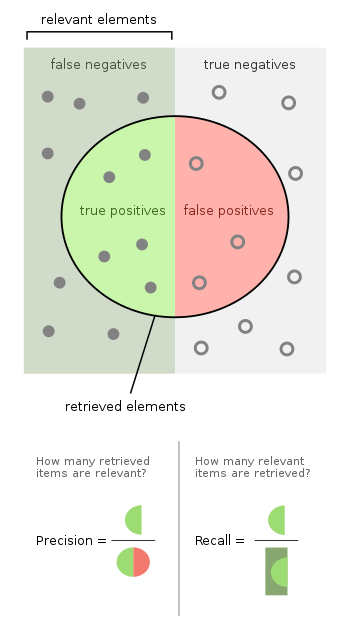
Precision (also called positive predictive value) is the fraction of relevant instances among the retrieved instances. Written as a formula:
Recall (also known as sensitivity) is the fraction of relevant instances that were retrieved. Written as a formula:
Both precision and recall are therefore based on relevance.
Consider a computer program for recognizing dogs (the relevant element) in a digital photograph. Upon processing a picture which contains ten cats and twelve dogs, the program identifies eight dogs. Of the eight elements identified as dogs, only five actually are dogs (true positives), while the other three are cats (false positives). Seven dogs were missed (false negatives), and seven cats were correctly excluded (true negatives). The program's precision is then 5/8 (true positives / selected elements) while its recall is 5/12 (true positives / relevant elements).
Adopting a hypothesis-testing approach from statistics, in which, in this case, the null hypothesis is that a given item is irrelevant (i.e., not a dog), absence of type I and type II errors (i.e., perfect specificity and sensitivity of 100% each) corresponds respectively to perfect precision (no false positive) and perfect recall (no false negative).
More generally, recall is simply the complement of the type II error rate (i.e., one minus the type II error rate). Precision is related to the type I error rate, but in a slightly more complicated way, as it also depends upon the prior distribution of seeing a relevant vs. an irrelevant item.
The above cat and dog example contained 8 − 5 = 3 type I errors (false positives) out of 10 total cats (true negatives), for a type I error rate of 3/10, and 12 − 5 = 7 type II errors (false negatives), for a type II error rate of 7/12. Precision can be seen as a measure of quality, and recall as a measure of quantity. Higher precision means that an algorithm returns more relevant results than irrelevant ones, and high recall means that an algorithm returns most of the relevant results (whether or not irrelevant ones are also returned).
Introduction
In a classification task, the precision for a class is the number of true positives (i.e. the number of items correctly labelled as belonging to the positive class) divided by the total number of elements labelled as belonging to the positive class (i.e. the sum of true positives and false positives, which are items incorrectly labelled as belonging to the class). Recall in this context is defined as the number of true positives divided by the total number of elements that actually belong to the positive class (i.e. the sum of true positives and false negatives, which are items which were not labelled as belonging to the positive class but should have been).
Precision and recall are not particularly useful metrics when used in isolation. For instance, it is possible to have perfect recall by simply retrieving every single item. Likewise, it is possible to have near-perfect precision by selecting only a very small number of extremely likely items.
In a classification task, a precision score of 1.0 for a class C means that every item labelled as belonging to class C does indeed belong to class C (but says nothing about the number of items from class C that were not labelled correctly) whereas a recall of 1.0 means that every item from class C was labelled as belonging to class C (but says nothing about how many items from other classes were incorrectly also labelled as belonging to class C).
Often, there is an inverse relationship between precision and recall, where it is possible to increase one at the cost of reducing the other. Brain surgery provides an illustrative example of the tradeoff. Consider a brain surgeon removing a cancerous tumor from a patient's brain. The surgeon needs to remove all of the tumor cells since any remaining cancer cells will regenerate the tumor. Conversely, the surgeon must not remove healthy brain cells since that would leave the patient with impaired brain function. The surgeon may be more liberal in the area of the brain they remove to ensure they have extracted all the cancer cells. This decision increases recall but reduces precision. On the other hand, the surgeon may be more conservative in the brain cells they remove to ensure they extracts only cancer cells. This decision increases precision but reduces recall. That is to say, greater recall increases the chances of removing healthy cells (negative outcome) and increases the chances of removing all cancer cells (positive outcome). Greater precision decreases the chances of removing healthy cells (positive outcome) but also decreases the chances of removing all cancer cells (negative outcome).
Usually, precision and recall scores are not discussed in isolation. A precision-recall curve plots precision as a function of recall; usually precision will decrease as the recall increases. Alternatively, values for one measure can be compared for a fixed level at the other measure (e.g. precision at a recall level of 0.75) or both are combined into a single measure. Examples of measures that are a combination of precision and recall are the F-measure (the weighted harmonic mean of precision and recall), or the Matthews correlation coefficient, which is a geometric mean of the chance-corrected variants: the regression coefficientsInformedness (DeltaP') and Markedness (DeltaP).[1][2]Accuracy is a weighted arithmetic mean of Precision and Inverse Precision (weighted by Bias) as well as a weighted arithmetic mean of Recall and Inverse Recall (weighted by Prevalence).[1] Inverse Precision and Inverse Recall are simply the Precision and Recall of the inverse problem where positive and negative labels are exchanged (for both real classes and prediction labels). True Positive Rate and False Positive Rate, or equivalently Recall and 1 - Inverse Recall, are frequently plotted against each other as ROC curves and provide a principled mechanism to explore operating point tradeoffs. Outside of Information Retrieval, the application of Recall, Precision and F-measure are argued to be flawed as they ignore the true negative cell of the contingency table, and they are easily manipulated by biasing the predictions.[1] The first problem is 'solved' by using Accuracy and the second problem is 'solved' by discounting the chance component and renormalizing to Cohen's kappa, but this no longer affords the opportunity to explore tradeoffs graphically. However, Informedness and Markedness are Kappa-like renormalizations of Recall and Precision,[3] and their geometric mean Matthews correlation coefficient thus acts like a debiased F-measure.
Definition
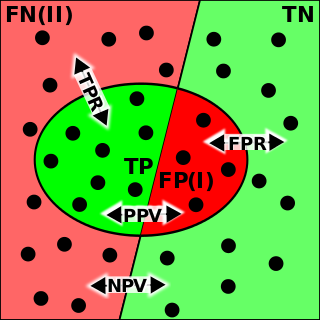
For classification tasks, the terms true positives, true negatives, false positives, and false negatives (see Type I and type II errors for definitions) compare the results of the classifier under test with trusted external judgments. The terms positive and negative refer to the classifier's prediction (sometimes known as the expectation), and the terms true and false refer to whether that prediction corresponds to the external judgment (sometimes known as the observation).
Let us define an experiment from P positive instances and N negative instances for some condition. The four outcomes can be formulated in a 2×2 contingency table or confusion matrix, as follows:
Recall in this context is also referred to as the true positive rate or sensitivity, and precision is also referred to as positive predictive value (PPV); other related measures used in classification include true negative rate and accuracy.[12] True negative rate is also called specificity.
Precision vs. Recall
Both precision and recall may be useful in cases where there is imbalanced data. However, it may be valuable to prioritize one over the other in cases where the outcome of a false positive or false negative is costly. For example, in medical diagnosis, a false positive test can lead to unnecessary treatment and expenses. In this situation, it is useful to value precision over recall. In other cases, the cost of a false negative is high. For instance, the cost of a false negative in fraud detection is high, as failing to detect a fraudulent transaction can result in significant financial loss. [13]
Probabilistic Definition
Precision and recall can be interpreted as (estimated) conditional probabilities:[14] Precision is given by while recall is given by ,[15] where is the predicted class and is the actual class (i.e. means the actual class is positive). Both quantities are, therefore, connected by Bayes' theorem.
No-Skill Classifiers
The probabilistic interpretation allows to easily derive how a no-skill classifier would perform. A no-skill classifiers is defined by the property that the joint probability is just the product of the unconditional probabilites since the classification and the presence of the class are independent.
For example the precision of a no-skill classifier is simply a constant i.e. determined by the probability/frequency with which the class P occurs.
A similar argument can be made for the recall: which is just (the typically threshold dependent) probability for a positive classification.
Some very specific no-skill classifiers are implemented in sklearn and are named dummy classifiers there.[16]
Imbalanced data
Accuracy can be a misleading metric for imbalanced data sets. Consider a sample with 95 negative and 5 positive values. Classifying all values as negative in this case gives 0.95 accuracy score. There are many metrics that don't suffer from this problem. For example, balanced accuracy[17] (bACC) normalizes true positive and true negative predictions by the number of positive and negative samples, respectively, and divides their sum by two:
For the previous example (95 negative and 5 positive samples), classifying all as negative gives 0.5 balanced accuracy score (the maximum bACC score is one), which is equivalent to the expected value of a random guess in a balanced data set. Balanced accuracy can serve as an overall performance metric for a model, whether or not the true labels are imbalanced in the data, assuming the cost of FN is the same as FP.
The TPR and FPR are a property of a given classifier operating at a specific threshold. However, the overall number of TPs, FPs etc depend on the class imbalance in the data via the class ratio . As the recall (or TPR) depends only on positive cases, it is not affected by , but the precision is. We have that
Thus the precision has an explicit dependence on .[18] Starting with balanced classes at and gradually decreasing , the corresponding precision will decrease, because the denominator increases.
Another metric is the predicted positive condition rate (PPCR), which identifies the percentage of the total population that is flagged. For example, for a search engine that returns 30 results (retrieved documents) out of 1,000,000 documents, the PPCR is 0.003%.
According to Saito and Rehmsmeier, precision-recall plots are more informative than ROC plots when evaluating binary classifiers on imbalanced data. In such scenarios, ROC plots may be visually deceptive with respect to conclusions about the reliability of classification performance.[19]
Different from the above approaches, if an imbalance scaling is applied directly by weighting the confusion matrix elements, the standard metrics definitions still apply even in the case of imbalanced datasets.[20] The weighting procedure relates the confusion matrix elements to the support set of each considered class.
A measure that combines precision and recall is the harmonic mean of precision and recall, the traditional F-measure or balanced F-score:
This measure is approximately the average of the two when they are close, and is more generally the harmonic mean, which, for the case of two numbers, coincides with the square of the geometric mean divided by the arithmetic mean. There are several reasons that the F-score can be criticized, in particular circumstances, due to its bias as an evaluation metric.[1] This is also known as the measure, because recall and precision are evenly weighted.
It is a special case of the general measure (for non-negative real values of):
Two other commonly used measures are the measure, which weights recall higher than precision, and the measure, which puts more emphasis on precision than recall.
The F-measure was derived by van Rijsbergen (1979) so that "measures the effectiveness of retrieval with respect to a user who attaches times as much importance to recall as precision". It is based on van Rijsbergen's effectiveness measure , the second term being the weighted harmonic mean of precision and recall with weights . Their relationship is where .
Limitations as goals
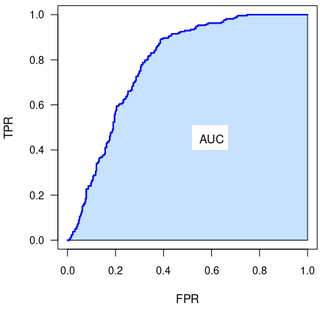
There are other parameters and strategies for performance metric of information retrieval system, such as the area under the ROC curve (AUC)[21] or pseudo-R-squared.
Accuracy and precision are two measures of observational error.
Binary classification is the task of classifying the elements of a set into one of two groups on the basis of a classification rule. Typical binary classification problems include:
A decision tree is a decision support hierarchical model that uses a tree-like model of decisions and their possible consequences, including chance event outcomes, resource costs, and utility. It is one way to display an algorithm that only contains conditional control statements.
Decision tree learning is a supervised learning approach used in statistics, data mining and machine learning. In this formalism, a classification or regression decision tree is used as a predictive model to draw conclusions about a set of observations.
In the field of machine learning and specifically the problem of statistical classification, a confusion matrix, also known as error matrix, is a specific table layout that allows visualization of the performance of an algorithm, typically a supervised learning one; in unsupervised learning it is usually called a matching matrix.
A receiver operating characteristic curve, or ROC curve, is a graphical plot that illustrates the performance of a binary classifier model at varying threshold values.
Given a population whose members each belong to one of a number of different sets or classes, a classification rule or classifier is a procedure by which the elements of the population set are each predicted to belong to one of the classes. A perfect classification is one for which every element in the population is assigned to the class it really belongs to. The bayes classifier is the classifier which assigns classes optimally based on the known attributes of the elements to be classified.
In statistical analysis of binary classification and information retrieval systems, the F-score or F-measure is a measure of predictive performance. It is calculated from the precision and recall of the test, where the precision is the number of true positive results divided by the number of all samples predicted to be positive, including those not identified correctly, and the recall is the number of true positive results divided by the number of all samples that should have been identified as positive. Precision is also known as positive predictive value, and recall is also known as sensitivity in diagnostic binary classification.
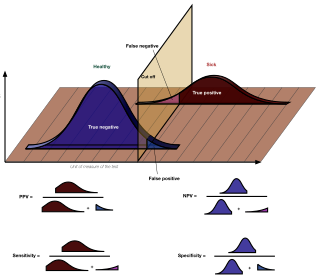
In medicine and statistics, sensitivity and specificity mathematically describe the accuracy of a test that reports the presence or absence of a medical condition. If individuals who have the condition are considered "positive" and those who do not are considered "negative", then sensitivity is a measure of how well a test can identify true positives and specificity is a measure of how well a test can identify true negatives:
In machine learning, multi-label classification or multi-output classification is a variant of the classification problem where multiple nonexclusive labels may be assigned to each instance. Multi-label classification is a generalization of multiclass classification, which is the single-label problem of categorizing instances into precisely one of several classes. In the multi-label problem the labels are nonexclusive and there is no constraint on how many of the classes the instance can be assigned to.
Youden's J statistic is a single statistic that captures the performance of a dichotomous diagnostic test. (Bookmaker) Informedness is its generalization to the multiclass case and estimates the probability of an informed decision.
In statistics, the phi coefficient is a measure of association for two binary variables.
In medical testing with binary classification, the diagnostic odds ratio (DOR) is a measure of the effectiveness of a diagnostic test. It is defined as the ratio of the odds of the test being positive if the subject has a disease relative to the odds of the test being positive if the subject does not have the disease.
The Fowlkes–Mallows index is an external evaluation method that is used to determine the similarity between two clusterings, and also a metric to measure confusion matrices. This measure of similarity could be either between two hierarchical clusterings or a clustering and a benchmark classification. A higher value for the Fowlkes–Mallows index indicates a greater similarity between the clusters and the benchmark classifications. It was invented by Bell Labs statisticians Edward Fowlkes and Collin Mallows in 1983.
The evaluation of binary classifiers compares two methods of assigning a binary attribute, one of which is usually a standard method and the other is being investigated. There are many metrics that can be used to measure the performance of a classifier or predictor; different fields have different preferences for specific metrics due to different goals. For example, in medicine sensitivity and specificity are often used, while in computer science precision and recall are preferred. An important distinction is between metrics that are independent on the prevalence, and metrics that depend on the prevalence – both types are useful, but they have very different properties.
Evaluation measures for an information retrieval (IR) system assess how well an index, search engine, or database returns results from a collection of resources that satisfy a user's query. They are therefore fundamental to the success of information systems and digital platforms.
The accuracy paradox is the paradoxical finding that accuracy is not a good metric for predictive models when classifying in predictive analytics. This is because a simple model may have a high level of accuracy but be too crude to be useful. For example, if the incidence of category A is dominant, being found in 99% of cases, then predicting that every case is category A will have an accuracy of 99%. Precision and recall are better measures in such cases. The underlying issue is that there is a class imbalance between the positive class and the negative class. Prior probabilities for these classes need to be accounted for in error analysis. Precision and recall help, but precision too can be biased by very unbalanced class priors in the test sets.
Fairness in machine learning refers to the various attempts at correcting algorithmic bias in automated decision processes based on machine learning models. Decisions made by computers after a machine-learning process may be considered unfair if they were based on variables considered sensitive. For example gender, ethnicity, sexual orientation or disability. As it is the case with many ethical concepts, definitions of fairness and bias are always controversial. In general, fairness and bias are considered relevant when the decision process impacts people's lives. In machine learning, the problem of algorithmic bias is well known and well studied. Outcomes may be skewed by a range of factors and thus might be considered unfair with respect to certain groups or individuals. An example would be the way social media sites deliver personalized news to consumers.
The Partial Area Under the ROC Curve (pAUC) is a metric for the performance of binary classifier.
P4 metric enables performance evaluation of the binary classifier. It is calculated from precision, recall, specificity and NPV (negative predictive value). P4 is designed in similar way to F1 metric, however addressing the criticisms leveled against F1. It may be perceived as its extension.
↑ Perruchet, P.; Peereman, R. (2004). "The exploitation of distributional information in syllable processing". J. Neurolinguistics. 17 (2–3): 97–119. doi:10.1016/s0911-6044(03)00059-9. S2CID17104364.
↑ Powers, David M. W. (2012). "The Problem with Kappa". Conference of the European Chapter of the Association for Computational Linguistics (EACL2012) Joint ROBUS-UNSUP Workshop.
↑ Brooks, Harold; Brown, Barb; Ebert, Beth; Ferro, Chris; Jolliffe, Ian; Koh, Tieh-Yong; Roebber, Paul; Stephenson, David (2015-01-26). "WWRP/WGNE Joint Working Group on Forecast Verification Research". Collaboration for Australian Weather and Climate Research. World Meteorological Organisation. Retrieved 2019-07-17.
↑ Fatih Cakir, Kun He, Xide Xia, Brian Kulis, Stan Sclaroff, Deep Metric Learning to Rank, In Proc. IEEE Conference on Computer Vision and Pattern Recognition (CVPR), 2019.
Baeza-Yates, Ricardo; Ribeiro-Neto, Berthier (1999). Modern Information Retrieval. New York, NY: ACM Press, Addison-Wesley, Seiten 75 ff. ISBN0-201-39829-X
Hjørland, Birger (2010); The foundation of the concept of relevance, Journal of the American Society for Information Science and Technology, 61(2), 217-237
This page is based on this Wikipedia article Text is available under the CC BY-SA 4.0 license; additional terms may apply. Images, videos and audio are available under their respective licenses.