Scoring rule

Last updated
Visualization of the expected score under various predictions from some common scoring functions. Dashed black line: forecaster's true belief, red: linear, orange: spherical, purple: quadratic, green: log. Scoring functions.gif
Visualization of the expected score under various predictions from some common scoring functions. Dashed black line: forecaster's true belief, red: linear, orange: spherical, purple: quadratic, green: log.

In decision theory, a scoring rule [1] provides are evaluation metrics for probabilistic predictions or forecasts. While "regular" loss functions (such as mean squared error) assign a goodness-of-fit score to a predicted value and an observed value, scoring rules assign such a score to a predicted probability distribution and an observed value. On the other hand, a scoring function [2] provides a summary measure for the evaluation of point predictions, i.e. one predicts a property or functional , like the expectation or the median.

Contents

The average logarithmic score of 10.000 points i.i.d. sampled from a standard normal distribution (blue histogram), evaluated on a variety of distributions (red line). Although not neccesarily true for individual points, on average, a proper scoring rule will give the lowest score if the predicted distribution matches the data distribution. Logarithmic score.png
The average logarithmic score of 10.000 points i.i.d. sampled from a standard normal distribution (blue histogram), evaluated on a variety of distributions (red line). Although not neccesarily true for individual points, on average, a proper scoring rule will give the lowest score if the predicted distribution matches the data distribution.
A calibration curve allows to judge how well model predictions are calibrated, by comparing the predicted quantiles to the observed quantiles. Blue is the best calibrated model, see calibration (statistics). Calibration plot.png
A calibration curve allows to judge how well model predictions are calibrated, by comparing the predicted quantiles to the observed quantiles. Blue is the best calibrated model, see calibration (statistics).

Scoring rules are aimed at answering the question "how good is a predicted probability distribution compared to an observation?" An important property of scoring rules is (strict) propriety. In essence, (strictly) proper scoring rules are proven to have the lowest expected score, if the predicted distribution equals the underlying distribution of the target variable. Although this might differ for individual observations, this should result in a minimization of the expected score if the "correct" distributions are predicted.

Scoring rules and scoring functions are often used as "cost functions" or "loss functions" of probabilistic forecasting models. They are evaluated as the empirical mean of a given sample, the "score". Scores of different predictions or models can then be compared to conclude which model is best. For example, consider a model, that predicts (based on an input ) a mean and standard deviation . Together, those variables define a gaussian distribution , in essence predicting the target variable as a probability distribution. A common interpretation of probabilistic models is that they aim to quantify their own predictive uncertainty. In this example, an observed target variable is then held compared to the predicted distribution and assigned a score . When training on a scoring rule, it should "teach" a probabilistic model to predict when its uncertainty is low, and when its uncertainty is high, and it should result in calibrated predictions, while minimizing the predictive uncertainty.

Although the example given concerns the probabilistic forecasting of a realvalued target variable, a variety of different scoring rules has been designed, with different target variables in mind. Scoring rules exist for binary and categorical probabilistic classification, as well as univariate and multivariate probabilistic regression.

Definitions

Consider a sample space , a σ-algebra of subsets of and a convex class of probability measures on . A function defined on and taking values in the extended real line, , is -quasi-integrable if it is measurable with respect to and is quasi-integrable with respect to all .

Probabilistic forecast

A probabilistic forecast is any probability measure . I.e. it is a distribution of potential future observations.

Scoring rule

A scoring rule is any extended real-valued function such that is -quasi-integrable for all . represents the loss or penalty when the forecast is issued and the observation materializes.

Point forecast

A point forecast is a functional, i.e. a potentially set-valued mapping .

Scoring function

A scoring function is any real-valued function where represents the loss or penalty when the point forecast is issued and the observation materializes.

Orientation

Scoring rules and scoring functions are negatively (positively) oriented if smaller (larger) values mean better. Here we adhere to negative orientation, hence the association with "loss".

Expected Score

We write for the expected score of a prediction under as the expected score of the predicted distribution , when sampling observations from distribution .

Sample average score

Many probabilistic forecasting models are training via the sample average score, in which a set of predicted distributions is evaluated against a set of observations .

Propriety and consistency

Strictly proper scoring rules and strictly consistent scoring functions encourage honest forecasts by maximization of the expected reward: If a forecaster is given a reward of if realizes (e.g. ), then the highest expected reward (lowest score) is obtained by reporting the true probability distribution. [1]

Proper scoring rules

A scoring rule is proper relative to if (assuming negative orientation) its expected score is minimized when the forecasted distribution matches the distribution of the observation.

for all .

It is strictly proper if the above equation holds with equality if and only if .

Consistent scoring functions

A scoring function is consistent for the functional relative to the class if

for all , all and all .

It is strictly consistent if it is consistent and equality in the above equation implies that .

Example application of scoring rules

The logarithmic rule LogScore.png
The logarithmic rule

An example of probabilistic forecasting is in meteorology where a weather forecaster may give the probability of rain on the next day. One could note the number of times that a 25% probability was quoted, over a long period, and compare this with the actual proportion of times that rain fell. If the actual percentage was substantially different from the stated probability we say that the forecaster is poorly calibrated. A poorly calibrated forecaster might be encouraged to do better by a bonus system. A bonus system designed around a proper scoring rule will incentivize the forecaster to report probabilities equal to his personal beliefs. [3]

In addition to the simple case of a binary decision, such as assigning probabilities to 'rain' or 'no rain', scoring rules may be used for multiple classes, such as 'rain', 'snow', or 'clear', or continuous responses like the amount of rain per day.

The image to the right shows an example of a scoring rule, the logarithmic scoring rule, as a function of the probability reported for the event that actually occurred. One way to use this rule would be as a cost based on the probability that a forecaster or algorithm assigns, then checking to see which event actually occurs.

Examples of proper scoring rules

There are an infinite number of scoring rules, including entire parameterized families of strictly proper scoring rules. The ones shown below are simply popular examples.

Categorical variables

For a categorical response variable with mutually exclusive events, , a probabilistic forecaster or algorithm will return a probability vector with a probability for each of the outcomes.

Logarithmic score

Expected value of logarithmic rule, when Event 1 is expected to occur with probability of 0.8, the blue line is described by the function
0.8
log
[?]
(
x
)
+
(
1
-
0.8
)
log
[?]
(
1
-
x
)
{\displaystyle 0.8\log(x)+(1-0.8)\log(1-x)} ExpectedLog.png
Expected value of logarithmic rule, when Event 1 is expected to occur with probability of 0.8, the blue line is described by the function

The logarithmic scoring rule is a local strictly proper scoring rule. This is also the negative of surprisal, which is commonly used as a scoring criterion in Bayesian inference; the goal is to minimize expected surprise. This scoring rule has strong foundations in information theory.

Here, the score is calculated as the logarithm of the probability estimate for the actual outcome. That is, a prediction of 80% that correctly proved true would receive a score of ln(0.8) = −0.22. This same prediction also assigns 20% likelihood to the opposite case, and so if the prediction proves false, it would receive a score based on the 20%: ln(0.2) = −1.6. The goal of a forecaster is to maximize the score and for the score to be as large as possible, and −0.22 is indeed larger than −1.6.

If one treats the truth or falsity of the prediction as a variable x with value 1 or 0 respectively, and the expressed probability as p, then one can write the logarithmic scoring rule as x ln(p) + (1 − x) ln(1 − p). Note that any logarithmic base may be used, since strictly proper scoring rules remain strictly proper under linear transformation. That is:

is strictly proper for all .

Brier/Quadratic score

The quadratic scoring rule is a strictly proper scoring rule

where is the probability assigned to the correct answer and is the number of classes.

The Brier score, originally proposed by Glenn W. Brier in 1950, [4] can be obtained by an affine transform from the quadratic scoring rule.

Where when the th event is correct and otherwise and is the number of classes.

An important difference between these two rules is that a forecaster should strive to maximize the quadratic score yet minimize the Brier score . This is due to a negative sign in the linear transformation between them.

Hyvärinen scoring rule

The Hyvärinen scoring function (of a density p) is defined by [5]

Where denotes the Hessian trace and denotes the gradient. This scoring rule can be used to computationally simplify parameter inference and address Bayesian model comparison with arbitrarily-vague priors. [5] [6] It was also used to introduce new information-theoretic quantities beyond the existing information theory. [7]

Spherical score

The spherical scoring rule is also a strictly proper scoring rule

Ranked Probability Score

The ranked probability score [8] (RPS) is a strictly proper scoring rule, that can be expressed as:

Where when the th event is correct and otherwise, and is the number of classes. Other than other scoring rules, the ranked probability score considers the distance between classes, i.e. classes 1 and 2 are considered closer than classes 1 and 3. The score assigns better scores to probabilistic forecasts with high probabilities assigned to classes close to the correct class. For example, when considering probabilistic forecasts and , we find that , while , despite both probabilistic forecasts assigning identical probability to the correct class.

Comparison of categorical strictly proper scoring rules

Shown below on the left is a graphical comparison of the Logarithmic, Quadratic, and Spherical scoring rules for a binary classification problem. The x-axis indicates the reported probability for the event that actually occurred.

It is important to note that each of the scores have different magnitudes and locations. The magnitude differences are not relevant however as scores remain proper under affine transformation. Therefore, to compare different scores it is necessary to move them to a common scale. A reasonable choice of normalization is shown at the picture on the right where all scores intersect the points (0.5,0) and (1,1). This ensures that they yield 0 for a uniform distribution (two probabilities of 0.5 each), reflecting no cost or reward for reporting what is often the baseline distribution. All normalized scores below also yield 1 when the true class is assigned a probability of 1.

Score of a binary classification for the true class showing logarithmic (blue), spherical (green), and quadratic (red) RawScore.png
Score of a binary classification for the true class showing logarithmic (blue), spherical (green), and quadratic (red)
Normalized score of a binary classification for the true class showing logarithmic (blue), spherical (green), and quadratic (red) NormalizedScore.png
Normalized score of a binary classification for the true class showing logarithmic (blue), spherical (green), and quadratic (red)

Univariate continuous variables

The scoring rules listed below aim to evaluate probabilistic predictions when the predicted distributions are univariate continuous probability distribution's, i.e. the predicted distributions are defined over a univariate target variable and have a probability density function .

Logarithmic score for continuous variables

The logarithmic score is a local strictly proper scoring rule. It is defined as

where denotes the probability density function of the predicted distribution . It is a local, strictly proper scoring rule. The logarithmic score for continuous variables has strong ties to Maximum likelihood estimation. However, in many applications, the continuous ranked probability score is often preferred over the logarithmic scaore, as the logarithmic score can be heavily influenced by slight deviations in the tail densities of forecasted distributions. [9]

Continuous ranked probability score

Illustration of the continuous ranked probability score (CRPS). Given a sample y and a predicted cumulative distribution F, the CRPS is given by computing the difference between the curves at each point x of the support, squaring it and integrating it over the whole support. Illustration CRPS.png
Illustration of the continuous ranked probability score (CRPS). Given a sample y and a predicted cumulative distribution F, the CRPS is given by computing the difference between the curves at each point x of the support, squaring it and integrating it over the whole support.

The continuous ranked probability score (CRPS) [10] is a strictly proper scoring rule much used in meteorology. It is defined as

where is the cumulative distribution function of the forecasted distribution , is the Heaviside step function and is the observation. For distributions with finite first moment, the continuous ranked probability score can be written as: [1]

where and are independent random variables, sampled from the distribution . Furthermore, when the cumulative probability function is continuous, the continuous ranked probability score can also be written as [11]

The continuous ranked probability score can be seen as both an continuous extension of the ranked probability score, as well as quantile regression. The continuous ranked probability score over the empirical distribution of an ordered set points (i.e. every point has probability of occurring), is equal to twice the mean quantile loss applied on those points with evenly spread quantiles : [12]

For many popular families of distributions, closed-form expressions for the continuous ranked probability score have been derived. The continuous ranked probability score has been used as a loss function for artificial neural networks, in which weather forecasts are postprocessed to a Gaussian probability distribution. [13] [14]

Multivariate continuous variables

The scoring rules listed below aim to evaluate probabilistic predictions when the predicted distributions are univariate continuous probability distribution's, i.e. the predicted distributions are defined over a multivariate target variable and have a probability density function .

Multivariate logarithmic score

The multivariate logarithmic score is similar to the univariate logarithmic score:

where denotes the probability density function of the predicted multivariate distribution . It is a local, strictly proper scoring rule.

Energy score

The energy score is a multivariate extension of the continuous ranked probability score: [1]

Here, , denotes the -dimensional Euclidean distance and are independently sampled random variables from the probability distribution . The energy score is strictly proper for distributions for which is finite. It has been suggested that the energy score is somewhat ineffective when evaluating the intervariable dependency structure of the forecasted multivariate distribution. [15] The energy score is equal to twice the energy distance between the predicted distribution and the empirical distribution of the observation.

Variogram score

The variogram score of order is given by: [16]

Here, are weights, often set to 1, and can be arbitrarily chosen, but or are often used. is here to denote the 'th marginal random variable of . The variogram score is proper for distributions for which the 'th moment is finite for all components, but is never strictly proper. Compared to the energy score, the variogram score is claimed to be more discriminative with respect to the predicted correlation structure.

Conditional continuous ranked probability score

The conditional continuous ranked probability score (Conditional CRPS or CCRPS) is a family of (strictly) proper scoring rules. Conditional CRPS evaluates a forecasted multivariate distribution by evaluation of CRPS over a prescribed set of univariate conditional probability distributions of the predicted multivariate distribution: [17]

Here, is the 'th marginal variable of , is a set of tuples that defines a conditional specification (with and ), and denotes the conditional probability distribution for given that all variables for are equal to their respective observations. In the case that is ill-defined (i.e. its conditional event has zero likelihood), CRPS scores over this distribution are defined as infinite. Conditional CRPS is strictly proper for distributions with finite first moment, if the chain rule is included in the conditional specification, meaning that there exists a permutation of such that for all : .

Interpretation of proper scoring rules

All proper scoring rules are equal to weighted sums (integral with a non-negative weighting functional) of the losses in a set of simple two-alternative decision problems that use the probabilistic prediction, each such decision problem having a particular combination of associated cost parameters for false positive and false negative decisions. A strictly proper scoring rule corresponds to having a nonzero weighting for all possible decision thresholds. Any given proper scoring rule is equal to the expected losses with respect to a particular probability distribution over the decision thresholds; thus the choice of a scoring rule corresponds to an assumption about the probability distribution of decision problems for which the predicted probabilities will ultimately be employed, with for example the quadratic loss (or Brier) scoring rule corresponding to a uniform probability of the decision threshold being anywhere between zero and one. The classification accuracy score (percent classified correctly), a single-threshold scoring rule which is zero or one depending on whether the predicted probability is on the appropriate side of 0.5, is a proper scoring rule but not a strictly proper scoring rule because it is optimized (in expectation) not only by predicting the true probability but by predicting any probability on the same side of 0.5 as the true probability. [18] [19] [20] [21] [22] [23]

Characteristics

Affine transformation

A strictly proper scoring rule, whether binary or multiclass, after an affine transformation remains a strictly proper scoring rule. [3] That is, if is a strictly proper scoring rule then with is also a strictly proper scoring rule, though if then the optimization sense of the scoring rule switches between maximization and minimization.

Locality

A proper scoring rule is said to be local if its estimate for the probability of a specific event depends only on the probability of that event. This statement is vague in most descriptions but we can, in most cases, think of this as the optimal solution of the scoring problem "at a specific event" is invariant to all changes in the observation distribution that leave the probability of that event unchanged. All binary scores are local because the probability assigned to the event that did not occur is determined so there is no degree of flexibility to vary over.

Affine functions of the logarithmic scoring rule are the only strictly proper local scoring rules on a finite set that is not binary.

Decomposition

The expectation value of a proper scoring rule can be decomposed into the sum of three components, called uncertainty, reliability, and resolution, [24] [25] which characterize different attributes of probabilistic forecasts:

If a score is proper and negatively oriented (such as the Brier Score), all three terms are positive definite. The uncertainty component is equal to the expected score of the forecast which constantly predicts the average event frequency. The reliability component penalizes poorly calibrated forecasts, in which the predicted probabilities do not coincide with the event frequencies.

The equations for the individual components depend on the particular scoring rule. For the Brier Score, they are given by

where is the average probability of occurrence of the binary event , and is the conditional event probability, given , i.e.

See also

Literature

Related Research Articles

<span class="mw-page-title-main">Multivariate normal distribution</span> Generalization of the one-dimensional normal distribution to higher dimensions

In probability theory and statistics, the multivariate normal distribution, multivariate Gaussian distribution, or joint normal distribution is a generalization of the one-dimensional (univariate) normal distribution to higher dimensions. One definition is that a random vector is said to be k-variate normally distributed if every linear combination of its k components has a univariate normal distribution. Its importance derives mainly from the multivariate central limit theorem. The multivariate normal distribution is often used to describe, at least approximately, any set of (possibly) correlated real-valued random variables, each of which clusters around a mean value.

In statistics, maximum likelihood estimation (MLE) is a method of estimating the parameters of an assumed probability distribution, given some observed data. This is achieved by maximizing a likelihood function so that, under the assumed statistical model, the observed data is most probable. The point in the parameter space that maximizes the likelihood function is called the maximum likelihood estimate. The logic of maximum likelihood is both intuitive and flexible, and as such the method has become a dominant means of statistical inference.

<span class="mw-page-title-main">Fokker–Planck equation</span> Partial differential equation

In statistical mechanics and information theory, the Fokker–Planck equation is a partial differential equation that describes the time evolution of the probability density function of the velocity of a particle under the influence of drag forces and random forces, as in Brownian motion. The equation can be generalized to other observables as well. The Fokker-Planck equation has multiple applications in information theory, graph theory, data science, finance, economics etc.

<span class="mw-page-title-main">Indicator function</span> Mathematical function characterizing set membership

In mathematics, an indicator function or a characteristic function of a subset of a set is a function that maps elements of the subset to one, and all other elements to zero. That is, if A is a subset of some set X, then if and otherwise, where is a common notation for the indicator function. Other common notations are and

In probability theory and statistics, a Gaussian process is a stochastic process, such that every finite collection of those random variables has a multivariate normal distribution. The distribution of a Gaussian process is the joint distribution of all those random variables, and as such, it is a distribution over functions with a continuous domain, e.g. time or space.

Vapnik–Chervonenkis theory was developed during 1960–1990 by Vladimir Vapnik and Alexey Chervonenkis. The theory is a form of computational learning theory, which attempts to explain the learning process from a statistical point of view.

Statistical learning theory is a framework for machine learning drawing from the fields of statistics and functional analysis. Statistical learning theory deals with the statistical inference problem of finding a predictive function based on data. Statistical learning theory has led to successful applications in fields such as computer vision, speech recognition, and bioinformatics.

In information theory, the cross-entropy between two probability distributions and , over the same underlying set of events, measures the average number of bits needed to identify an event drawn from the set when the coding scheme used for the set is optimized for an estimated probability distribution , rather than the true distribution .

In statistics and information theory, a maximum entropy probability distribution has entropy that is at least as great as that of all other members of a specified class of probability distributions. According to the principle of maximum entropy, if nothing is known about a distribution except that it belongs to a certain class, then the distribution with the largest entropy should be chosen as the least-informative default. The motivation is twofold: first, maximizing entropy minimizes the amount of prior information built into the distribution; second, many physical systems tend to move towards maximal entropy configurations over time.

The Brier Score is a strictly proper score function or strictly proper scoring rule that measures the accuracy of probabilistic predictions. For unidimensional predictions, it is strictly equivalent to the mean squared error as applied to predicted probabilities.

In operator theory, a branch of mathematics, a positive-definite kernel is a generalization of a positive-definite function or a positive-definite matrix. It was first introduced by James Mercer in the early 20th century, in the context of solving integral operator equations. Since then, positive-definite functions and their various analogues and generalizations have arisen in diverse parts of mathematics. They occur naturally in Fourier analysis, probability theory, operator theory, complex function-theory, moment problems, integral equations, boundary-value problems for partial differential equations, machine learning, embedding problem, information theory, and other areas.

In probability theory and statistics, a stochastic order quantifies the concept of one random variable being "bigger" than another. These are usually partial orders, so that one random variable may be neither stochastically greater than, less than, nor equal to another random variable . Many different orders exist, which have different applications.

In multilinear algebra, the tensor rank decomposition or rank-R decomposition is the decomposition of a tensor as a sum of R rank-1 tensors, where R is minimal. Computing this decomposition is an open problem.

In probability theory, a Markov kernel is a map that in the general theory of Markov processes plays the role that the transition matrix does in the theory of Markov processes with a finite state space.

In cryptography, learning with errors (LWE) is a mathematical problem that is widely used to create secure encryption algorithms. It is based on the idea of representing secret information as a set of equations with errors. In other words, LWE is a way to hide the value of a secret by introducing noise to it. In more technical terms, it refers to the computational problem of inferring a linear -ary function over a finite ring from given samples some of which may be erroneous. The LWE problem is conjectured to be hard to solve, and thus to be useful in cryptography.

<span class="mw-page-title-main">Logit-normal distribution</span>

In probability theory, a logit-normal distribution is a probability distribution of a random variable whose logit has a normal distribution. If Y is a random variable with a normal distribution, and t is the standard logistic function, then X = t(Y) has a logit-normal distribution; likewise, if X is logit-normally distributed, then Y = logit(X)= log (X/(1-X)) is normally distributed. It is also known as the logistic normal distribution, which often refers to a multinomial logit version (e.g.).

In machine learning, the kernel embedding of distributions comprises a class of nonparametric methods in which a probability distribution is represented as an element of a reproducing kernel Hilbert space (RKHS). A generalization of the individual data-point feature mapping done in classical kernel methods, the embedding of distributions into infinite-dimensional feature spaces can preserve all of the statistical features of arbitrary distributions, while allowing one to compare and manipulate distributions using Hilbert space operations such as inner products, distances, projections, linear transformations, and spectral analysis. This learning framework is very general and can be applied to distributions over any space on which a sensible kernel function may be defined. For example, various kernels have been proposed for learning from data which are: vectors in , discrete classes/categories, strings, graphs/networks, images, time series, manifolds, dynamical systems, and other structured objects. The theory behind kernel embeddings of distributions has been primarily developed by Alex Smola, Le Song , Arthur Gretton, and Bernhard Schölkopf. A review of recent works on kernel embedding of distributions can be found in.

In statistics, the complex Wishart distribution is a complex version of the Wishart distribution. It is the distribution of times the sample Hermitian covariance matrix of zero-mean independent Gaussian random variables. It has support for Hermitian positive definite matrices.

Poisson-type random measures are a family of three random counting measures which are closed under restriction to a subspace, i.e. closed under thinning. They are the only distributions in the canonical non-negative power series family of distributions to possess this property and include the Poisson distribution, negative binomial distribution, and binomial distribution. The PT family of distributions is also known as the Katz family of distributions, the Panjer or (a,b,0) class of distributions and may be retrieved through the Conway–Maxwell–Poisson distribution.

In computational and mathematical biology, a biological lattice-gas cellular automaton (BIO-LGCA) is a discrete model for moving and interacting biological agents, a type of cellular automaton. The BIO-LGCA is based on the lattice-gas cellular automaton (LGCA) model used in fluid dynamics. A BIO-LGCA model describes cells and other motile biological agents as point particles moving on a discrete lattice, thereby interacting with nearby particles. Contrary to classic cellular automaton models, particles in BIO-LGCA are defined by their position and velocity. This allows to model and analyze active fluids and collective migration mediated primarily through changes in momentum, rather than density. BIO-LGCA applications include cancer invasion and cancer progression.
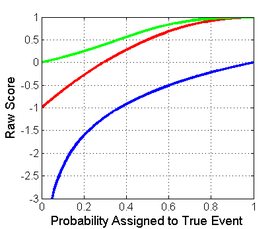
References

  1. 1 2 3 4 Gneiting, Tilmann; Raftery, Adrian E. (2007). "Strictly Proper Scoring Rules, Prediction, and Estimation" (PDF). Journal of the American Statistical Association. 102 (447): 359–378. doi:10.1198/016214506000001437. S2CID   1878582.
  2. Gneiting, Tilmann (2011). "Making and Evaluating Point Forecasts". Journal of the American Statistical Association. 106 (494): 746–762. arXiv: 0912.0902 . doi:10.1198/jasa.2011.r10138. S2CID   88518170.
  3. 1 2 Bickel, E.J. (2007). "Some Comparisons among Quadratic, Spherical, and Logarithmic Scoring Rules" (PDF). Decision Analysis. 4 (2): 49–65. doi:10.1287/deca.1070.0089.
  4. Brier, G.W. (1950). "Verification of forecasts expressed in terms of probability" (PDF). Monthly Weather Review. 78 (1): 1–3. Bibcode:1950MWRv...78....1B. doi:10.1175/1520-0493(1950)078<0001:VOFEIT>2.0.CO;2.
  5. 1 2 Hyvärinen, Aapo (2005). "Estimation of Non-Normalized Statistical Models by Score Matching". Journal of Machine Learning Research. 6 (24): 695–709. ISSN   1533-7928.
  6. Shao, Stephane; Jacob, Pierre E.; Ding, Jie; Tarokh, Vahid (2019-10-02). "Bayesian Model Comparison with the Hyvärinen Score: Computation and Consistency". Journal of the American Statistical Association. 114 (528): 1826–1837. arXiv: 1711.00136 . doi:10.1080/01621459.2018.1518237. ISSN   0162-1459. S2CID   52264864.
  7. Ding, Jie; Calderbank, Robert; Tarokh, Vahid (2019). "Gradient Information for Representation and Modeling". Advances in Neural Information Processing Systems. 32: 2396–2405.
  8. Epstein, Edward S. (1969-12-01). "A Scoring System for Probability Forecasts of Ranked Categories". Journal of Applied Meteorology and Climatology. 8 (6). American Meteorological Society: 985–987. doi:10.1175/1520-0450(1969)008<0985:ASSFPF>2.0.CO;2 . Retrieved 2024-05-02.
  9. Bjerregård, Mathias Blicher; Møller, Jan Kloppenborg; Madsen, Henrik (2021). "An introduction to multivariate probabilistic forecast evaluation". Energy and AI. 4. Elsevier BV: 100058. doi: 10.1016/j.egyai.2021.100058 . ISSN   2666-5468.
  10. Zamo, Michaël; Naveau, Philippe (2018-02-01). "Estimation of the Continuous Ranked Probability Score with Limited Information and Applications to Ensemble Weather Forecasts". Mathematical Geosciences. 50 (2): 209–234. doi: 10.1007/s11004-017-9709-7 . ISSN   1874-8953. S2CID   125989069.
  11. Taillardat, Maxime; Mestre, Olivier; Zamo, Michaël; Naveau, Philippe (2016-06-01). "Calibrated Ensemble Forecasts Using Quantile Regression Forests and Ensemble Model Output Statistics" (PDF). Monthly Weather Review. 144 (6). American Meteorological Society: 2375–2393. doi:10.1175/mwr-d-15-0260.1. ISSN   0027-0644.
  12. Bröcker, Jochen (2012). "Evaluating raw ensembles with the continuous ranked probability score". Quarterly Journal of the Royal Meteorological Society. 138 (667): 1611–1617. doi:10.1002/qj.1891. ISSN   0035-9009.
  13. Rasp, Stephan; Lerch, Sebastian (2018-10-31). "Neural Networks for Postprocessing Ensemble Weather Forecasts". Monthly Weather Review. 146 (11). American Meteorological Society: 3885–3900. arXiv: 1805.09091 . doi:10.1175/mwr-d-18-0187.1. ISSN   0027-0644.
  14. Grönquist, Peter; Yao, Chengyuan; Ben-Nun, Tal; Dryden, Nikoli; Dueben, Peter; Li, Shigang; Hoefler, Torsten (2021-04-05). "Deep learning for post-processing ensemble weather forecasts". Philosophical Transactions of the Royal Society A: Mathematical, Physical and Engineering Sciences. 379 (2194): 20200092. arXiv: 2005.08748 . doi:10.1098/rsta.2020.0092. ISSN   1364-503X. PMID   33583263.
  15. Pinson, Pierre; Tastu, Julija (2013). "Discrimination ability of the Energy score". Technical University of Denmark. Retrieved 2024-05-11.
  16. Scheuerer, Michael; Hamill, Thomas M. (2015-03-31). "Variogram-Based Proper Scoring Rules for Probabilistic Forecasts of Multivariate Quantities*". Monthly Weather Review. 143 (4). American Meteorological Society: 1321–1334. doi:10.1175/mwr-d-14-00269.1. ISSN   0027-0644.
  17. Roordink, Daan; Hess, Sibylle (2023). "Scoring Rule Nets: Beyond Mean Target Prediction in Multivariate Regression". Machine Learning and Knowledge Discovery in Databases: Research Track. Vol. 14170. Cham: Springer Nature Switzerland. p. 190–205. doi:10.1007/978-3-031-43415-0_12. ISBN   978-3-031-43414-3.
  18. Leonard J. Savage. Elicitation of personal probabilities and expectations. J. of the American Stat. Assoc., 66(336):783–801, 1971.
  19. Schervish, Mark J. (1989). "A General Method for Comparing Probability Assessors", Annals of Statistics17(4) 1856–1879, https://projecteuclid.org/euclid.aos/1176347398
  20. Rosen, David B. (1996). "How good were those probability predictions? The expected recommendation loss (ERL) scoring rule". In Heidbreder, G. (ed.). Maximum Entropy and Bayesian Methods (Proceedings of the Thirteenth International Workshop, August 1993). Kluwer, Dordrecht, The Netherlands. CiteSeerX   10.1.1.52.1557 .
  21. Roulston, M. S., & Smith, L. A. (2002). Evaluating probabilistic forecasts using information theory. Monthly Weather Review, 130, 1653–1660. See APPENDIX "Skill Scores and Cost–Loss".
  22. "Loss Functions for Binary Class Probability Estimation and Classification: Structure and Applications", Andreas Buja, Werner Stuetzle, Yi Shen (2005) http://citeseerx.ist.psu.edu/viewdoc/summary?doi=10.1.1.184.5203
  23. Hernandez-Orallo, Jose; Flach, Peter; and Ferri, Cesar (2012). "A Unified View of Performance Metrics: Translating Threshold Choice into Expected Classification Loss." Journal of Machine Learning Research13 2813–2869. http://www.jmlr.org/papers/volume13/hernandez-orallo12a/hernandez-orallo12a.pdf
  24. Murphy, A.H. (1973). "A new vector partition of the probability score". Journal of Applied Meteorology. 12 (4): 595–600. Bibcode:1973JApMe..12..595M. doi: 10.1175/1520-0450(1973)012<0595:ANVPOT>2.0.CO;2 .
  25. Bröcker, J. (2009). "Reliability, sufficiency, and the decomposition of proper scores" (PDF). Quarterly Journal of the Royal Meteorological Society. 135 (643): 1512–1519. arXiv: 0806.0813 . Bibcode:2009QJRMS.135.1512B. doi:10.1002/qj.456. S2CID   15880012.