Related Research Articles

Uncertainty refers to epistemic situations involving imperfect or unknown information. It applies to predictions of future events, to physical measurements that are already made, or to the unknown. Uncertainty arises in partially observable or stochastic environments, as well as due to ignorance, indolence, or both. It arises in any number of fields, including insurance, philosophy, physics, statistics, economics, finance, medicine, psychology, sociology, engineering, metrology, meteorology, ecology and information science.
In statistical inference, specifically predictive inference, a prediction interval is an estimate of an interval in which a future observation will fall, with a certain probability, given what has already been observed. Prediction intervals are often used in regression analysis.
There are two main uses of the term calibration in statistics that denote special types of statistical inference problems. "Calibration" can mean

Mathematical statistics is the application of probability theory, a branch of mathematics, to statistics, as opposed to techniques for collecting statistical data. Specific mathematical techniques which are used for this include mathematical analysis, linear algebra, stochastic analysis, differential equations, and measure theory.

The Weather Prediction Center (WPC), located in College Park, Maryland, is one of nine service centers under the umbrella of the National Centers for Environmental Prediction (NCEP), a part of the National Weather Service (NWS), which in turn is part of the National Oceanic and Atmospheric Administration (NOAA) of the U.S. Government. Until March 5, 2013 the Weather Prediction Center was known as the Hydrometeorological Prediction Center (HPC). The Weather Prediction Center serves as a center for quantitative precipitation forecasting, medium range forecasting, and the interpretation of numerical weather prediction computer models.
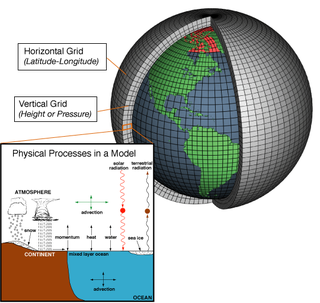
Numerical weather prediction (NWP) uses mathematical models of the atmosphere and oceans to predict the weather based on current weather conditions. Though first attempted in the 1920s, it was not until the advent of computer simulation in the 1950s that numerical weather predictions produced realistic results. A number of global and regional forecast models are run in different countries worldwide, using current weather observations relayed from radiosondes, weather satellites and other observing systems as inputs.
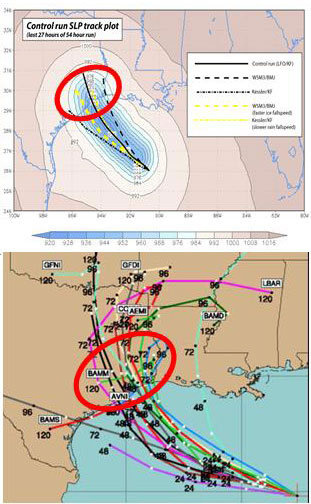
Ensemble forecasting is a method used in or within numerical weather prediction. Instead of making a single forecast of the most likely weather, a set of forecasts is produced. This set of forecasts aims to give an indication of the range of possible future states of the atmosphere. Ensemble forecasting is a form of Monte Carlo analysis. The multiple simulations are conducted to account for the two usual sources of uncertainty in forecast models: (1) the errors introduced by the use of imperfect initial conditions, amplified by the chaotic nature of the evolution equations of the atmosphere, which is often referred to as sensitive dependence on initial conditions; and (2) errors introduced because of imperfections in the model formulation, such as the approximate mathematical methods to solve the equations. Ideally, the verified future atmospheric state should fall within the predicted ensemble spread, and the amount of spread should be related to the uncertainty (error) of the forecast. In general, this approach can be used to make probabilistic forecasts of any dynamical system, and not just for weather prediction.
The Brier Score is a strictly proper score function or strictly proper scoring rule that measures the accuracy of probabilistic predictions. For unidimensional predictions, it is strictly equivalent to the mean squared error as applied to predicted probabilities.
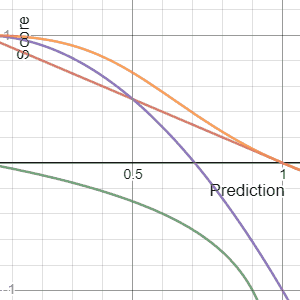
In decision theory, a scoring rule provides a summary measure for the evaluation of probabilistic predictions or forecasts. It is applicable to tasks in which predictions assign probabilities to events, i.e. one issues a probability distribution as prediction. This includes probabilistic classification of a set of mutually exclusive outcomes or classes.

A tropical cyclone forecast model is a computer program that uses meteorological data to forecast aspects of the future state of tropical cyclones. There are three types of models: statistical, dynamical, or combined statistical-dynamic. Dynamical models utilize powerful supercomputers with sophisticated mathematical modeling software and meteorological data to calculate future weather conditions. Statistical models forecast the evolution of a tropical cyclone in a simpler manner, by extrapolating from historical datasets, and thus can be run quickly on platforms such as personal computers. Statistical-dynamical models use aspects of both types of forecasting. Four primary types of forecasts exist for tropical cyclones: track, intensity, storm surge, and rainfall. Dynamical models were not developed until the 1970s and the 1980s, with earlier efforts focused on the storm surge problem.
In weather forecasting, model output statistics (MOS) is a multiple linear regression technique in which predictands, often near-surface quantities, are related statistically to one or more predictors. The predictors are typically forecasts from a numerical weather prediction (NWP) model, climatic data, and, if applicable, recent surface observations. Thus, output from NWP models can be transformed by the MOS technique into sensible weather parameters that are familiar to a layperson.
The European Flood Awareness System is a European Commission initiative to increase preparedness for riverine floods across Europe.

The quantitative precipitation forecast is the expected amount of melted precipitation accumulated over a specified time period over a specified area. A QPF will be created when precipitation amounts reaching a minimum threshold are expected during the forecast's valid period. Valid periods of precipitation forecasts are normally synoptic hours such as 00:00, 06:00, 12:00 and 18:00 GMT. Terrain is considered in QPFs by use of topography or based upon climatological precipitation patterns from observations with fine detail. Starting in the mid-to-late 1990s, QPFs were used within hydrologic forecast models to simulate impact to rivers throughout the United States. Forecast models show significant sensitivity to humidity levels within the planetary boundary layer, or in the lowest levels of the atmosphere, which decreases with height. QPF can be generated on a quantitative, forecasting amounts, or a qualitative, forecasting the probability of a specific amount, basis. Radar imagery forecasting techniques show higher skill than model forecasts within 6 to 7 hours of the time of the radar image. The forecasts can be verified through use of rain gauge measurements, weather radar estimates, or a combination of both. Various skill scores can be determined to measure the value of the rainfall forecast.
Used in a number of sciences, ranging from econometrics to meteorology, consensus forecasts are predictions of the future that are created by combining several separate forecasts which have often been created using different methodologies. Also known as combining forecasts, forecast averaging or model averaging and committee machines, ensemble averaging or expert aggregation. Applications can range from forecasting the weather to predicting the annual Gross Domestic Product of a country or the number of cars a company or an individual dealer is likely to sell in a year. While forecasts are often made for future values of a time series, they can also be for one-off events such as the outcome of a presidential election or a football match.

In machine learning, a probabilistic classifier is a classifier that is able to predict, given an observation of an input, a probability distribution over a set of classes, rather than only outputting the most likely class that the observation should belong to. Probabilistic classifiers provide classification that can be useful in its own right or when combining classifiers into ensembles.
The cost-loss model, also called the cost/loss model or the cost-loss decision model, is a model used to understand how the predicted probability of adverse events affects the decision of whether to take a costly precautionary measure to protect oneself against losses from that event. The threshold probability above which it makes sense to take the precautionary measure equals the ratio of the cost of the preventative measure to the loss averted, and this threshold is termed the cost/loss ratio or cost-loss ratio. The model is typically used in the context of using prediction about weather conditions to decide whether to take a precautionary measure or not.
Quantile Regression Averaging (QRA) is a forecast combination approach to the computation of prediction intervals. It involves applying quantile regression to the point forecasts of a small number of individual forecasting models or experts. It has been introduced in 2014 by Jakub Nowotarski and Rafał Weron and originally used for probabilistic forecasting of electricity prices and loads. Despite its simplicity it has been found to perform extremely well in practice - the top two performing teams in the price track of the Global Energy Forecasting Competition (GEFCom2014) used variants of QRA.
Electricity price forecasting (EPF) is a branch of energy forecasting which focuses on predicting the spot and forward prices in wholesale electricity markets. Over the last 15 years electricity price forecasts have become a fundamental input to energy companies’ decision-making mechanisms at the corporate level.
Non-homogeneous Gaussian regression (NGR) is a type of statistical regression analysis used in the atmospheric sciences as a way to convert ensemble forecasts into probabilistic forecasts. Relative to simple linear regression, NGR uses the ensemble spread as an additional predictor, which is used to improve the prediction of uncertainty and allows the predicted uncertainty to vary from case to case. The prediction of uncertainty in NGR is derived from both past forecast errors statistics and the ensemble spread. NGR was originally developed for site-specific medium range temperature forecasting, but has since also been applied to site-specific medium-range wind forecasting and to seasonal forecasts, and has been adapted for precipitation forecasting. The introduction of NGR was the first demonstration that probabilistic forecasts that take account of the varying ensemble spread could achieve better skill scores than forecasts based on standard Model output statistics approaches applied to the ensemble mean.
References
- ↑ Wilks, D.S. (2005), Statistical Methods in the Atmospheric Sciences, Second Edition. (International geophysics series, Volume 91). Academic Press. ISBN 0-12-751966-1
- ↑ Toth, Z. and Kalnay, E. (1997), "Ensemble Forecasting at NCEP and the Breeding Method", Monthly Weather Review, 125, pp. 3298.
- ↑ Little, M.A. et al. (2009), "Generalized Linear Models for Site-Specific Density Forecasting of UK Daily Rainfall". Monthly Weather Review, 37(3), 1029–1045
- ↑ Kabir, H. M. Dipu; Khosravi, Abbas; Hosen, Mohammad Anwar; Nahavandi, Saeid (2018). "Neural Network-Based Uncertainty Quantification: A Survey of Methodologies and Applications". IEEE Access. 6: 36218–36234. doi: 10.1109/access.2018.2836917 . ISSN 2169-3536.
- ↑ "Consensus Economics - Economic Forecasts and Indicators".
- ↑ Garratt, Anthony; Lee, Kevin; Pesaran, M. Hashem; Shin, Yongcheol (December 2003). "Forecast Uncertainties in Macroeconomic Modeling: An Application to the U.K. Economy" (PDF). Journal of the American Statistical Association. 98 (464): 829–838. doi:10.1198/016214503000000765. JSTOR 30045334. S2CID 120465353 . Retrieved 27 February 2023.
- ↑ http://www.mas.gov.sg/~/media/resource/publications/macro_review/2015/MROct15_Macroeconomic%20Review.pdf ,pp. 92-97
- ↑ Weron, Rafał (2014). [Open Access]. "Electricity price forecasting: A review of the state-of-the-art with a look into the future". International Journal of Forecasting. 30 (4): 1030–1081. doi: 10.1016/j.ijforecast.2014.08.008 .
- ↑ "Call For Papers: Probabilistic Energy Forecasting | International Journal of Forecasting". blog.drhongtao.com. Retrieved 2015-11-29.
- ↑ Nowotarski, Jakub; Weron, Rafał (2015). [Open Access]. "Computing electricity spot price prediction intervals using quantile regression and forecast averaging" (PDF). Computational Statistics. 30 (3): 791–803. doi: 10.1007/s00180-014-0523-0 . ISSN 0943-4062.
- ↑ Wilson, T.; Bell, M. (2007). "Probabilistic Regional Population Forecasts: The Example of Queensland, Australia". Geographical Analysis. 39: 1–25. doi: 10.1111/j.1538-4632.2006.00693.x .
- ↑ Jolliffe, I.T., Stephenson, D.B. (2003) Forecast Verification: A Practitioner's Guide in Atmospheric Science. Wiley. ISBN 0-471-49759-2
- ↑ Schölzel, C., A. Hense (2011): Probabilistic assessment of regional climate change in Southwest Germany by ensemble dressing, Climate Dynamics 36 (9), 2003-2014
- ↑ Gneiting, T. and Raftery, A.E. (2007), "Strictly Proper Scoring Rules, Prediction, and Estimation". Journal of the American Statistical Association , 102, pp. 359–378