Biostatistics is a branch of statistics that applies statistical methods to a wide range of topics in biology. It encompasses the design of biological experiments, the collection and analysis of data from those experiments and the interpretation of the results.

Statistics is the discipline that concerns the collection, organization, analysis, interpretation, and presentation of data. In applying statistics to a scientific, industrial, or social problem, it is conventional to begin with a statistical population or a statistical model to be studied. Populations can be diverse groups of people or objects such as "all people living in a country" or "every atom composing a crystal". Statistics deals with every aspect of data, including the planning of data collection in terms of the design of surveys and experiments.

A statistical hypothesis test is a method of statistical inference used to decide whether the data sufficiently support a particular hypothesis. A statistical hypothesis test typically involves a calculation of a test statistic. Then a decision is made, either by comparing the test statistic to a critical value or equivalently by evaluating a p-value computed from the test statistic. Roughly 100 specialized statistical tests have been defined.
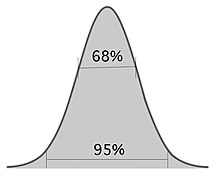
In statistical hypothesis testing, a result has statistical significance when a result at least as "extreme" would be very infrequent if the null hypothesis were true. More precisely, a study's defined significance level, denoted by , is the probability of the study rejecting the null hypothesis, given that the null hypothesis is true; and the p-value of a result, , is the probability of obtaining a result at least as extreme, given that the null hypothesis is true. The result is statistically significant, by the standards of the study, when . The significance level for a study is chosen before data collection, and is typically set to 5% or much lower—depending on the field of study.
Binary classification is the task of classifying the elements of a set into one of two groups on the basis of a classification rule. Typical binary classification problems include:
In scientific research, the null hypothesis is the claim that the effect being studied does not exist. Note that the term "effect" here is not meant to imply a causative relationship.
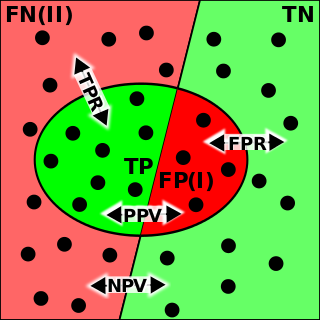
In statistics, the power of a binary hypothesis test is the probability that the test correctly rejects the null hypothesis when a specific alternative hypothesis is true. It is commonly denoted by , and represents the chances of a true positive detection conditional on the actual existence of an effect to detect. Statistical power ranges from 0 to 1, and as the power of a test increases, the probability of making a type II error by wrongly failing to reject the null hypothesis decreases.
In evidence-based medicine, likelihood ratios are used for assessing the value of performing a diagnostic test. They use the sensitivity and specificity of the test to determine whether a test result usefully changes the probability that a condition exists. The first description of the use of likelihood ratios for decision rules was made at a symposium on information theory in 1954. In medicine, likelihood ratios were introduced between 1975 and 1980.

The positive and negative predictive values are the proportions of positive and negative results in statistics and diagnostic tests that are true positive and true negative results, respectively. The PPV and NPV describe the performance of a diagnostic test or other statistical measure. A high result can be interpreted as indicating the accuracy of such a statistic. The PPV and NPV are not intrinsic to the test ; they depend also on the prevalence. Both PPV and NPV can be derived using Bayes' theorem.
In statistics, the false discovery rate (FDR) is a method of conceptualizing the rate of type I errors in null hypothesis testing when conducting multiple comparisons. FDR-controlling procedures are designed to control the FDR, which is the expected proportion of "discoveries" that are false. Equivalently, the FDR is the expected ratio of the number of false positive classifications to the total number of positive classifications. The total number of rejections of the null include both the number of false positives (FP) and true positives (TP). Simply put, FDR = FP /. FDR-controlling procedures provide less stringent control of Type I errors compared to family-wise error rate (FWER) controlling procedures, which control the probability of at least one Type I error. Thus, FDR-controlling procedures have greater power, at the cost of increased numbers of Type I errors.
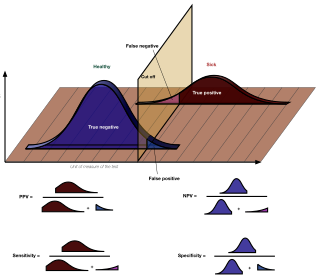
In medicine and statistics, sensitivity and specificity mathematically describe the accuracy of a test that reports the presence or absence of a medical condition. If individuals who have the condition are considered "positive" and those who do not are considered "negative", then sensitivity is a measure of how well a test can identify true positives and specificity is a measure of how well a test can identify true negatives:
In statistical hypothesis testing, a type I error, or a false positive, is the rejection of the null hypothesis when it is actually true. For example, an innocent person may be convicted. A type II error, or a false negative, is the failure to reject a null hypothesis that is actually false. For example: a guilty person may be not convicted.
In statistics, the Bonferroni correction is a method to counteract the multiple comparisons problem.
In statistics, the multiple comparisons, multiplicity or multiple testing problem occurs when one considers a set of statistical inferences simultaneously or estimates a subset of parameters selected based on the observed values.
In statistics, when performing multiple comparisons, a false positive ratio is the probability of falsely rejecting the null hypothesis for a particular test. The false positive rate is calculated as the ratio between the number of negative events wrongly categorized as positive and the total number of actual negative events.

"Why Most Published Research Findings Are False" is a 2005 essay written by John Ioannidis, a professor at the Stanford School of Medicine, and published in PLOS Medicine. It is considered foundational to the field of metascience.

In medical testing with binary classification, the diagnostic odds ratio (DOR) is a measure of the effectiveness of a diagnostic test. It is defined as the ratio of the odds of the test being positive if the subject has a disease relative to the odds of the test being positive if the subject does not have the disease.
In statistics, a false coverage rate (FCR) is the average rate of false coverage, i.e. not covering the true parameters, among the selected intervals.
The evaluation of binary classifiers compares two methods of assigning a binary attribute, one of which is usually a standard method and the other is being investigated. There are many metrics that can be used to measure the performance of a classifier or predictor; different fields have different preferences for specific metrics due to different goals. For example, in medicine sensitivity and specificity are often used, while in computer science precision and recall are preferred. An important distinction is between metrics that are independent on the prevalence, and metrics that depend on the prevalence – both types are useful, but they have very different properties.
A false positive is an error in binary classification in which a test result incorrectly indicates the presence of a condition, while a false negative is the opposite error, where the test result incorrectly indicates the absence of a condition when it is actually present. These are the two kinds of errors in a binary test, in contrast to the two kinds of correct result. They are also known in medicine as a false positivediagnosis, and in statistical classification as a false positiveerror.