Economic Freedom of the World

Last updated
Economic Freedom of the World
Economic Freedom of the World.png
2021 Economic Freedom of the World report from the Fraser Institute
AuthorsJames Gwartney, Robert A. Lawson, Joshua C. Hall, Ryan Murphy, Robbie Butler, John Considine, Hugo J. Faria, Rosemarie Fike, Fred McMahon, Hugo M. Montesinos-Yufa, Dean Stansel, Meg Tuszynski [1]
Cover artistHeather Jalbout [1]
CountryCanada [1]
LanguageEnglish, French, Spanish, Bosnian, German, Italian [1]
Publisher Fraser Institute [1]
Publication date
2016 [1]
ISBN 978-0-88975-408-9 (2016 edition)
OCLC 45197922
LC Class HC10 .E3746 HB95E36 [1]
Website freetheworld.com [1]

Economic Freedom of the World is an annual survey published by the Fraser Institute, a Canadian think tank. [1] The survey attempts to measure the degree of economic freedom in the world's nations. It has been used in peer-reviewed studies, some of which have found a range of beneficial effects of more economic freedom. [2]

Contents

History

One of the earliest measures of economic freedom was developed by Freedom House, which has done extensive work on the measurement of political and cultural freedom. This measure incorporated a range of indicators including freedom to establish a business and freedom of union organisation. [3]

Partly in response to dissatisfaction with the Freedom House index from advocates of a libertarian or market liberal viewpoint, Milton Friedman and Michael Walker of the Fraser Institute hosted a series of conferences on economic freedom. Eventually this resulted in a report on worldwide economic freedom, Economic Freedom of the World. The Heritage Foundation and The Wall Street Journal later created another similar index, the Index of Economic Freedom . [4]

Method

The participants in the conferences reached a consensus that the cornerstones of economic freedom are: personal choice rather than collective choice, voluntary exchange coordinated by markets rather than allocation via the political process, freedom to enter and compete in markets, protection of persons and their property from aggression by others. [5] The 2005 report states "When the functions of the minimal state—protection of people and their property from the actions of aggressors, enforcement of contracts, and provision of the limited set of public goods like roads, flood control projects, and money of stable value—are performed well, but the government does little else, a country's rating on the EFW summary index will be high. Correspondingly, as government expenditures increase and regulations expand, a country's rating will decline." [5] In practice, the index measures: size of government (expenditures, taxes, and enterprises, legal structure), security of property rights, access to sound money, freedom to trade internationally, and regulation of credit, labor, and business. [5] The report uses 42 distinct variables, from for example the World Bank, to measure this. Some examples: tax rates, degree of juridical independence, inflation rates, costs of importing, and regulated prices. Each of the 5 areas above is given equal weight in the final score. [5]

Research

Charts showing economic freedom, as defined in Economic Freedom of the World, and various other indicators. The red bars shows nations with less economic freedom, the green bars those with more. Economic Freedom Charts.png
Charts showing economic freedom, as defined in Economic Freedom of the World, and various other indicators. The red bars shows nations with less economic freedom, the green bars those with more.

Economic freedom has been shown to correlate strongly with higher average income per person, higher income of the poorest 10%, higher life expectancy, higher literacy, lower infant mortality, higher access to water sources and less corruption. The share of income in percent going to the poorest 10% is the same for both more and less economically free countries. [6]

The people living in the top one-fifth of the most free countries enjoy an average income of $23,450 and a growth rate in the 1990s of 2.56 percent per year; in contrast, the bottom one-fifth in the rankings had an average income of just $2,556 and a -0.85 percent growth rate in the 1990s. The poorest 10 percent of the population have an average income of just $728 in the least free countries compared with over $7,000 in the most free countries. The life expectancy of people living in the most free nations is 20 years longer than for people in the least free countries. [7]

Higher economic freedom, as measured by both The Heritage Foundation and Fraser Institute indices, correlates strongly with higher self-reported happiness [8] and is significant in preventing wars. Economic freedom is around 54 times more effective than democracy (as measured by Democracy Score) in diminishing violent conflict. [9]

Regarding environmental health, studies have found no or a positive effect. More important may be the Kuznets curve. Most environmental health indicators, such as water and air pollution show an inverted U-shape. Meaning in the beginning of economic development, little weight is given to environmental concerns, raising pollution along with industrialization. After a threshold, when basic physical needs are met and a middle class is established, interest in a clean environment rises, reversing the trend. [10]

Studies show that more economic freedom is the cause of beneficial effects and that Economic Freedom of the World was used for most of the research, partly because Index of Economic Freedom only goes back to 1995 and because it uses more subjective variables. [10]

Influence

Hundreds of peer-reviewed articles have used the index and it has been used in economic research, political science, and environmental research. [11] The Economic Freedom of the World index has been more widely used than any other measure of economic freedom, because of its coverage of a longer time period. [12] In 2016 the report was cited in 412 independent research journals. [13] In 2016 and 2017 Free Malaysia Today and National Review quoted the report. [14]

Criticisms

The correlation between economic freedom and growth has been criticized by studies. De Haan and Siermann find that the relationship is not robust. [15] Heckelman and Stroup argue that the weighting procedure used in the construction of the index is arbitrary. [16] They examine the components of the index individually and find that many—including a low top marginal tax rate—are negatively, rather than positively correlated with economic growth. A frequent criticism is that China, and other developing nations, have high growth rates but relatively low economic freedom. Developing nations can have higher growth rates than developed nations, as they have cheap labor and can import investment, technology and organizational skills from rich countries.

When examining the subcomponents of the index, any positive effect that a low level of taxes might have is more disputed than the importance of rule of law, lack of political corruption, low inflation, and functioning property rights. Many northern European nations such as Iceland (#23), Denmark (#13), Finland (#21) and Sweden (#35), have extensive welfare states, which are strongly opposed by advocates of laissez-faire. It is argued these countries have less regulation than most others, and research using the Ease of Doing Business Index suggests that the effect of business regulations is more important than government consumption. [17] The Global Competitiveness Report looks at several other factors that affect economic growth such as infrastructure, health, and education.

Although the World Bank does not believe that laissez-faire policies, if they allow large inequalities of wealth to develop, are an effective way to achieve this goal, it is a strong supporter of the importance of economic growth for reducing poverty. It argues that an overview of many studies shows that: growth is fundamental for poverty reduction, and in principle growth as such does not seem to affect inequality, growth accompanied by a more egalitarian distribution of wealth is better than growth alone, high initial income inequality is a brake on poverty reduction, poverty itself is also likely to be a barrier for poverty reduction, and wealth inequality seems to predict lower future growth rates. [18] In 2011, the IMF Economic Review published an article that found countries with higher economic freedom and more liberal credit market regulation suffered more in output growth during the late-2000s financial crisis. [19] In 2014, a working paper published by the International Labour Organization said some of the methodology used in the Rigidity of Employment index sub-components, was not useful. [20]

2017 ratings in 2019 Annual Report

Map showing summary index scores of countries according to 2017 data from the 2019 Annual Report
.mw-parser-output .legend{page-break-inside:avoid;break-inside:avoid-column}.mw-parser-output .legend-color{display:inline-block;min-width:1.25em;height:1.25em;line-height:1.25;margin:1px 0;text-align:center;border:1px solid black;background-color:transparent;color:black}.mw-parser-output .legend-text{}
>8
7.5-8
7-7.5
6.5-7
6-6.5
5.5-6
5-5.5
<5
Data unavailable 2019 Economic Freedom of the World.png
Map showing summary index scores of countries according to 2017 data from the 2019 Annual Report
  >8
  7.5–8
  7–7.5
  6.5–7
  6–6.5
  5.5–6
  5–5.5
  <5
  Data unavailable

Below are the ratings of countries for 2017, based on the 2019 Annual Report. [21] In 2017, Hong Kong and Singapore were in first and second place respectively; the next highest-scoring countries are New Zealand, Switzerland, United States, Ireland, United Kingdom, Canada, Australia and Mauritius. The lowest-scoring countries are Iraq, Republic of the Congo, Egypt, Syria, Democratic Republic of the Congo, Angola, Algeria, Sudan, Libya, and lastly, Venezuela.

RankCountrySummary index
1Flag of Hong Kong.svg  Hong Kong 8.91
2Flag of Singapore.svg  Singapore 8.71
3Flag of New Zealand.svg  New Zealand 8.50
4Flag of Switzerland (Pantone).svg   Switzerland 8.40
5Flag of the United States.svg  United States 8.19
6Flag of Ireland.svg  Ireland 8.13
7Flag of the United Kingdom.svg  United Kingdom 8.09
8Flag of Canada (Pantone).svg  Canada 8.08
9Flag of Australia (converted).svg  Australia 8.07
9Flag of Mauritius.svg  Mauritius 8.07
11Flag of Malta.svg  Malta 7.97
12Flag of Georgia.svg  Georgia 7.94
13Flag of Chile.svg  Chile 7.89
13Flag of Denmark.svg  Denmark 7.89
13Flag of Estonia.svg  Estonia 7.89
16Flag of Lithuania.svg  Lithuania 7.88
17Flag of Japan.svg  Japan 7.86
17Flag of Luxembourg.svg  Luxembourg 7.86
19Flag of the Republic of China.svg  Taiwan 7.85
20Flag of Germany.svg  Germany 7.82
21Flag of Finland.svg  Finland 7.80
22Flag of the Czech Republic.svg  Czech Republic 7.75
23Flag of Iceland.svg  Iceland 7.74
24Flag of Latvia.svg  Latvia 7.73
25Flag of the Netherlands.svg  Netherlands 7.72
26Flag of Austria.svg  Austria 7.71
27Flag of Armenia.svg  Armenia 7.70
28Flag of Cyprus.svg  Cyprus 7.68
28Flag of Romania.svg  Romania 7.68
30Flag of Albania.svg  Albania 7.67
31Flag of Panama.svg  Panama 7.66
32Flag of Norway.svg  Norway 7.62
33Flag of South Korea.svg  South Korea 7.59
34Flag of Guatemala.svg  Guatemala 7.57
35Flag of Sweden.svg  Sweden 7.56
36Flag of Spain.svg  Spain 7.55
37Flag of Bulgaria.svg  Bulgaria 7.54
38Flag of Israel.svg  Israel 7.53
39Flag of Portugal.svg  Portugal 7.52
40Flag of Belgium (civil).svg  Belgium 7.51
40Flag of Slovakia.svg  Slovakia 7.51
42Flag of Peru.svg  Peru 7.49
43Flag of Cambodia.svg  Cambodia 7.44
43Flag of Jordan.svg  Jordan 7.44
45Flag of Mongolia.svg  Mongolia 7.43
46Flag of Costa Rica.svg  Costa Rica 7.41
46Flag of Italy.svg  Italy 7.41
48Flag of Uganda.svg  Uganda 7.39
49Flag of Botswana.svg  Botswana 7.37
50Flag of Bahrain.svg  Bahrain 7.35
50Flag of France.svg  France 7.35
52Flag of Malaysia.svg  Malaysia 7.34
53Flag of the Philippines.svg  Philippines 7.32
54Flag of Hungary.svg  Hungary 7.27
54Flag of Indonesia.svg  Indonesia 7.27
56Flag of Croatia.svg  Croatia 7.26
56Flag of Rwanda.svg  Rwanda 7.26
58Flag of the Bahamas.svg  Bahamas 7.25
59Flag of Poland.svg  Poland 7.24
60Flag of The Gambia.svg  Gambia 7.23
61Flag of Jamaica.svg  Jamaica 7.17
61Flag of the United Arab Emirates.svg  United Arab Emirates 7.17
63Flag of Cape Verde.svg  Cape Verde 7.16
63Flag of El Salvador.svg  El Salvador 7.16
65Flag of Honduras.svg  Honduras 7.16
65Flag of Seychelles.svg  Seychelles 7.16
67Flag of Slovenia.svg  Slovenia 7.15
68Flag of Kazakhstan.svg  Kazakhstan 7.10
69Flag of Qatar.svg  Qatar 7.07
70Flag of Kenya.svg  Kenya 7.05
70Flag of Uruguay.svg  Uruguay 7.05
72Flag of Paraguay.svg  Paraguay 7.03
73Flag of North Macedonia.svg  Macedonia 7.02
74Flag of Nicaragua.svg  Nicaragua 7.01
75Flag of Lebanon.svg  Lebanon 6.97
76Flag of Mexico.svg  Mexico 6.93
77Flag of the Dominican Republic.svg  Dominican Republic 6.92
77Flag of Kyrgyzstan (2023).svg  Kyrgyzstan 6.92
79Flag of India.svg  India 6.91
80Flag of Serbia.svg  Serbia 6.89
81Flag of Nigeria.svg  Nigeria 6.86
81Flag of Thailand.svg  Thailand 6.86
83Flag of Montenegro.svg  Montenegro 6.84
83Flag of Zambia.svg  Zambia 6.84
85Flag of Belize.svg  Belize 6.78
85Flag of Russia.svg  Russia 6.78
87Flag of Bhutan.svg  Bhutan 6.77
87Flag of Tanzania.svg  Tanzania 6.77
89Flag of Oman.svg  Oman 6.76
90Flag of Fiji.svg  Fiji 6.74
91Flag of Trinidad and Tobago.svg  Trinidad and Tobago 6.70
92Flag of Bosnia and Herzegovina.svg  Bosnia and Herzegovina 6.69
92Flag of Morocco.svg  Morocco 6.69
94Flag of Colombia.svg  Colombia 6.68
95Flag of Laos.svg  Laos 6.67
95Flag of Turkey.svg  Turkey 6.67
97Flag of Moldova.svg  Moldova 6.66
98Flag of Suriname.svg  Suriname 6.65
99Flag of Belarus.svg  Belarus 6.64
100Flag of Brunei.svg  Brunei 6.62
101Flag of South Africa.svg  South Africa 6.61
102Flag of Greece.svg  Greece 6.59
103Flag of Ghana.svg  Ghana 6.58
104Flag of Sri Lanka.svg  Sri Lanka 6.57
105Flag of Liberia.svg  Liberia 6.56
106Flag of Namibia.svg  Namibia 6.53
107Flag of Saudi Arabia.svg  Saudi Arabia 6.52
107Flag of Eswatini.svg  Swaziland 6.52
109Flag of Lesotho.svg  Lesotho 6.50
110Flag of Haiti.svg  Haiti 6.49
110Flag of Nepal.svg    Nepal 6.49
112Flag of Barbados.svg  Barbados 6.45
113Flag of the People's Republic of China.svg  China 6.42
114Flag of Kuwait.svg  Kuwait 6.41
115Flag of Papua New Guinea.svg  Papua New Guinea 6.36
116Flag of Azerbaijan.svg  Azerbaijan 6.34
117Flag of Guyana.svg  Guyana 6.32
118Flag of Ecuador.svg  Ecuador 6.28
119Flag of Vietnam.svg  Vietnam 6.27
120Flag of Brazil.svg  Brazil 6.23
121Flag of Togo.svg  Togo 6.21
122Flag of Tunisia.svg  Tunisia 6.20
123Flag of Bangladesh.svg  Bangladesh 6.18
124Flag of Burundi.svg  Burundi 6.17
124Flag of Senegal.svg  Senegal 6.17
126Bandera de Bolivia (Estado).svg  Bolivia 6.14
126Flag of Madagascar.svg  Madagascar 6.14
128Flag of Mauritania.svg  Mauritania 6.11
129Flag of Benin.svg  Benin 6.08
130Flag of Burkina Faso.svg  Burkina Faso 6.07
131Flag of Malawi.svg  Malawi 6.06
132Flag of Tajikistan.svg  Tajikistan 6.05
133Flag of East Timor.svg  East Timor 5.99
134Flag of Cote d'Ivoire.svg  Ivory Coast 5.97
135Flag of Ukraine.svg  Ukraine 5.96
136Flag of Mali.svg  Mali 5.91
136Flag of Pakistan.svg  Pakistan 5.91
138Flag of Gabon.svg  Gabon 5.88
139Flag of Guinea.svg  Guinea 5.86
140Flag of Cameroon.svg  Cameroon 5.84
140Flag of Yemen.svg  Yemen 5.84
142Flag of Niger.svg  Niger 5.83
143Flag of Ethiopia.svg  Ethiopia 5.72
143Flag of Iran.svg  Iran 5.72
145Flag of Zimbabwe.svg  Zimbabwe 5.69
146Flag of Argentina.svg  Argentina 5.67
147Flag of Myanmar.svg  Myanmar 5.63
148Flag of Sierra Leone.svg  Sierra Leone 5.63
149Flag of Mozambique.svg  Mozambique 5.60
150Flag of Chad.svg  Chad 5.42
151Flag of the Central African Republic.svg  Central African Republic 5.23
151Flag of Guinea-Bissau.svg  Guinea-Bissau 5.23
153Flag of Iraq.svg  Iraq 5.21
154Flag of the Republic of the Congo.svg  Republic of the Congo 5.08
155Flag of Egypt.svg  Egypt 5.05
155Flag of Syria.svg  Syria 5.05
157Flag of the Democratic Republic of the Congo.svg  Democratic Republic of the Congo 5.00
158Flag of Angola.svg  Angola 4.83
159Flag of Algeria.svg  Algeria 4.77
160Flag of Sudan.svg  Sudan 4.67
161Flag of Libya.svg  Libya 4.45
162Flag of Venezuela.svg  Venezuela 2.58

Past reports

Trend

The Economic Freedom of the World 2005 report stated that the world economic freedom score has grown considerably over the last few decades. By its measure, the average score has increased from 5.17 in 1985 to 6.4. Of the nations in 1985, 95 nations increased their score, seven saw a decline, and six were unchanged. [22]

2013 ratings in 2015 Annual Report

Economic Freedom Ratings for 2013, [23] including 157 countries and 119 positions which may be shared by two or more countries.

RankCountrySummary
index
Previous rank [24] Difference
1Flag of Hong Kong.svg  Hong Kong 8.978.97Steady2.svg 0
2Flag of Singapore.svg  Singapore 8.528.73Decrease2.svg 0.21
3Flag of New Zealand.svg  New Zealand 8.198.49Decrease2.svg 0.30
4Flag of Switzerland (Pantone).svg   Switzerland 8.168.30Decrease2.svg 0.14
5Flag of the United Arab Emirates.svg  United Arab Emirates 8.158.07Increase2.svg 0.08
6Flag of Mauritius.svg  Mauritius 8.088.01Increase2.svg 0.07
7Flag of Jordan.svg  Jordan 7.937.81Increase2.svg 0.12
8Flag of Ireland.svg  Ireland 7.907.66Increase2.svg 0.24
9Flag of Canada (Pantone).svg  Canada 7.897.93Decrease2.svg 0.08
10Flag of Chile.svg  Chile 7.877.87Steady2.svg 0
11Flag of the United Kingdom.svg  United Kingdom 7.877.85Increase2.svg 0.02
12Flag of Australia (converted).svg  Australia 7.837.88Decrease2.svg 0.05
13Flag of Georgia.svg  Georgia 7.837.61Increase2.svg 0.22
14Flag of Qatar.svg  Qatar 7.777.62Increase2.svg 0.15
15Flag of the Republic of China.svg  Taiwan 7.767.77Decrease2.svg 0.01
16Flag of the United States.svg  United States 7.737.73Steady2.svg 0
17Flag of Romania.svg  Romania 7.697.32Increase2.svg 0.17
18Flag of Armenia.svg  Armenia 7.677.62Increase2.svg 0.05
19Flag of Finland.svg  Finland 7.617.98Decrease2.svg 0.37
20Flag of Lithuania.svg  Lithuania 7.617.61Steady2.svg 0
21Flag of Malta.svg  Malta 7.617.65Decrease2.svg 0.04
22Flag of Denmark.svg  Denmark 7.587.78Decrease2.svg 0.20
23Flag of Estonia.svg  Estonia 7.587.76Decrease2.svg 0.18
24Flag of Bahrain.svg  Bahrain 7.557.93Decrease2.svg 0.38
25Flag of Costa Rica.svg  Costa Rica 7.537.11Increase2.svg 0.42
26Flag of Japan.svg  Japan 7.527.50Increase2.svg 0.02
27Flag of Luxembourg.svg  Luxembourg 7.517.49Increase2.svg 0.02
28Flag of Norway.svg  Norway 7.517.56Decrease2.svg 0.05
29Flag of Germany.svg  Germany 7.507.68Decrease2.svg 0.18
30Flag of the Netherlands.svg  Netherlands 7.487.57Decrease2.svg 0.09
31Flag of Austria.svg  Austria 7.467.59Decrease2.svg 0.13
32Flag of Kuwait.svg  Kuwait 7.467.22Increase2.svg 0.24
33Flag of Guatemala.svg  Guatemala 7.457.21Increase2.svg 0.14
34Flag of Rwanda.svg  Rwanda 7.437.46Decrease2.svg 0.03
35Flag of Latvia.svg  Latvia 7.427.31Increase2.svg 0.11
36Flag of Portugal.svg  Portugal 7.427.34Increase2.svg 0.09
37Flag of the Bahamas.svg  Bahamas 7.407.40Steady2.svg 0
38Flag of Nicaragua.svg  Nicaragua 7.407.23Increase2.svg 0.17
39Flag of Israel.svg  Israel 7.387.26Increase2.svg 0.12
40Flag of South Korea.svg  South Korea 7.387.50Decrease2.svg 0.22
41Flag of Peru.svg  Peru 7.347.64Decrease2.svg 0.30
42Flag of Bulgaria.svg  Bulgaria 7.337.26Increase2.svg 0.07
43Flag of the Czech Republic.svg  Czech Republic 7.337.25Increase2.svg 0.18
44Flag of Jamaica.svg  Jamaica 7.337.12Increase2.svg 0.21
45Flag of Sweden.svg  Sweden 7.337.59Decrease2.svg 0.16
46Flag of Uganda.svg  Uganda 7.307.10Increase2.svg 0.20
47Flag of Poland.svg  Poland 7.297.20Increase2.svg 0.09
48Flag of Slovakia.svg  Slovakia 7.297.46Decrease2.svg 0.17
49Flag of Honduras.svg  Honduras 7.277.21Increase2.svg 0.06
50Flag of Panama.svg  Panama 7.277.08Increase2.svg 0.19
51Flag of Spain.svg  Spain 7.277.53Decrease2.svg 0.26
52Flag of Belgium (civil).svg  Belgium 7.267.36Decrease2.svg 0.10
53Flag of Cambodia.svg  Cambodia 7.267.02Increase2.svg 0.24
54Flag of Kazakhstan.svg  Kazakhstan 7.266.84Increase2.svg 0.42
55Flag of El Salvador.svg  El Salvador 7.257.03Increase2.svg 0.22
56Flag of Hungary.svg  Hungary 7.257.59Decrease2.svg 0.34
57Flag of the Dominican Republic.svg  Dominican Republic 7.237.13Increase2.svg 0.10
58Flag of Malaysia.svg  Malaysia 7.227.06Increase2.svg 0.16
59Flag of Oman.svg  Oman 7.217.31Decrease2.svg 0.10
60Flag of North Macedonia.svg  Macedonia 7.197.05Increase2.svg 0.14
61Flag of Mongolia.svg  Mongolia 7.197.06Increase2.svg 0.13
62Flag of Albania.svg  Albania 7.187.27Decrease2.svg 0.09
63Flag of Brunei.svg  Brunei 7.187.05Increase2.svg 0.13
64Flag of Montenegro.svg  Montenegro 7.187.26Decrease2.svg 0.08
65Flag of Uruguay.svg  Uruguay 7.187.35Decrease2.svg 0.17
66Flag of Kenya.svg  Kenya 7.166.81Increase2.svg 0.35
67Flag of the Philippines.svg  Philippines 7.147.21Decrease2.svg 0.07
68Flag of Botswana.svg  Botswana 7.137.25Decrease2.svg 0.12
69Flag of Italy.svg  Italy 7.136.85Increase2.svg 0.28
70Flag of France.svg  France 7.127.38Decrease2.svg 0.26
71Flag of The Gambia.svg  Gambia 7.126.98Increase2.svg 0.14
72Flag of Papua New Guinea.svg  Papua New Guinea 7.116.96Increase2.svg 0.15
73Flag of Seychelles.svg  Seychelles 7.07-
74Flag of Trinidad and Tobago.svg  Trinidad and Tobago 7.076.95Increase2.svg 0.12
75Flag of Cyprus.svg  Cyprus 7.037.72Decrease2.svg 0.69
76Flag of Indonesia.svg  Indonesia 7.016.90Increase2.svg 0.11
77Flag of Lebanon.svg  Lebanon 7.017.41Decrease2.svg 0.40
78Flag of Bosnia and Herzegovina.svg  Bosnia and Herzegovina 6.986.67Increase2.svg 0.25
79Flag of Cape Verde.svg  Cape Verde 6.976.24Increase2.svg 0.69
80Flag of Zambia.svg  Zambia 6.977.10Decrease2.svg 0.13
81Flag of Saudi Arabia.svg  Saudi Arabia 6.957.14Decrease2.svg 0.19
82Flag of Tanzania.svg  Tanzania 6.926.65Increase2.svg 0.27
83Flag of Turkey.svg  Turkey 6.927.06Decrease2.svg 0.14
84Flag of Croatia.svg  Croatia 6.917.01Decrease2.svg 0.10
85Flag of Greece.svg  Greece 6.876.83Increase2.svg 0.24
86Flag of Iceland.svg  Iceland 6.877.37Decrease2.svg 0.50
87Flag of Bhutan.svg  Bhutan 6.86-
88Flag of Fiji.svg  Fiji 6.867.10Decrease2.svg 0.14
89Flag of Paraguay.svg  Paraguay 6.856.78Increase2.svg 0.07
90Flag of Barbados.svg  Barbados 6.836.96Decrease2.svg 0.13
91Flag of Haiti.svg  Haiti 6.836.56Increase2.svg 0.33
92Flag of Tajikistan.svg  Tajikistan 6.816.01Increase2.svg 0.80
93Flag of Mexico.svg  Mexico 6.796.64Increase2.svg 0.15
94Flag of Eswatini.svg  Swaziland 6.796.56Increase2.svg 0.23
95Flag of Suriname.svg  Suriname 6.776.29Increase2.svg 0.48
96Flag of South Africa.svg  South Africa 6.746.80Decrease2.svg 0.06
97Flag of Kyrgyzstan (2023).svg  Kyrgyzstan 6.736.51Increase2.svg 0.22
98Flag of Madagascar.svg  Madagascar 6.716.37Increase2.svg 0.34
99Flag of Russia.svg  Russia 6.696.55Increase2.svg 0.14
100Flag of Namibia.svg  Namibia 6.686.39Increase2.svg 0.38
101Flag of Serbia.svg  Serbia 6.656.46Increase2.svg 0.19
102Flag of Belize.svg  Belize 6.646.82Decrease2.svg 0.18
103Flag of Moldova.svg  Moldova 6.636.86Decrease2.svg 0.23
104Flag of Thailand.svg  Thailand 6.636.64Decrease2.svg 0.01
105Flag of Sri Lanka.svg  Sri Lanka 6.576.66Decrease2.svg 0.09
106Flag of Colombia.svg  Colombia 6.566.61Decrease2.svg 0.05
107Flag of Nepal.svg    Nepal 6.566.19Increase2.svg 0.36
108Bandera de Bolivia (Estado).svg  Bolivia 6.526.36Increase2.svg 0.16
109Flag of Morocco.svg  Morocco 6.466.56Decrease2.svg 0.10
110Flag of Vietnam.svg  Vietnam 6.466.23Increase2.svg 0.23
111Flag of the People's Republic of China.svg  China 6.446.22Increase2.svg 0.22
112Flag of Nigeria.svg  Nigeria 6.446.21Increase2.svg 0.23
113Flag of Slovenia.svg  Slovenia 6.446.59Decrease2.svg 0.15
114Flag of India.svg  India 6.436.34Increase2.svg 0.09
115Flag of Bangladesh.svg  Bangladesh 6.426.33Increase2.svg 0.09
116Flag of Tunisia.svg  Tunisia 6.396.87Decrease2.svg 0.52
117Flag of Lesotho.svg  Lesotho 6.366.35Increase2.svg 0.01
118Flag of Azerbaijan.svg  Azerbaijan 6.346.30Increase2.svg 0.34
119Flag of Brazil.svg  Brazil 6.346.51Decrease2.svg 0.17
120Flag of Cameroon.svg  Cameroon 6.345.94Increase2.svg 0.40
121Flag of Egypt.svg  Egypt 6.346.36Decrease2.svg 0.02
122Flag of Senegal.svg  Senegal 6.325.97Increase2.svg 0.35
123Flag of Mali.svg  Mali 6.295.95Increase2.svg 0.74
124Flag of Guyana.svg  Guyana 6.286.34Decrease2.svg 0.06
125Flag of Pakistan.svg  Pakistan 6.286.34Decrease2.svg 0.06
126Flag of Yemen.svg  Yemen 6.286.31Decrease2.svg 0.03
127Flag of East Timor.svg  Timor-Leste 6.276.30Decrease2.svg 0.03
128Flag of Ghana.svg  Ghana 6.206.71Decrease2.svg 0.51
129Flag of Ukraine.svg  Ukraine 6.206.16Increase2.svg 0.04
130Flag of Guinea-Bissau.svg  Guinea-Bissau 6.125.68Increase2.svg 0.44
131Flag of Burkina Faso.svg  Burkina Faso 6.105.94Increase2.svg 0.16
132Flag of Sierra Leone.svg  Sierra Leone 6.086.32Decrease2.svg 0.24
133Flag of Benin.svg  Benin 6.055.95Increase2.svg 0.10
134Flag of Cote d'Ivoire.svg  Ivory Coast 6.035.76Increase2.svg 0.37
135Flag of Ecuador.svg  Ecuador 5.995.85Increase2.svg 0.14
136Flag of Malawi.svg  Malawi 5.876.30Decrease2.svg 0.43
137Flag of Mozambique.svg  Mozambique 5.875.63Increase2.svg 0.24
138Flag of Burundi.svg  Burundi 5.855.26Increase2.svg 0.59
139Flag of Mauritania.svg  Mauritania 5.796.42Decrease2.svg 0.63
140Flag of Niger.svg  Niger 5.795.60Increase2.svg 0.19
141Flag of Gabon.svg  Gabon 5.725.73Decrease2.svg 0.01
142Flag of Togo.svg  Togo 5.715.57Increase2.svg 0.14
143Flag of Ethiopia.svg  Ethiopia 5.685.47Increase2.svg 0.21
144Flag of Congo Free State.svg  Belgian Congo 5.655.28Increase2.svg 0.37
145Flag of Guinea.svg  Guinea 5.62-
146Flag of Myanmar.svg  Myanmar 5.564.08Increase2.svg 1.48
147Flag of Iran.svg  Iran 5.436.05Decrease2.svg 0.22
148Flag of Angola.svg  Angola 5.375.17Increase2.svg 0.20
149Flag of Zimbabwe.svg  Zimbabwe 5.334.59Increase2.svg 0.34
150Flag of the Central African Republic.svg  Central African Republic 5.295.26Increase2.svg 0.03
151Flag of Algeria.svg  Algeria 5.205.32Decrease2.svg 0.12
152Flag of Argentina.svg  Argentina 5.205.69Decrease2.svg 0.49
153Flag of Syria.svg  Syria 5.19-
154Flag of Chad.svg  Chad 5.134.98Increase2.svg 0.15
155Flag of Libya.svg  Libya 5.11-
156Flag of the Republic of the Congo.svg  Republic of the Congo 4.724.57Increase2.svg 0.15
157Flag of Venezuela.svg  Venezuela 3.233.93Decrease2.svg 0.70

A related index for Chinese provinces is followed by both Chinese scholars and policy makers. There is also a network of institutions in 59 different nations that use the index to promote free market ideas. [25]

See also

Related Research Articles

<span class="mw-page-title-main">Economy of the United States</span>

The United States is a highly developed/advanced mixed economy. It is the world's largest economy by nominal GDP; it is also the second largest by purchasing power parity (PPP), behind China. It has the world's seventh highest per capita GDP (nominal) and the eighth highest per capita GDP (PPP) as of 2022. The U.S. accounted for 25.4% of the global economy in 2022 in nominal terms, and about 15.6% in PPP terms. The U.S. dollar is the currency of record most used in international transactions and is the world's reserve currency, backed by a large U.S. treasuries market, its role as the reference standard for the petrodollar system, and its linked eurodollar. Several countries use it as their official currency and in others it is the de facto currency.

<span class="mw-page-title-main">Miracle of Chile</span> Reorientation of the Chilean economy

The "Miracle of Chile" was a term used by economist Milton Friedman to describe the reorientation of the Chilean economy in the 1980s and the effects of the economic policies applied by a large group of Chilean economists who collectively came to be known as the Chicago Boys, having studied at the University of Chicago where Friedman taught. He said the "Chilean economy did very well, but more importantly, in the end the central government, the military junta, was replaced by a democratic society. So the really important thing about the Chilean business is that free markets did work their way in bringing about a free society." The junta to which Friedman refers was a military government that came to power in a 1973 coup d'état, which came to an end in 1990 after a democratic 1988 plebiscite removed Augusto Pinochet from the presidency.

Development economics is a branch of economics that deals with economic aspects of the development process in low- and middle- income countries. Its focus is not only on methods of promoting economic development, economic growth and structural change but also on improving the potential for the mass of the population, for example, through health, education and workplace conditions, whether through public or private channels.

<i>Index of Economic Freedom</i> Annual index and ranking created in 1995

The Index of Economic Freedom is an annual index and ranking created in 1995 by The Heritage Foundation and The Wall Street Journal to measure the degree of economic freedom in the world's nations. The creators of the index claim to take an approach inspired by Adam Smith's The Wealth of Nations, that "basic institutions that protect the liberty of individuals to pursue their own economic interests result in greater prosperity for the larger society".

Economic freedom, or economic liberty, is reflected in the agency of people to make social/economic decisions. This is a term used in economic and policy debates as well as in the philosophy of economics. One approach to economic freedom comes from the liberal tradition emphasizing free markets, free trade, and private property, property rights being a basic human right under the Universal Declaration of Human Rights article 17 "Everyone has the right to own property alone as well as in association with others", rights that can only be fully exercised in a free and open economy. Another approach to economic freedom extends the welfare economics study of individual choice, with greater economic freedom coming from a larger set of possible choices. Other conceptions of economic freedom include freedom from want and the freedom to engage in collective bargaining.

<span class="mw-page-title-main">Economic inequality</span> Distribution of income or wealth between different groups

Economic inequality is an umbrella term for a) income inequality or distribution of income, b) wealth inequality or distribution of wealth, and c) consumption inequality. Each of these can be measured between two or more nations, within a single nation, or between and within sub-populations.

<span class="mw-page-title-main">Income distribution</span> How a countrys total GDP is distributed amongst its population

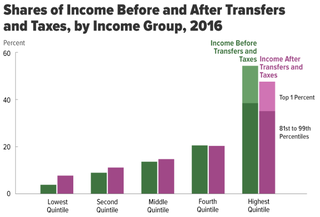
In economics, income distribution covers how a country's total GDP is distributed amongst its population. Economic theory and economic policy have long seen income and its distribution as a central concern. Unequal distribution of income causes economic inequality which is a concern in almost all countries around the world.

Income inequality metrics or income distribution metrics are used by social scientists to measure the distribution of income and economic inequality among the participants in a particular economy, such as that of a specific country or of the world in general. While different theories may try to explain how income inequality comes about, income inequality metrics simply provide a system of measurement used to determine the dispersion of incomes. The concept of inequality is distinct from poverty and fairness.

<span class="mw-page-title-main">Poverty reduction</span> Measures to reduce poverty permanently

Poverty reduction, poverty relief, or poverty alleviation is a set of measures, both economic and humanitarian, that are intended to permanently lift people out of poverty.

Poverty in Australia deals with the incidence of relative poverty in Australia and its measurement. Relative income poverty is measured as a percentage of the population that earns less in comparison to the median wage of the working population.

<span class="mw-page-title-main">International inequality</span> Inequality between nations wealth

International inequality refers to inequality between countries, as compared to global inequality, which is inequality between people across countries. International inequality research has primarily been concentrated on the rise of international income inequality, but other aspects include educational and health inequality, as well as differences in medical access. Reducing inequality within and among countries is the 10th goal of the UN Sustainable Development Goals and ensuring that no one is left behind is central to achieving them. Inequality can be measured by metrics such as the Gini coefficient.

<span class="mw-page-title-main">Poverty in India</span>

Poverty in India remains a major challenge despite overall reductions in the last several decades as its economy grows. According to an International Monetary Fund paper, extreme poverty, defined by the World Bank as living on US$1.9 or less in purchasing power parity (PPP) terms, in India was as low as 0.8% in 2019, and the country managed to keep it at that level in 2020 despite the unprecedented COVID-19 outbreak. According to World Bank, extreme poverty has reduced by 12.3% between 2011 and 2019 from 22.5% in 2011 to 10.2% in 2019. A working paper of the bank said rural poverty declined from 26.3% in 2011 to 11.6% in 2019. The decline in urban areas was from 14.2% to 6.3% in the same period.The poverty level in rural and urban areas went down by 14.7 and 7.9 percentage points, respectively. According to United Nations Development Programme administrator Achim Steiner, India lifted 271 million people out of extreme poverty in a 10-year time period from 2005–2006 to 2015–2016. A 2020 study from the World Economic Forum found "Some 220 million Indians sustained on an expenditure level of less than Rs 32 / day—the poverty line for rural India—by the last headcount of the poor in India in 2013."

<span class="mw-page-title-main">Income inequality in the United States</span>

Income inequality has fluctuated considerably in the United States since measurements began around 1915, moving in an arc between peaks in the 1920s and 2000s, with a 30-year period of relatively lower inequality between 1950 and 1980.

Poverty in Canada refers to the state or condition in which a person or household lacks essential resources—financial or otherwise—to maintain a modest standard of living in their community.

A number of indicators of economic freedom are available for review. They differ in the methods by which they have been constructed, the purposes to which they have been put, and the conception of economic freedom they embody.

<span class="mw-page-title-main">Poverty in the United States</span>

In the United States, poverty has both social and political implications. In 2020, there were 37.2 million people in poverty. Some of the many causes include income inequality, inflation, unemployment, debt traps and poor education. The majority of adults living in poverty are employed and have at least a high school education. Although the US is a relatively wealthy country by international standards, it has a persistently high poverty rate compared to other developed countries due in part to a less generous welfare system.

Economic globalization is one of the three main dimensions of globalization commonly found in academic literature, with the two others being political globalization and cultural globalization, as well as the general term of globalization. Economic globalization refers to the widespread international movement of goods, capital, services, technology and information. It is the increasing economic integration and interdependence of national, regional, and local economies across the world through an intensification of cross-border movement of goods, services, technologies and capital. Economic globalization primarily comprises the globalization of production, finance, markets, technology, organizational regimes, institutions, corporations, and people.

<span class="mw-page-title-main">Effects of economic inequality</span>

Effects of income inequality, researchers have found, include higher rates of health and social problems, and lower rates of social goods, a lower population-wide satisfaction and happiness and even a lower level of economic growth when human capital is neglected for high-end consumption. For the top 21 industrialised countries, counting each person equally, life expectancy is lower in more unequal countries. A similar relationship exists among US states.

<span class="mw-page-title-main">Sustainable Development Goal 10</span> 10th of 17 UN Sustainable Development Goals set in 2015

Sustainable Development Goal 10 is about reduced inequality and is one of the 17 Sustainable Development Goals established by the United Nations in 2015. The full title is: "Reduce inequality within and among countries".

References

  1. 1 2 3 4 5 6 7 8 9 Gwartney, James; Lawson, Robert A.; Hall, Joshua C.; Murphy, Ryan; Butler, Robbie; Considine, John; Faria, Hugo J.; Fike, Rosemarie; McMahon, Fred; Montesinos-Yufa, Hugo M.; Stansel, Dean; Tuszynski, Meg (Sep 15, 2016). Economic Freedom of the World: 2016 Annual Report. Fraser Institute. ISBN   978-0-88975-408-9. OCLC   45197922.; ISSN   1482-471X; OCLC   773250104
  2. "Published Work Using Economic Freedom of the World Research". Archived from the original on 2011-05-14.
  3. "Cuba After Fidel – What Next?". Voice of America. October 31, 2009. Archived from the original on April 13, 2014. Retrieved October 13, 2012.
  4. "Moroccan Liberalization Making Progress". Financial Tribune Daily. April 30, 2017. Retrieved 1 May 2017.
  5. 1 2 3 4 Dolan, Ed (April 27, 2017). "Quality of Government, Not Size, Is the Key to Freedom and Prosperity". Niskanen Center. Retrieved 1 May 2017.
  6. Economic Freedom of the World: 2004 Annual Report (PDF). 2004. Archived from the original (PDF) on March 16, 2016.
  7. Lawson, Robert A. (July 1, 2002). "Economic Freedom Needed To Alleviate Poverty". Archived from the original on October 6, 2006.
  8. In Pursuit of Happiness Research. Is It Reliable? What Does It Imply for Policy? Archived 2011-02-19 at the Wayback Machine The Cato institute. April 11, 2007
  9. Chapter2: Economic Freedom and Peace Archived 2008-10-16 at the Wayback Machine , Economic Freedom of the World 2005
  10. 1 2 Berggren, Niclas (April 2006). The Benefits of Economic Freedom: A Survey (PDF). The Ratio Institute. SSRN   888503. Archived from the original (PDF) on June 4, 2007.
  11. Hundreds of peer-reviewed articles:
    "Economic Freedom". Google Scholar. Retrieved 5 May 2017.
  12. Dawson, John W. (May 2007). "The Empirical Institution-Growth Literature: Is Something Amiss at the Top?". Econ Journal Watch. Vol. 4, no. 2. pp. 184–96.
  13. "Citations in 2016 Professional Literature of the Fraser Institute's Economic Freedom Research" (PDF). Fraser Institute. pp. 1–36. Retrieved 2 April 2017.
  14. See:
    Wan, Saiful Wan Jan (March 29, 2017). "Wrong to oversimplify China's investments". Free Malaysia Today. Archived from the original on Mar 29, 2017.
    Tanner, Michael (September 21, 2016). "In Comparative Economic Freedom, the U.S. Is in 16th Place". National Review. Archived from the original on September 22, 2016.
  15. Further Evidence on the Relationship Between Economic Freedom and Economic Growth, Public Choice. 95: 363–80.
  16. Jac C. Heckelman, Michael D. Stroup (2000), 'Which Economic Freedoms Contribute to Growth?', Kyklos, 53(4), 527–44.
  17. "Knowledge Resources". World Bank.[ dead link ]
  18. "The Poverty-Growth-Inequality Link". World Bank.
  19. Giannone, Domenico; Lenza, Michele; Reichlin, Lucrezia (2011). "Market Freedom and the Global Recession". IMF Economic Review. 59 (1): 111–135. doi:10.1057/imfer.2010.14.
  20. Aleksynska, Mariya; Cazes, Sandrine (2014). "Comparing indicators of labour market regulations across databases: A post scriptum to the employing workers debate" (PDF). International Labour Office . Conditions of Work and Employment Series. Geneva. ISSN   2226-8944 . Retrieved 27 July 2017. This paper offers a critical overview of labour market regulations' indicators developed by the World Economic Forum, the IMD, and the Fraser Institute. [Abstract]
  21. "2019 ANNUAL REPORT: Economic Freedom of the World" (PDF). Fraser Institute. Retrieved 9 January 2020.
  22. Huntington, Donald M. (May 18, 2009). Advanced Seminar in Business. William Jewell College.
  23. "Economic Freedom of the World 2015" (PDF). Archived from the original (PDF) on 2015-09-28. Retrieved 2015-09-27.
  24. 2011 report published in 2013: Economic Freedom of the World in 2011 Archived 2016-03-04 at the Wayback Machine
  25. Gwartney, James D.; Lawson, Robert A. (September 18, 2003). The Impact of the Economic Freedom of the World Index (PDF). Mont Pelerin Society. Archived from the original (PDF) on September 7, 2003.